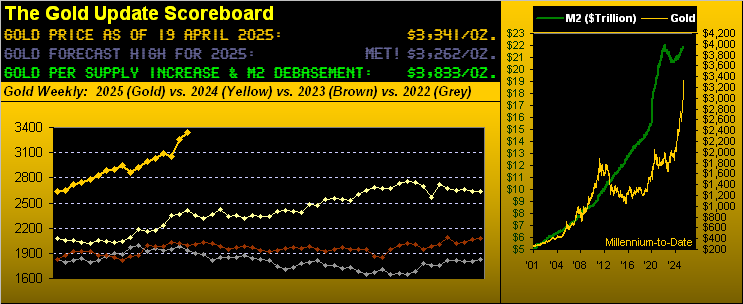
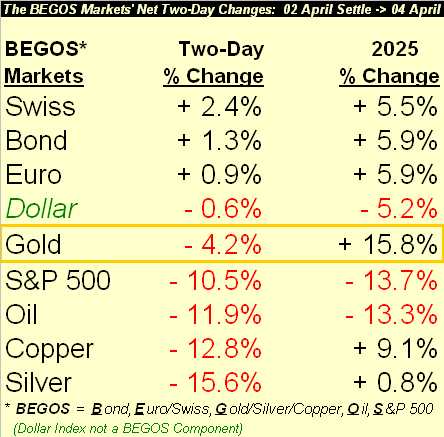
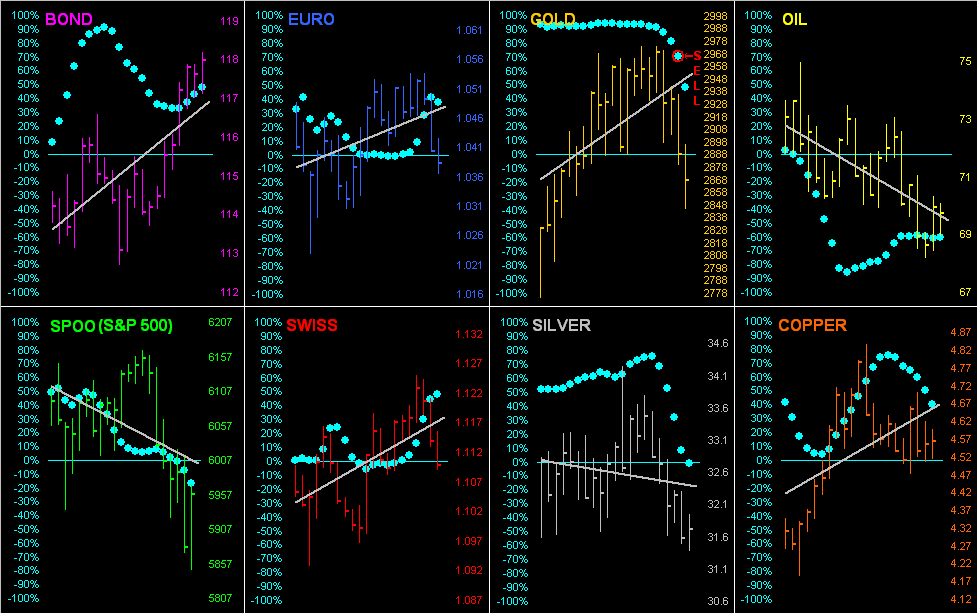
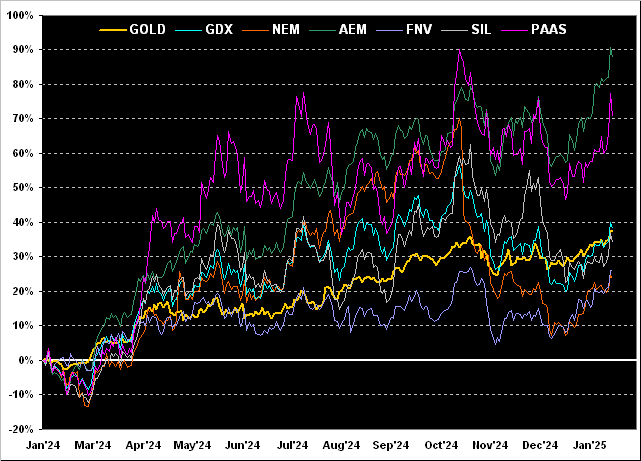
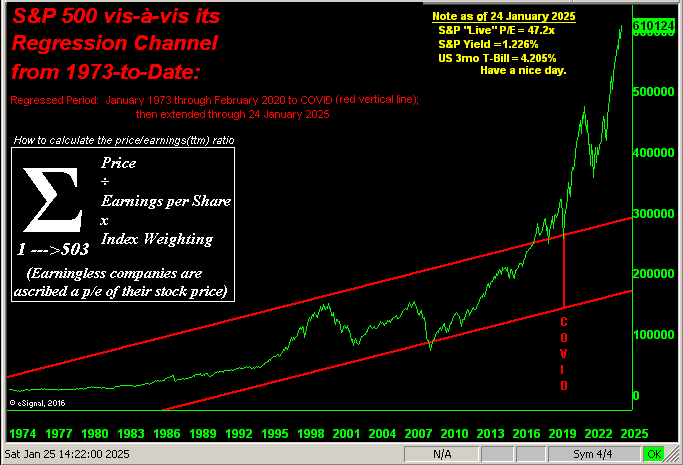
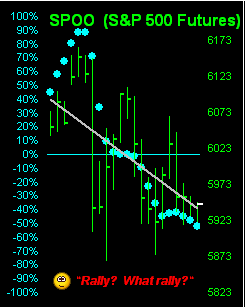
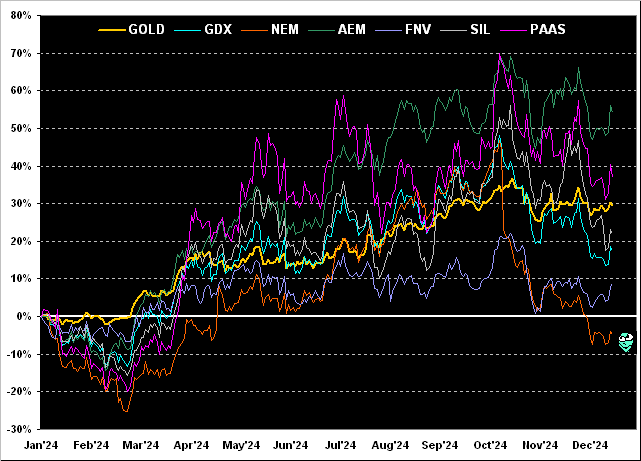
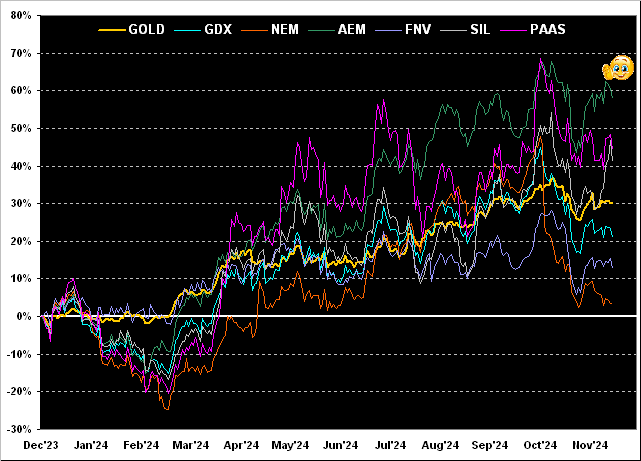
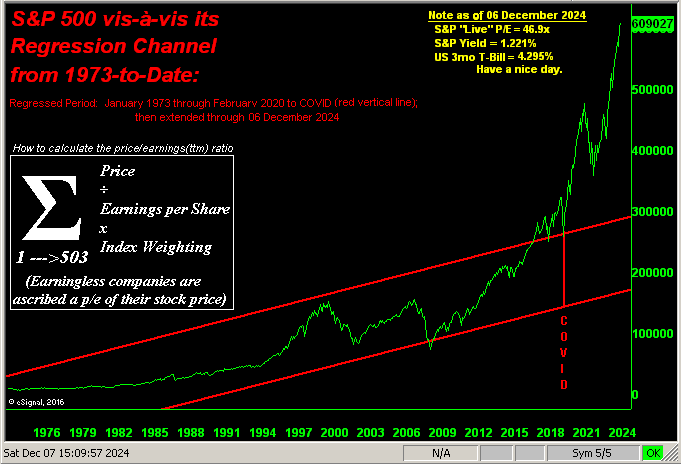
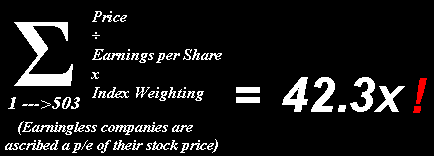
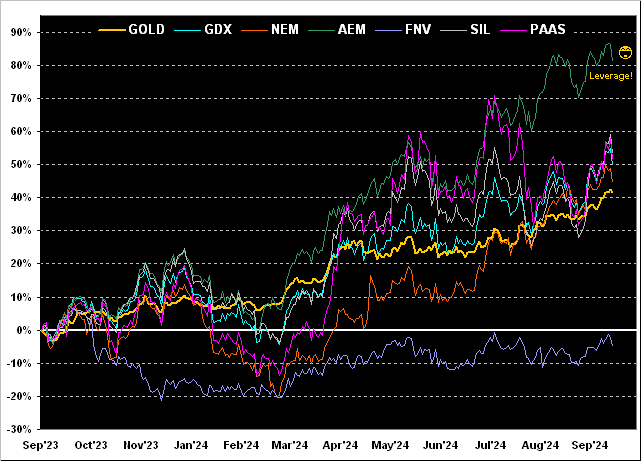
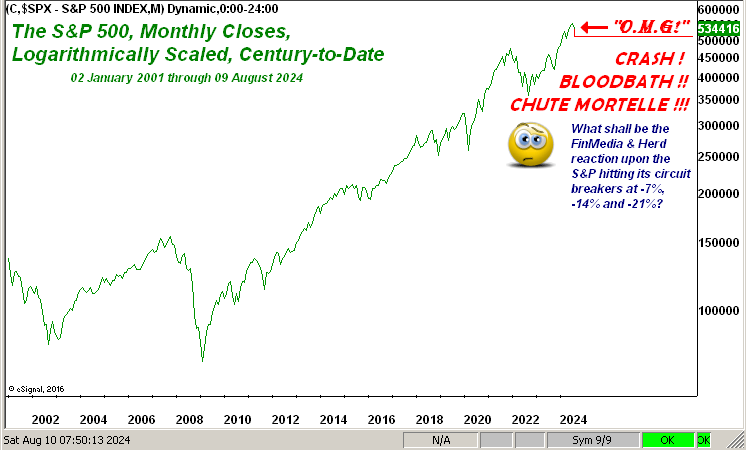
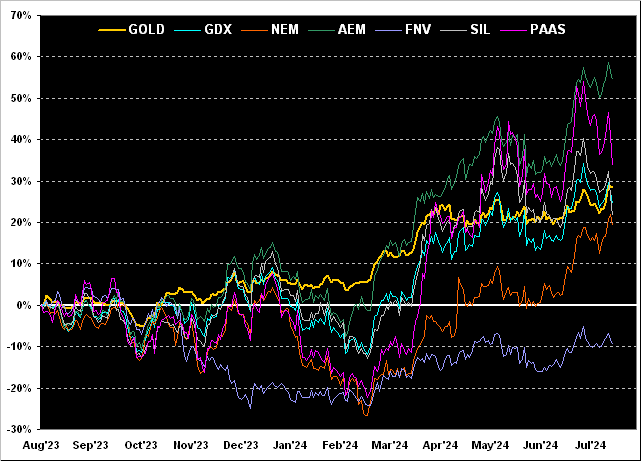
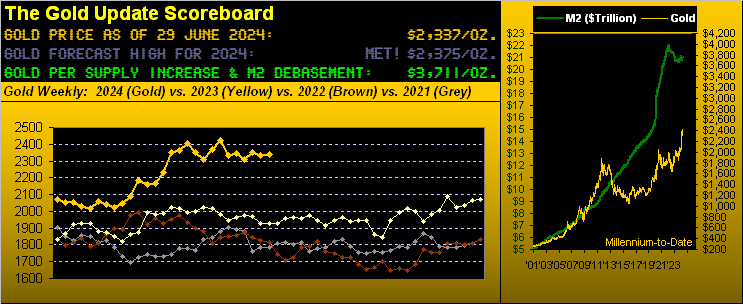
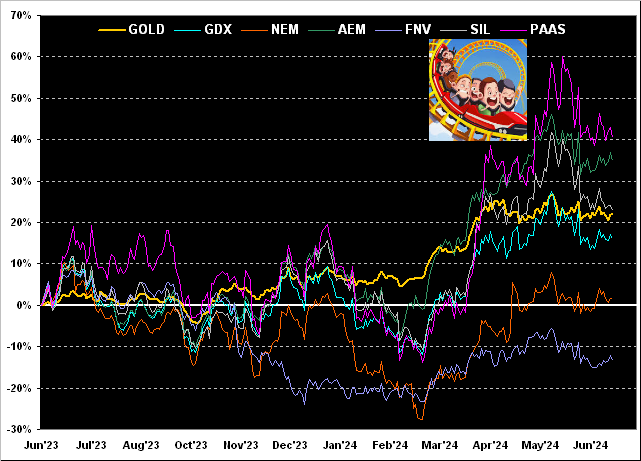
Yes, across the 2024 BEGOS Markets’ spectrum, the year’s best performer was Gold’s +27.4% increase. ‘Course, for the math-challenged FinMedia, all the talk has instead been over the S&P 500’s +23.3% gain. ‘Tis the quintessential example of “Money talks, Wealth whispers”. (Got Gold?)
On to 2025. And as ’tis been absolutely eons since we’ve had a pop quiz in The Gold Update, let’s begin the year with one. Ready?
- What was the last year wherein Gold netted a yearly gain for a third consecutive time?
If (without looking it up) you answered “2012” you’ve earned a Gold Star.
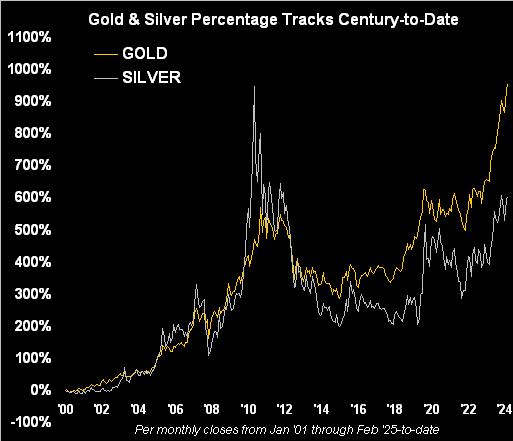
Moreover, through this century-to-date’s 24 completed years, Gold netted yearly gains 12 consecutive times from 2001 through 2012.
Since then however, such streak has succumbed to becoming “herky-jerky” (technical term). Following those 12 consecutive up years, Gold then netted:
- Three consecutive yearly losses from 2013 through 2015;
- Two gains for 2016 and 2017;
- A loss in 2018;
- Two gains for 2019 and 2020;
- Two losses in 2021 and 2022;
- Two gains for 2023 and 2024.
Thus if such “herky-jerky” pattern of these past 12 years continues, Gold shall suffer a net loss for this year 2025 … but we don’t think so. Rather, for the first time since 2012, we look to Gold’s recording a third consecutive net yearly gain.
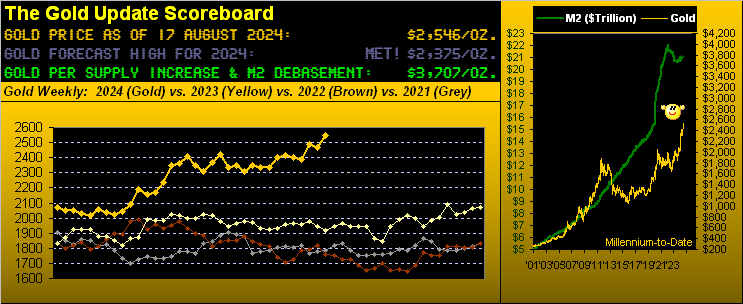
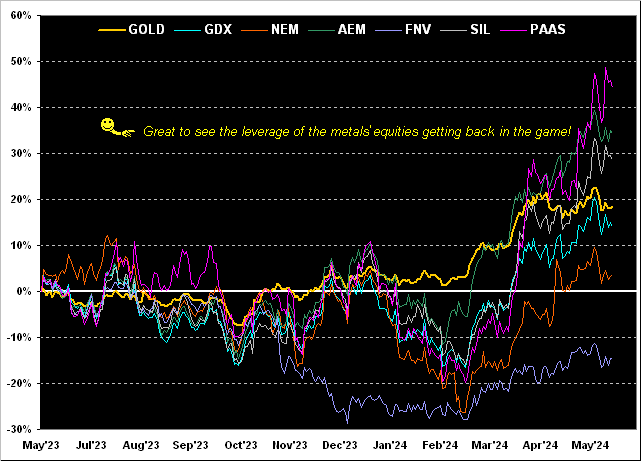
Despite the FinMedia’s disinclination to highlight Gold, from our purview it continues to quietly be gaining a wee degree of (pardon the yucky woke word) “awareness”. To the extent that Gold ownership is increasing is a reflection of its price having risen, certainly so across the past two years.
Still, trying to estimate the percentage of Gold owned by various entities yields quite a large standard deviation. Pro-Gold bugs push that a mere 0.5% of individuals carry exposure to the yellow metal; AI (“Assembled Inaccuracy”) puts portfolio exposure up toward 10%; and (hat-tip The World Gold Council) private individuals own more Gold than do governments and banks combined.
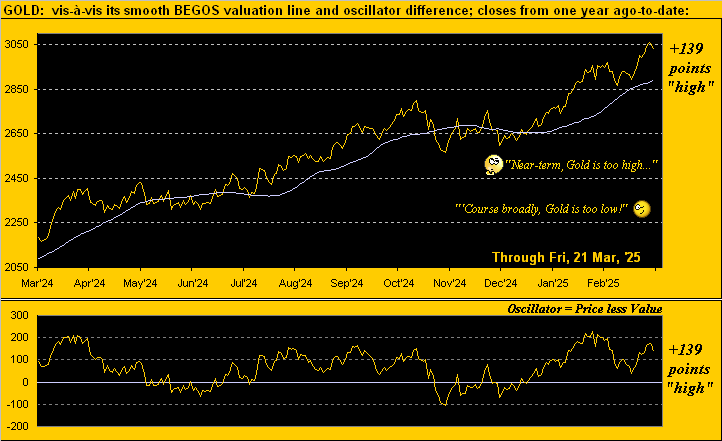
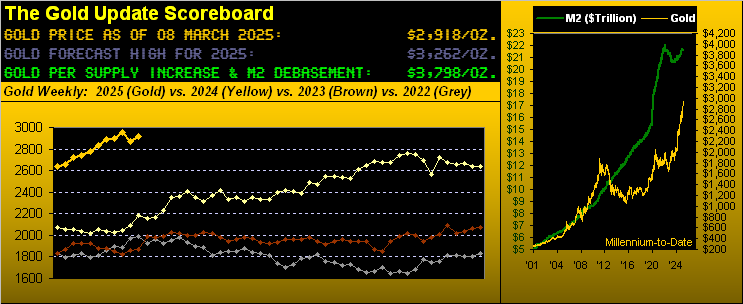
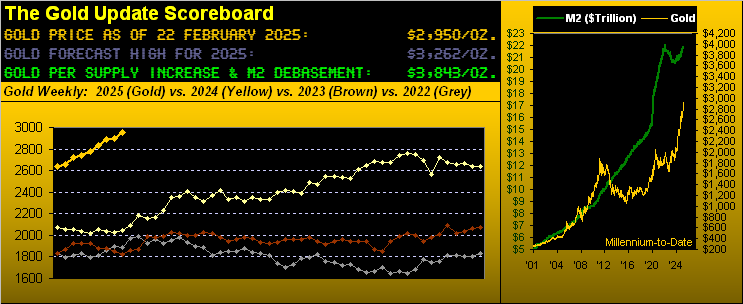
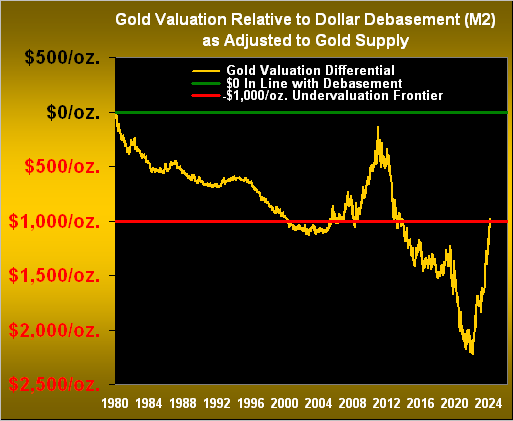
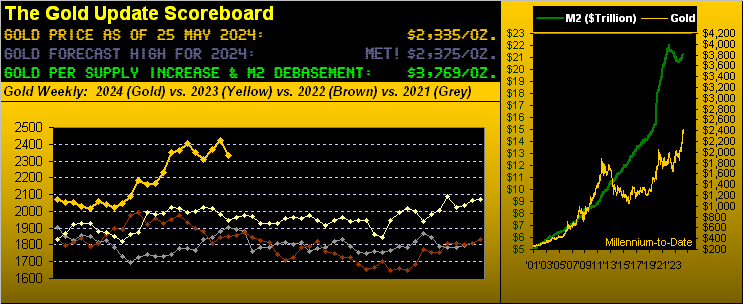
Regardless — and with specificity to the debasement of currency as the ultimate driver of valuation — Gold’s price trend clearly is up.
“So let’s get to it, mmb: what’s Gold’s high gonna be for this year?”
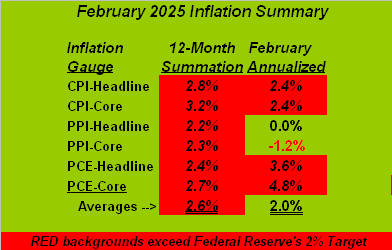
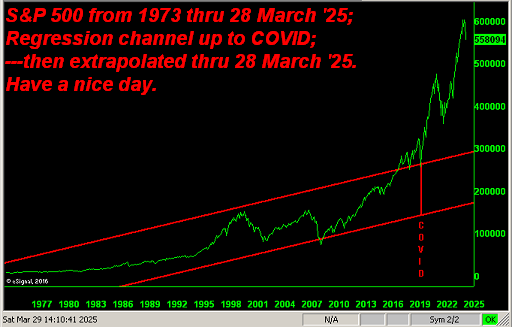
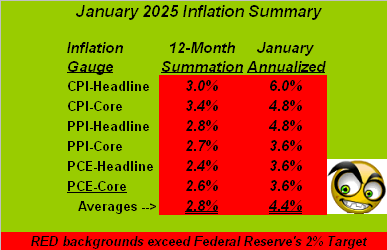
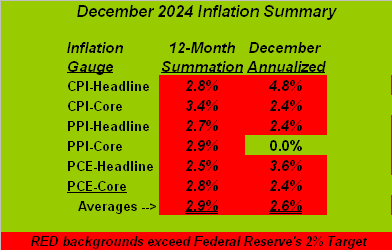
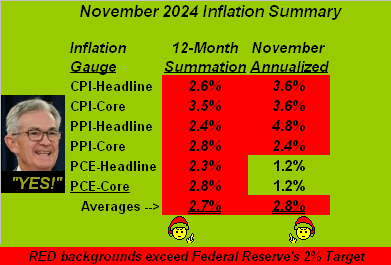
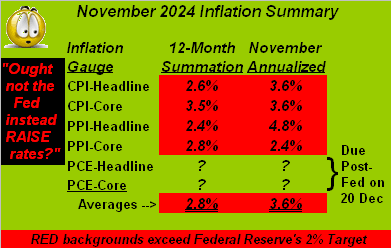
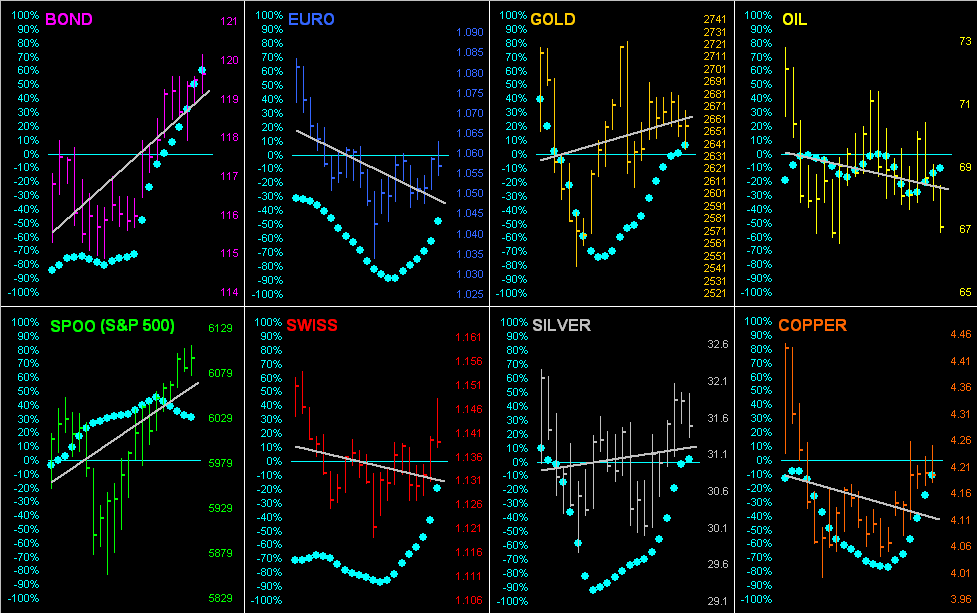
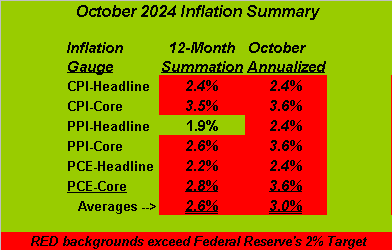
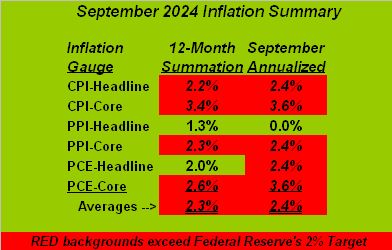
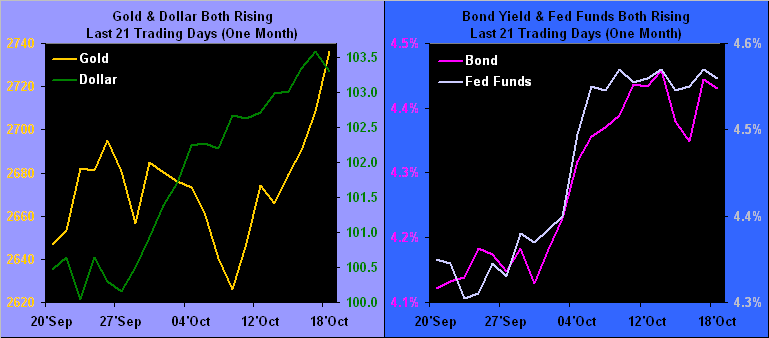
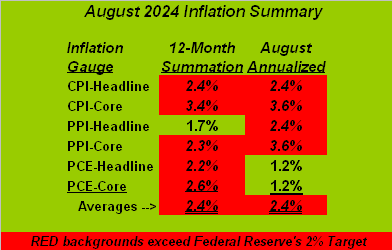
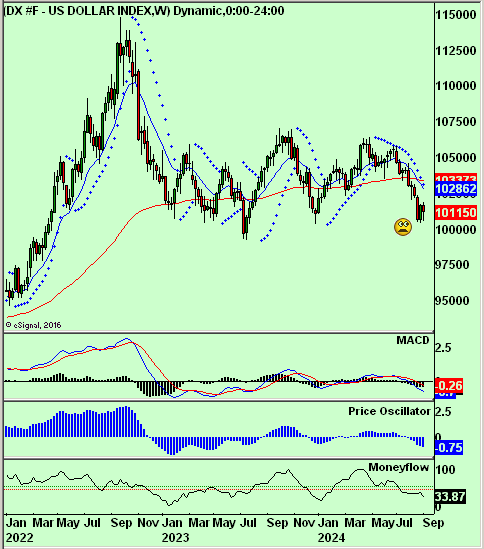
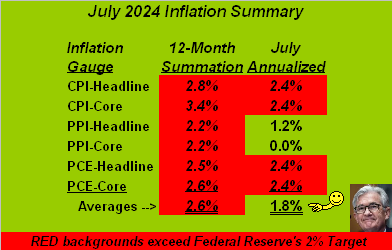
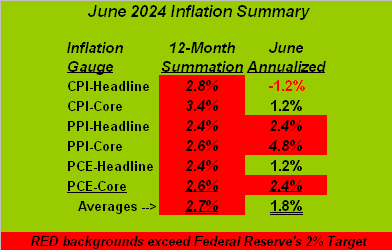
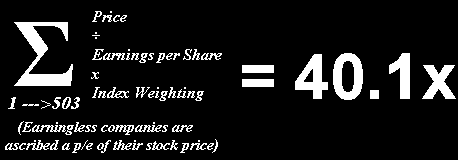
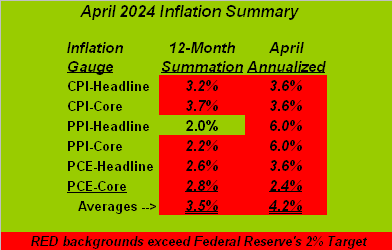
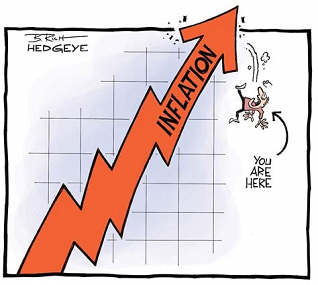
First, Squire, as acknowledged above, Gold could put in a down year. Should StateSide inflation — which as you regular readers know — remain above the Federal Reserve’s +2% target, interest rate decreases then morph back into increases. In turn, the Dollar becomes more attractive still, and both the horrifically overvalued S&P 500 and Gold (at least initially) descend. Naturally, inflation inevitably works back into Gold’s favour. But such negative scenario is quite real — one might even say “anticipated” amongst the currency bunch — given the Dollar’s increase throughout Q4 of last year. Indeed for 2024 per our the BEGOS Markets’ Standings, the Dollar Index netted an annual gain of +7.1% … but Gold (which as you know plays no currency favourites) went up anyway.
Still, at the end of the day, we expect Gold’s positives to will out, and certainly so the creation of more dough. To repeat that herein penned just a week ago: “And the month’s Main Event commences 14 January upon U.S. Secretary of the Treasury Janet ‘Old Yeller’ Yellen begging for dough upon which to draw to pay obligations on the nation’s debt.” Whoopsie.
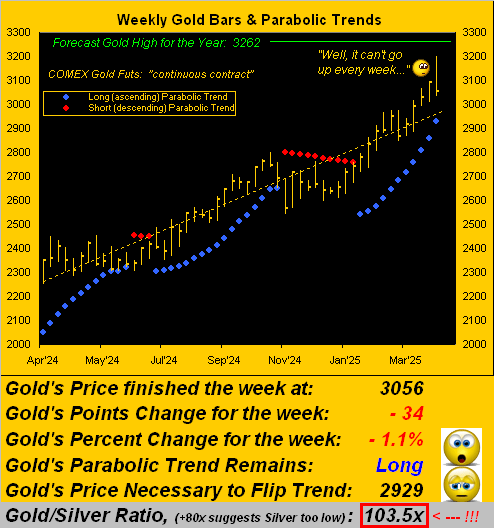
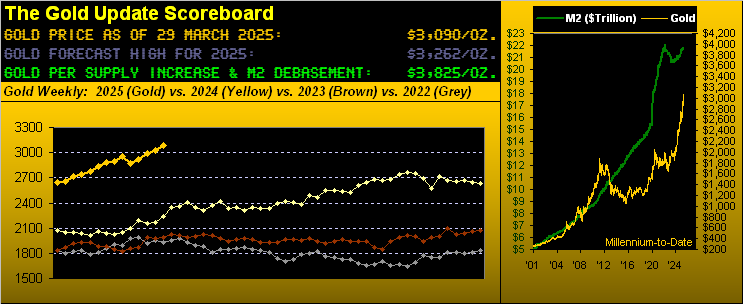
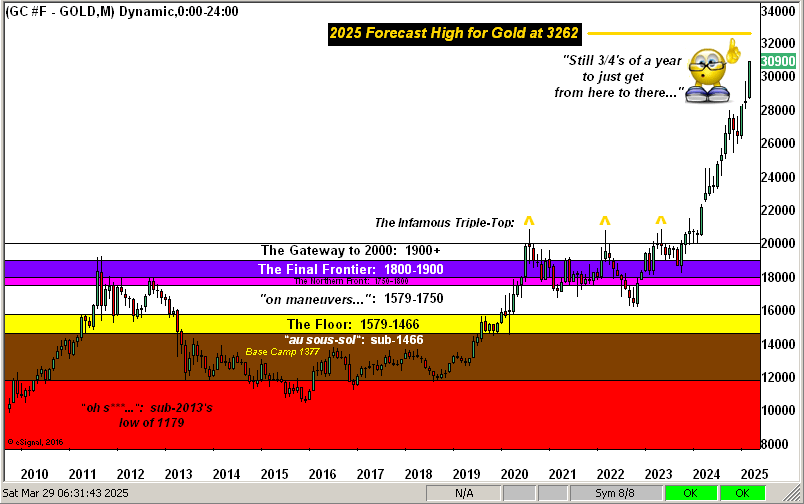
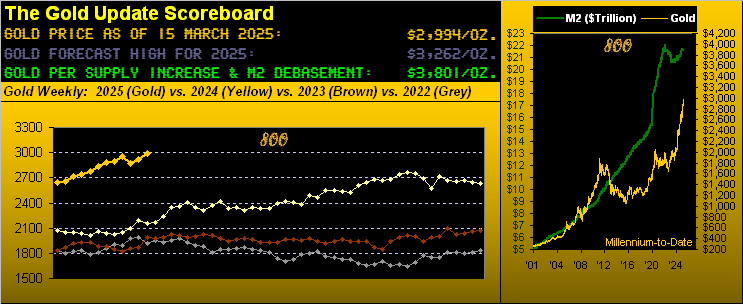
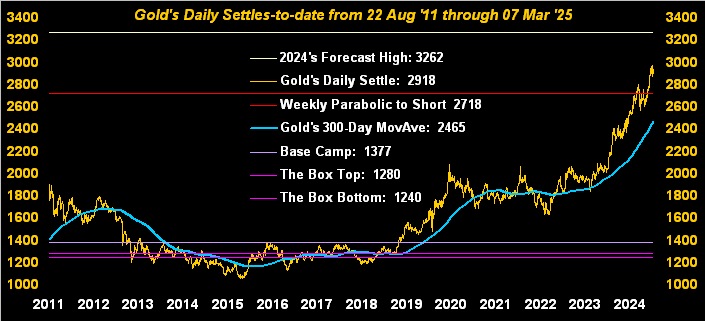
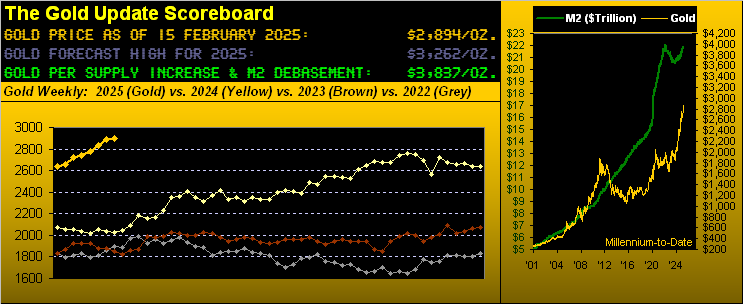
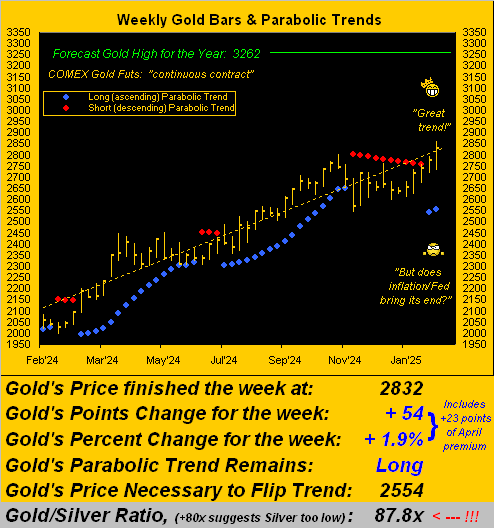
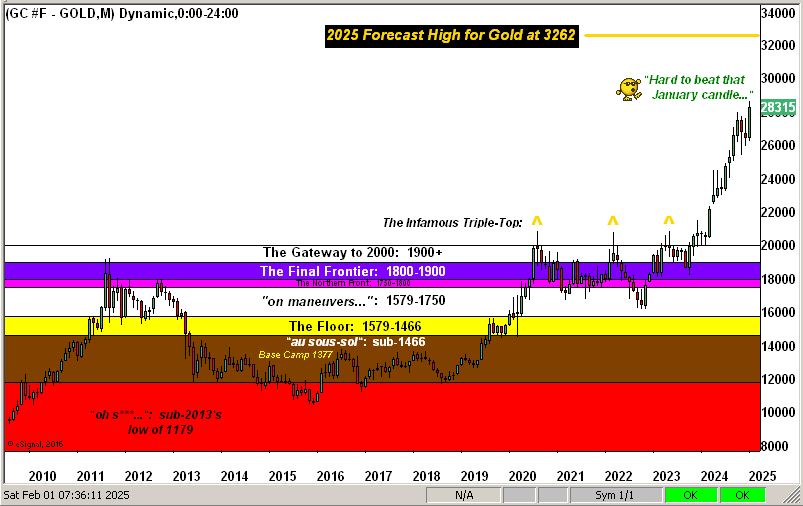
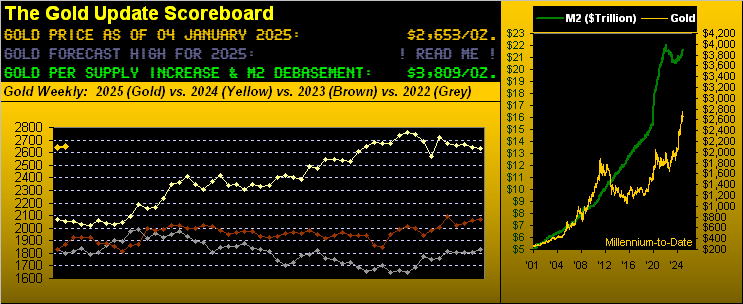
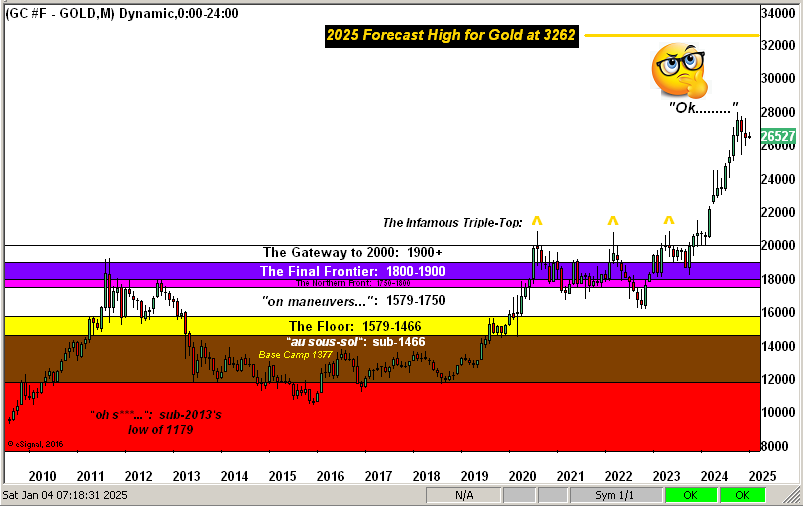
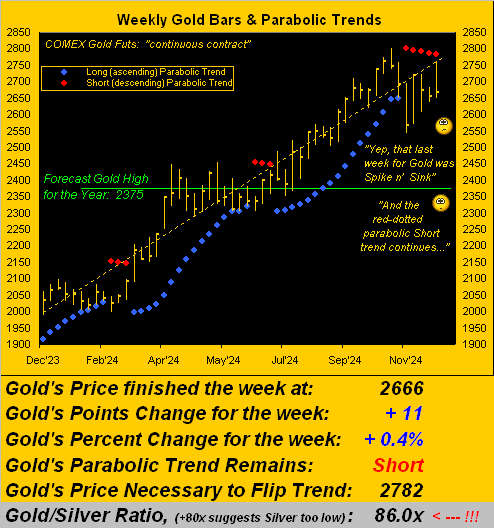
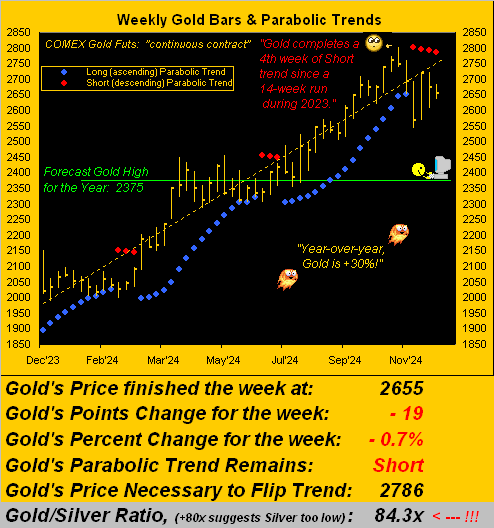
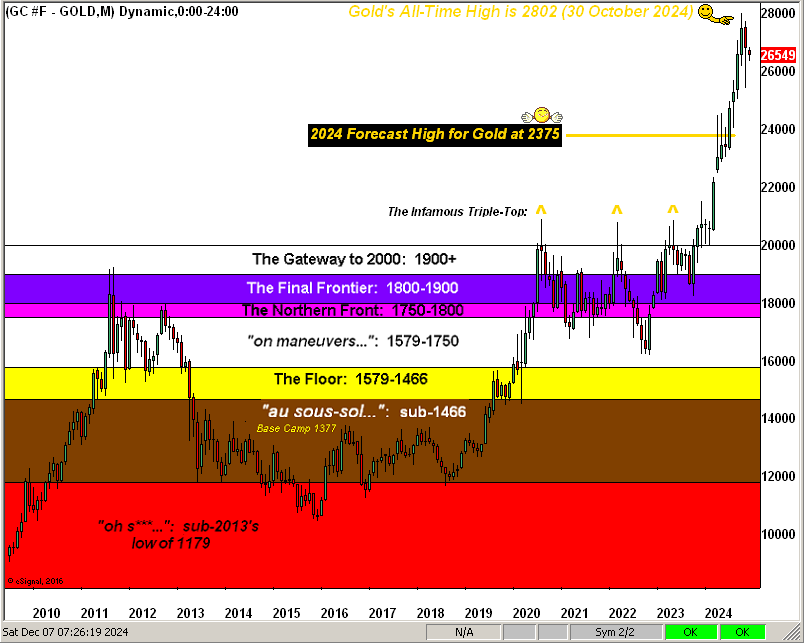
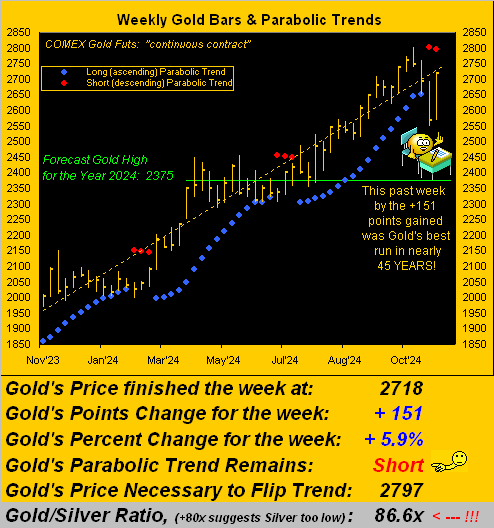
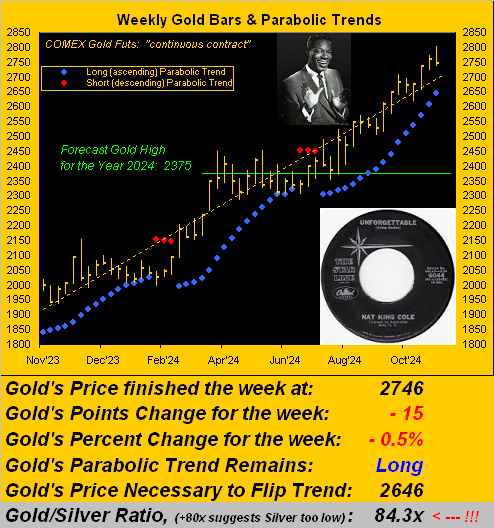
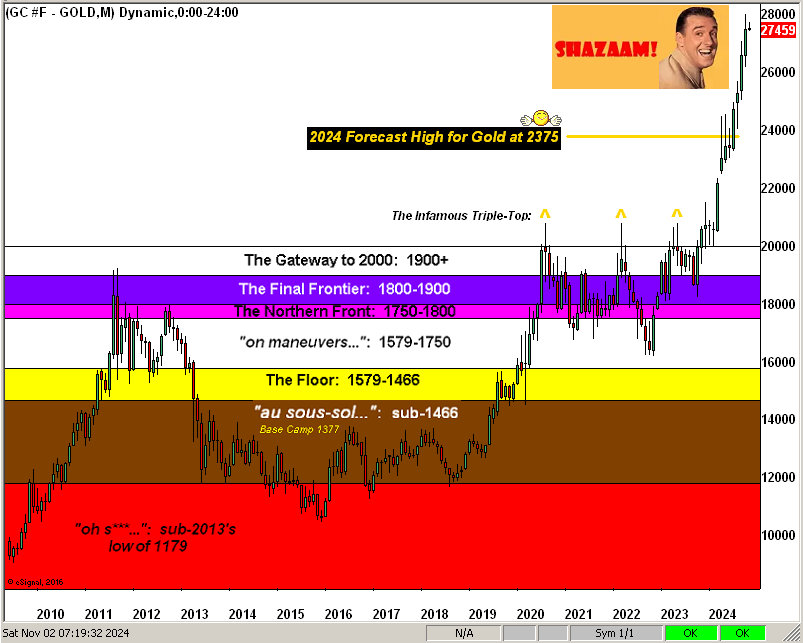
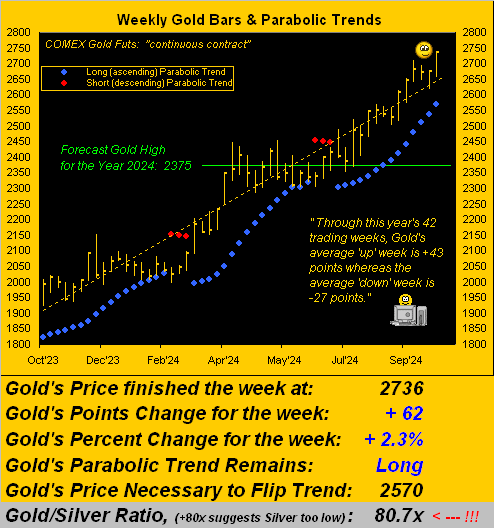
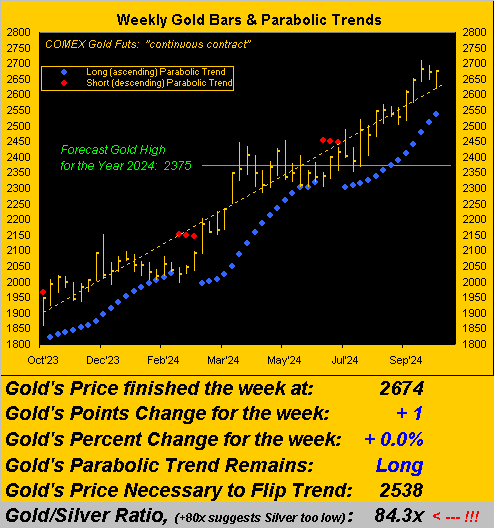
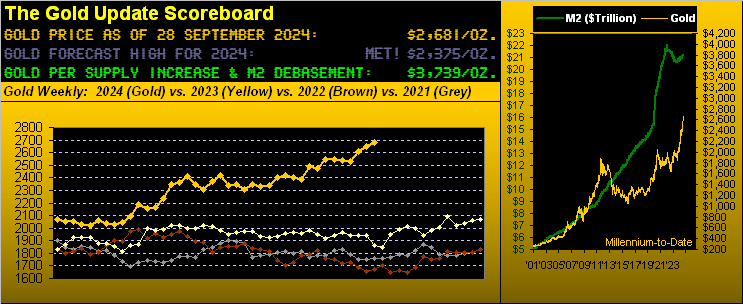
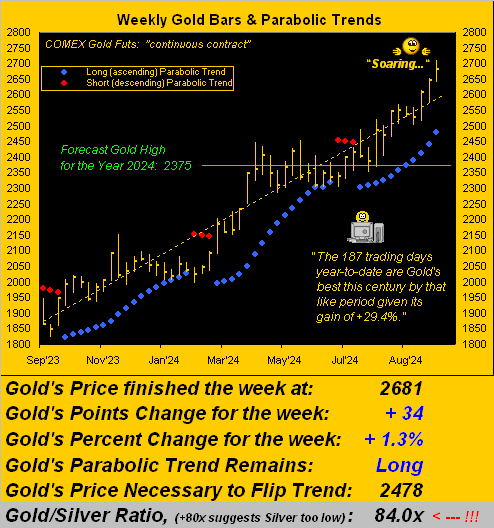
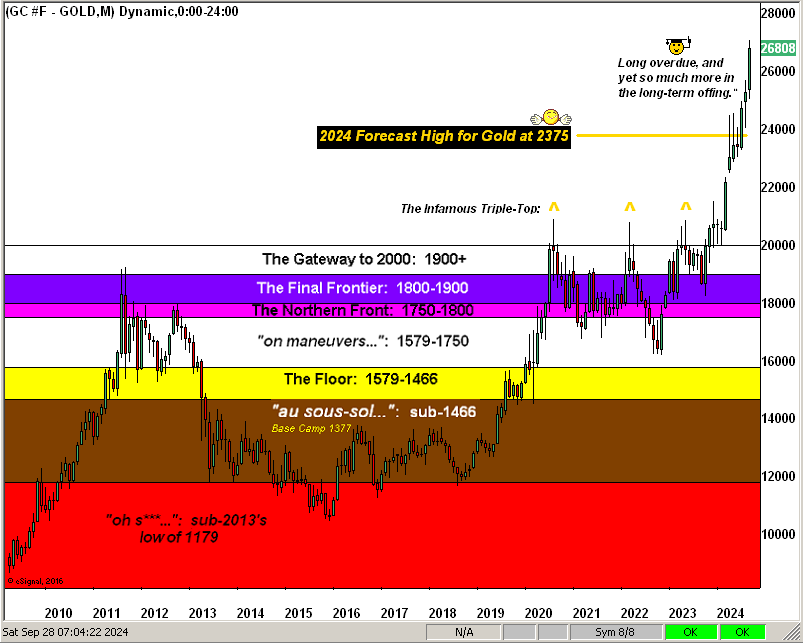
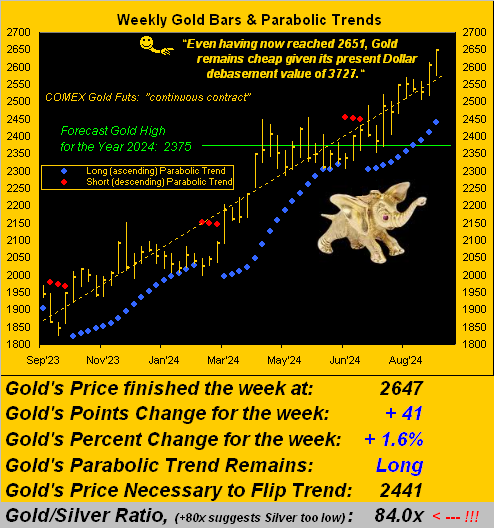
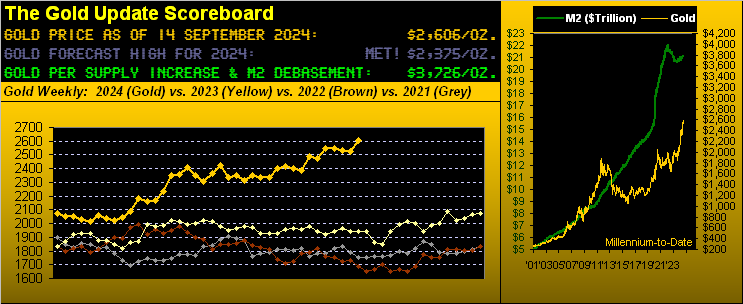
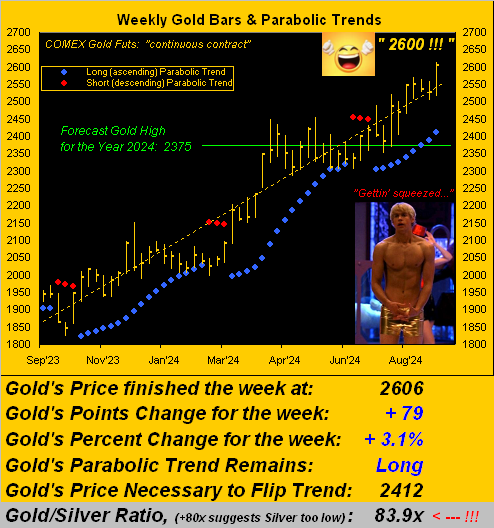
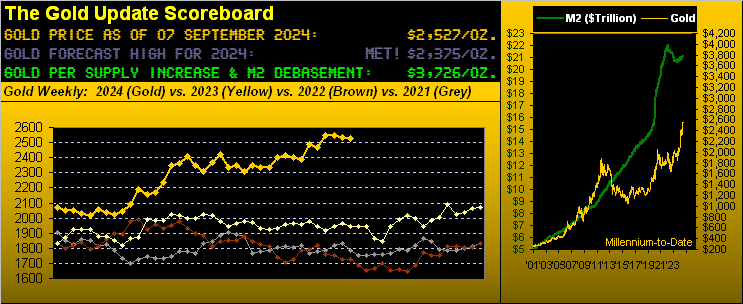
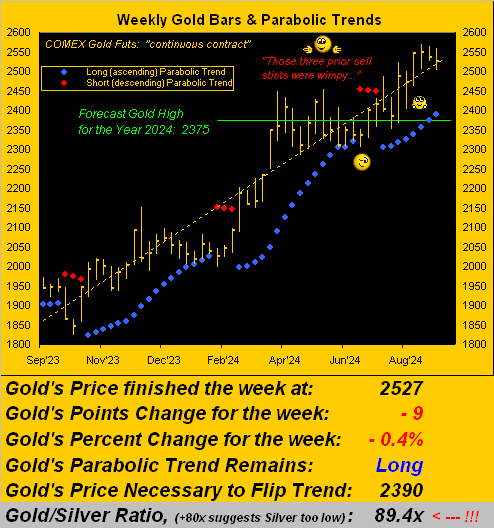
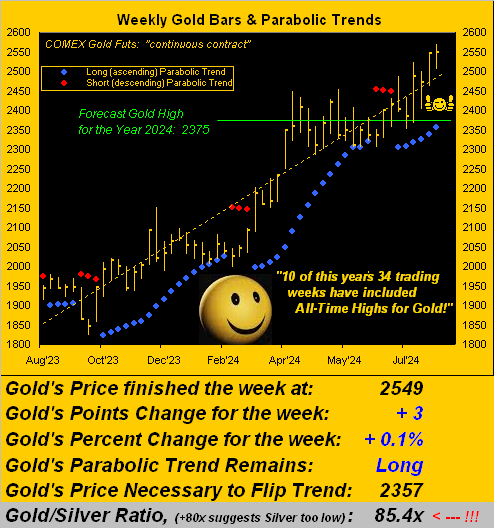
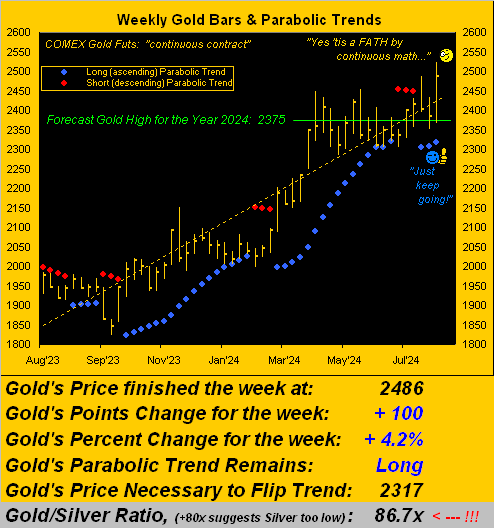
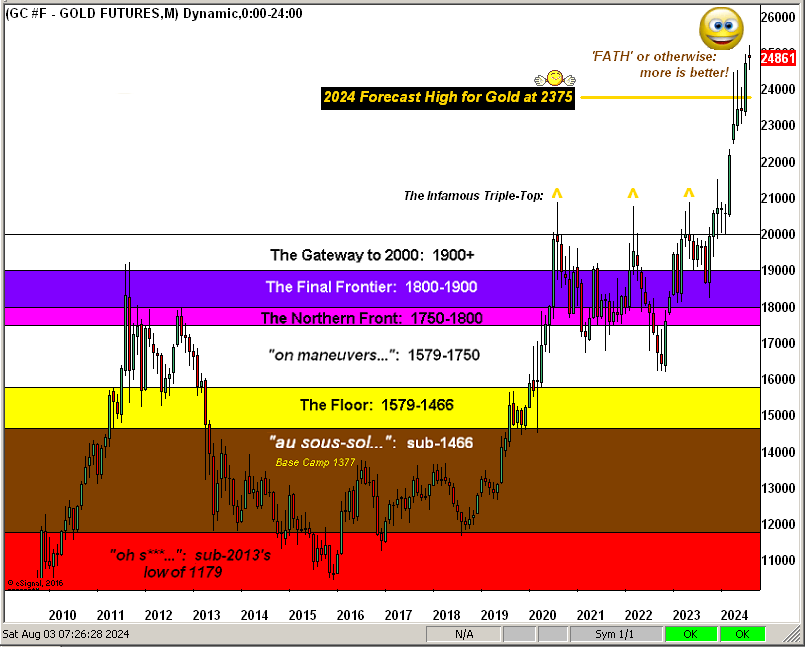
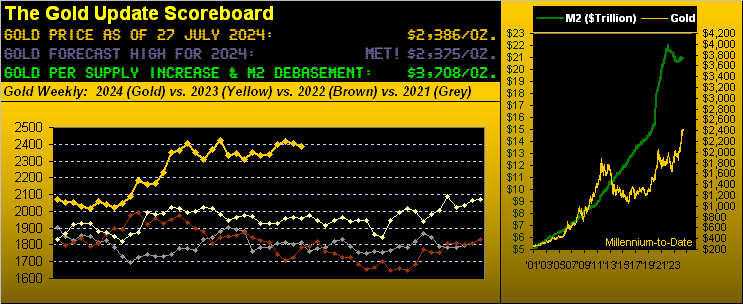
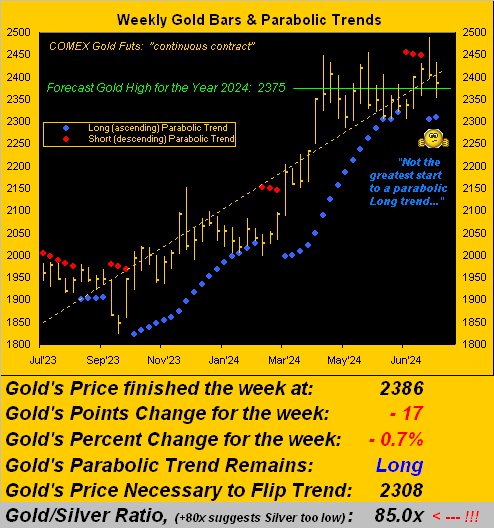
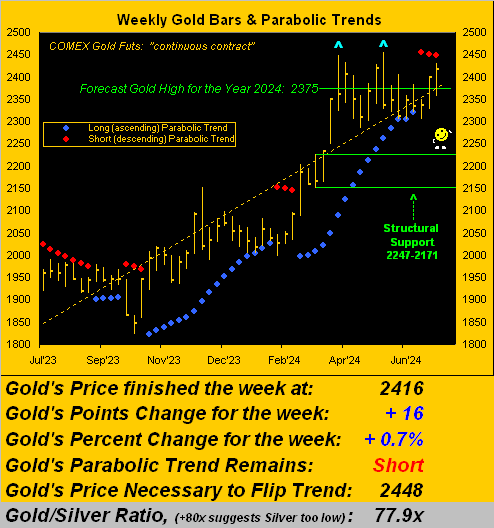
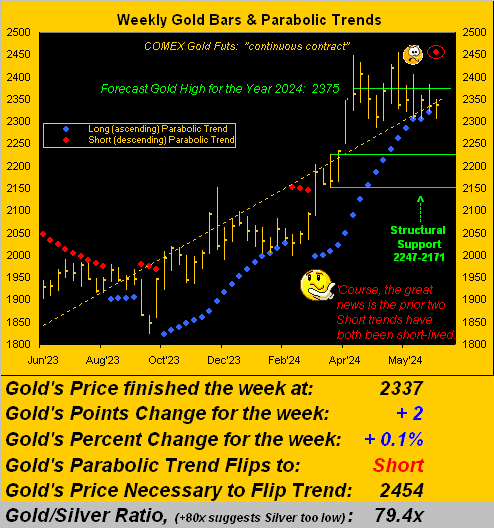
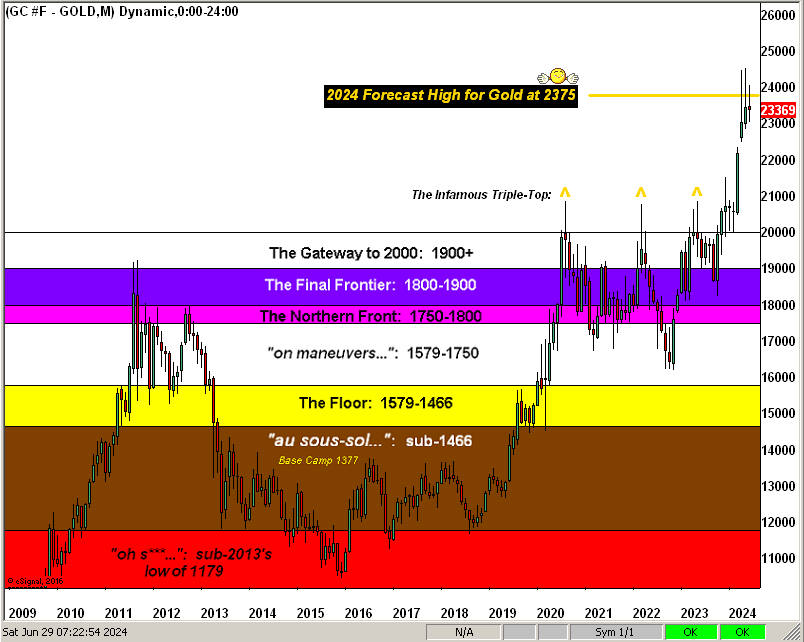
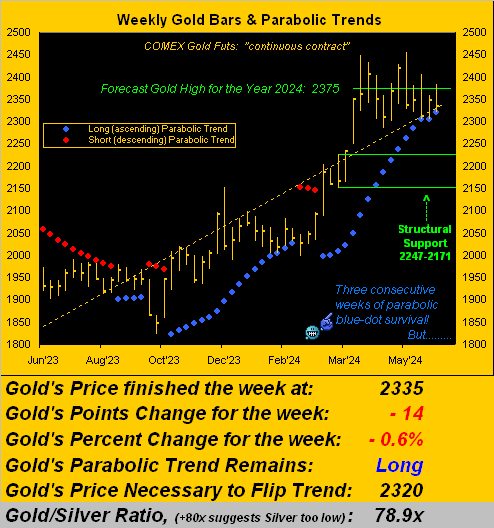
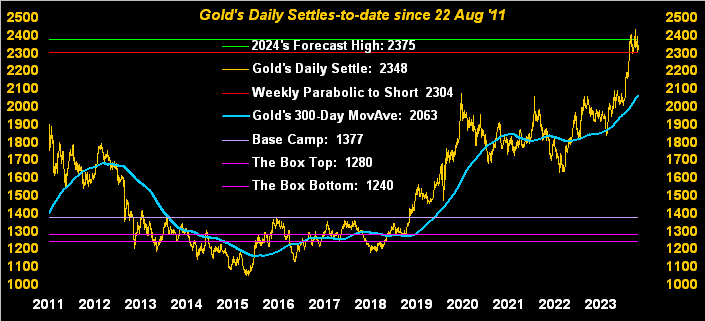
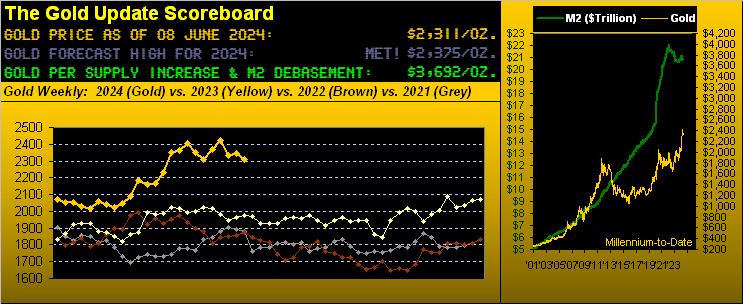
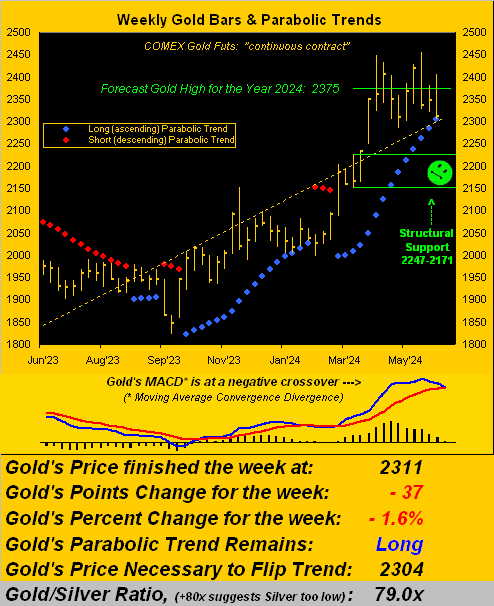
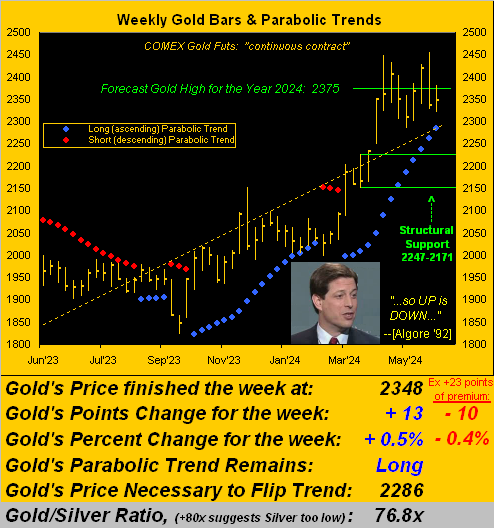
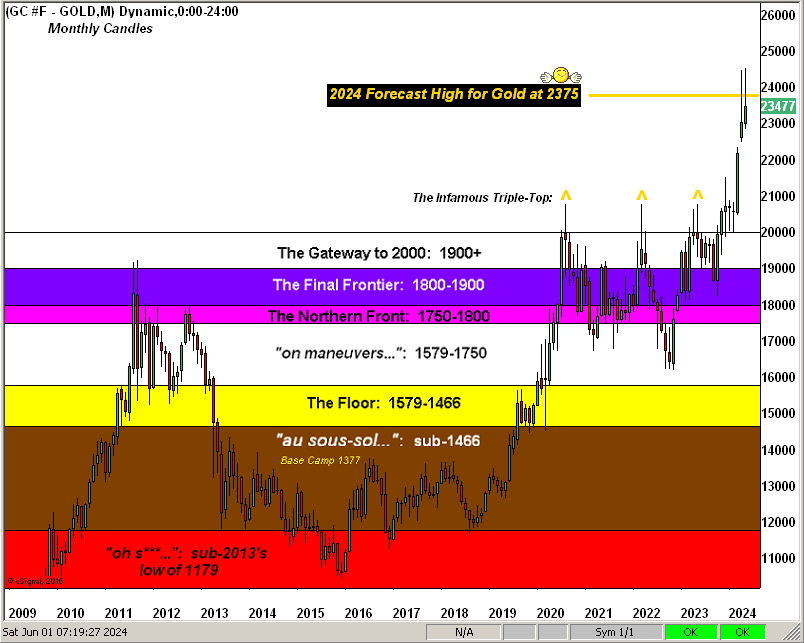
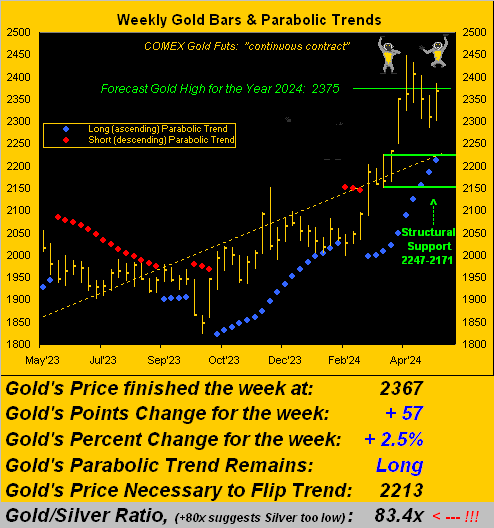
As to Gold’s high in ’25: recall a year ago our opening missive was entitled “Gold – We Conservatively Forecast 2375 for 2024’s High“ … and such forecast turned out to indeed be “conservative”, price rather swiftly arriving at the 2375 target on 09 April en route to the current All-Time High of 2802 on 30 October. For 2025, we’re a bit more “aggressive” especially having just acknowledged Gold could put in a down year.
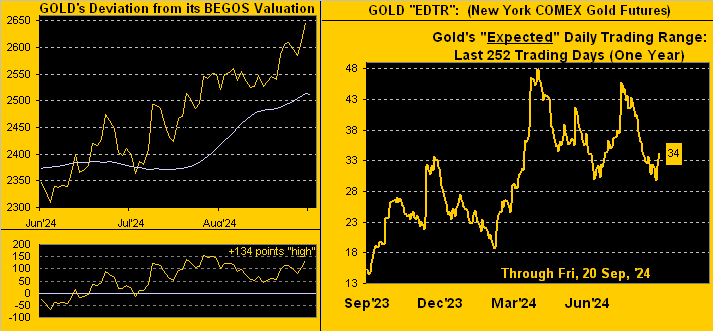
However, given our perspective that ’twill be an up year, in establishing a forecast Gold high, we employed the quantitative aspects used to present the website’s “Market Ranges” page, in this case to solve for Gold’s “expected yearly trading range”. We like this approach as it supports maintaining prudent cash management, (the most important element of trading).
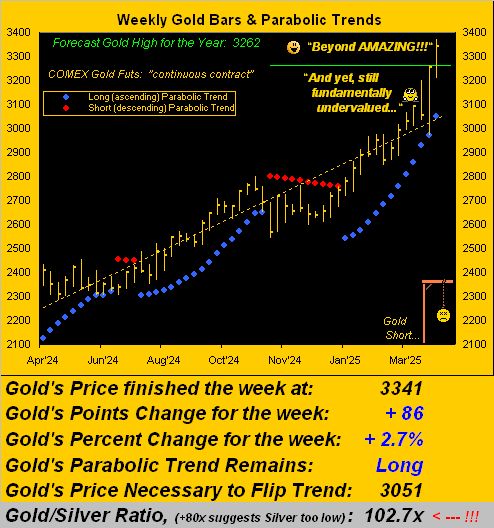
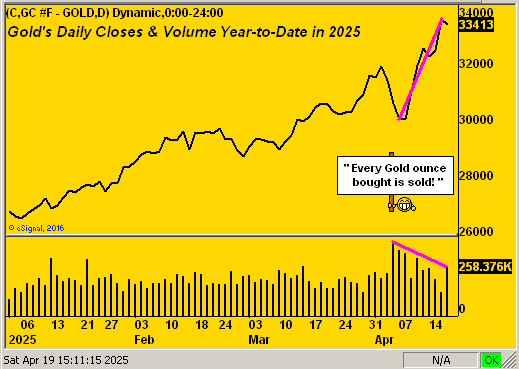
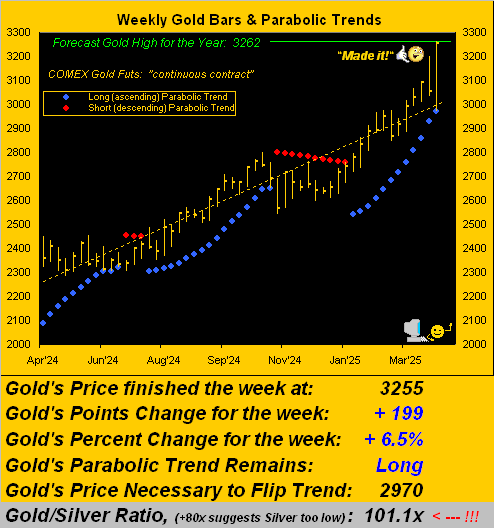
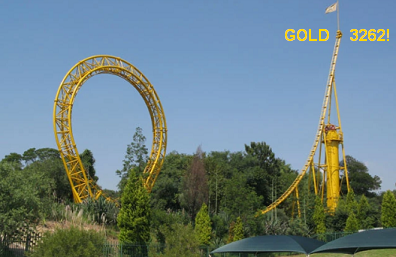
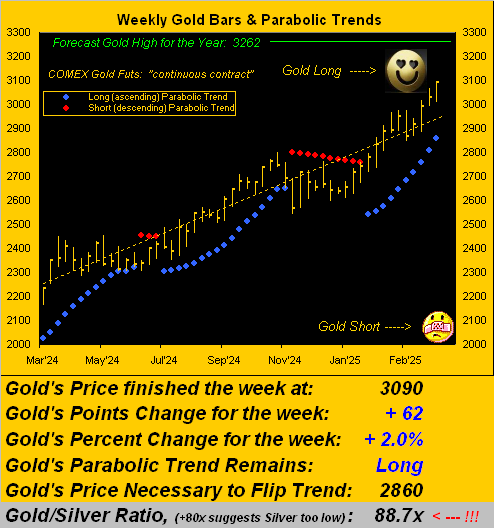
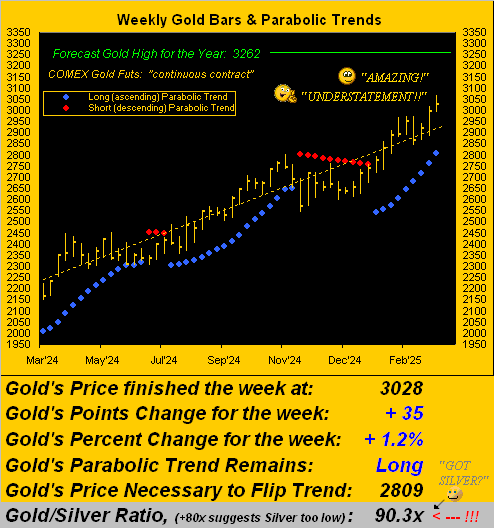
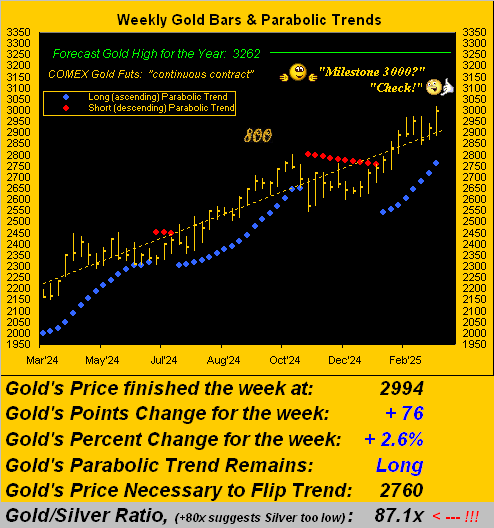
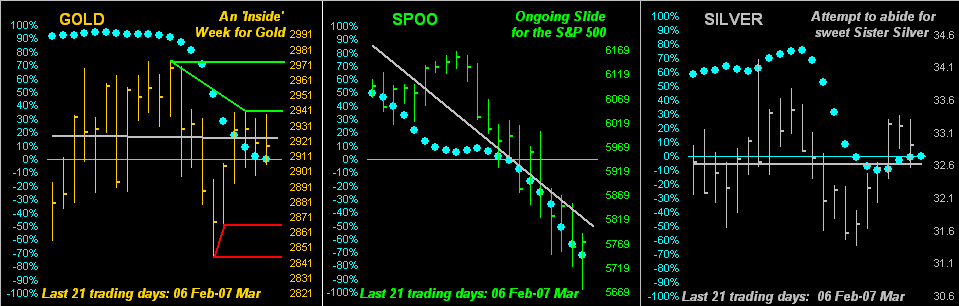
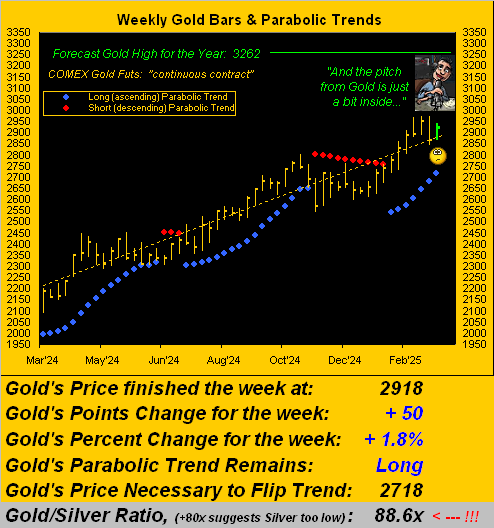
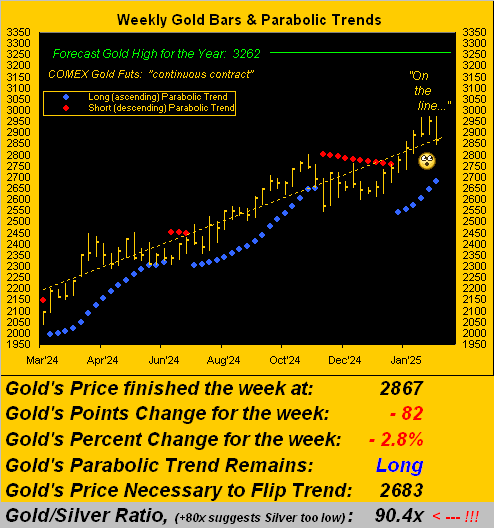
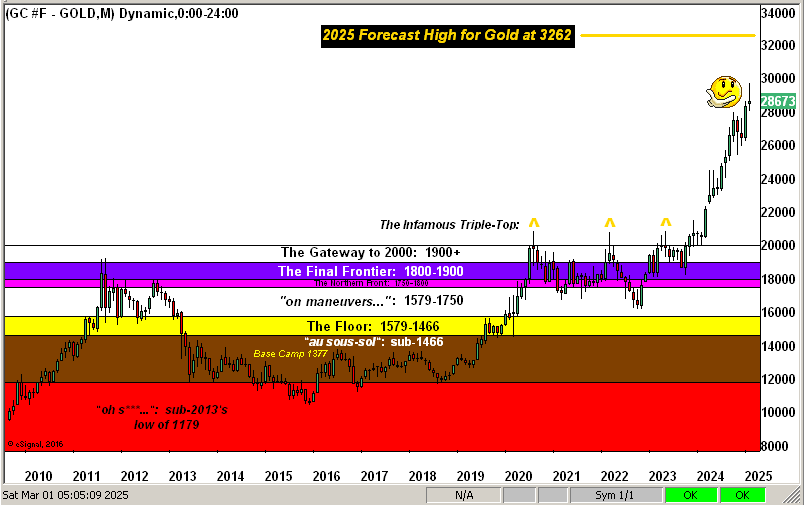
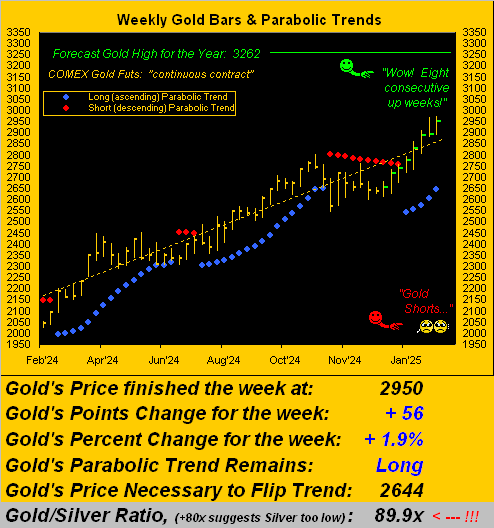
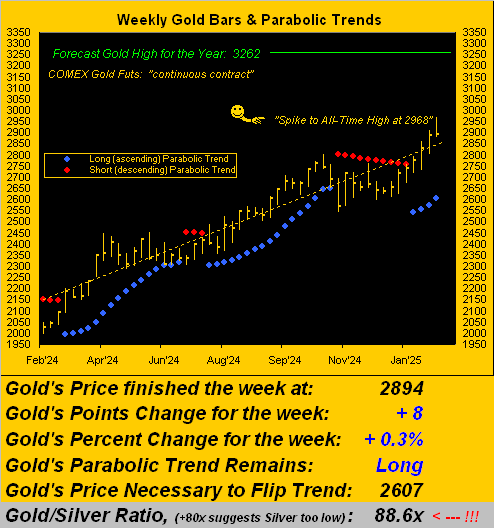
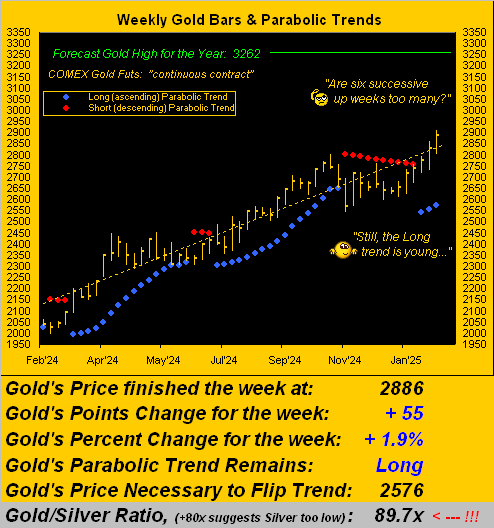
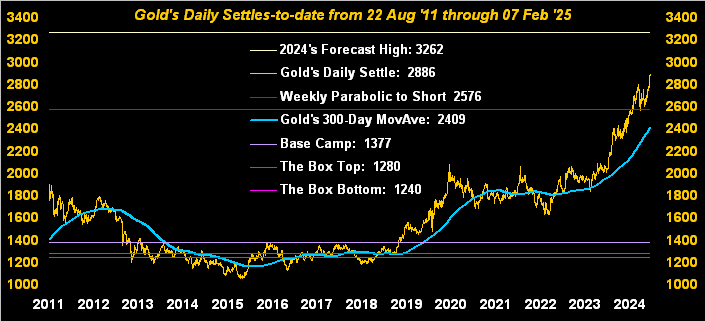
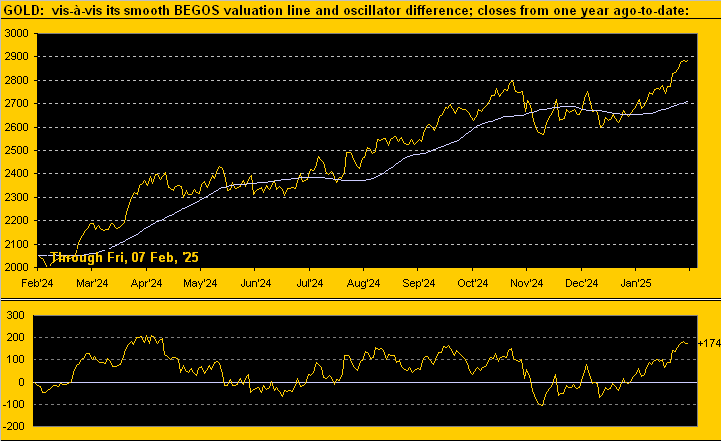
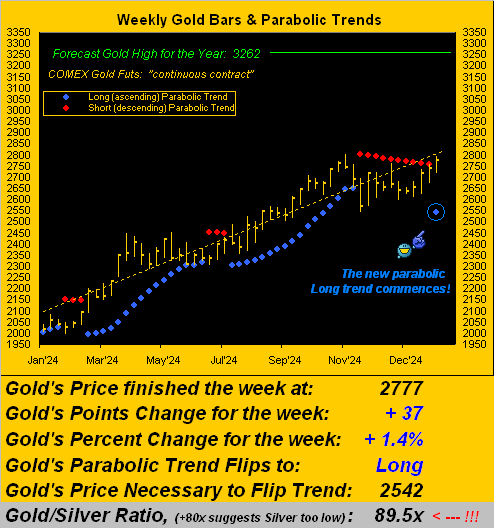
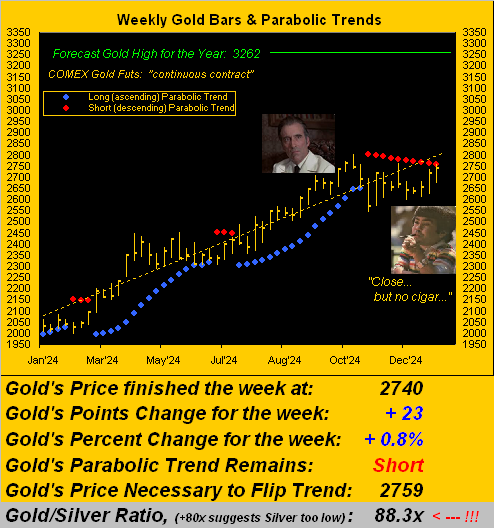
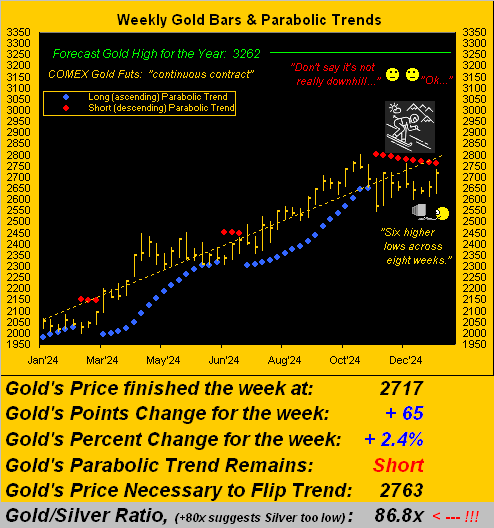
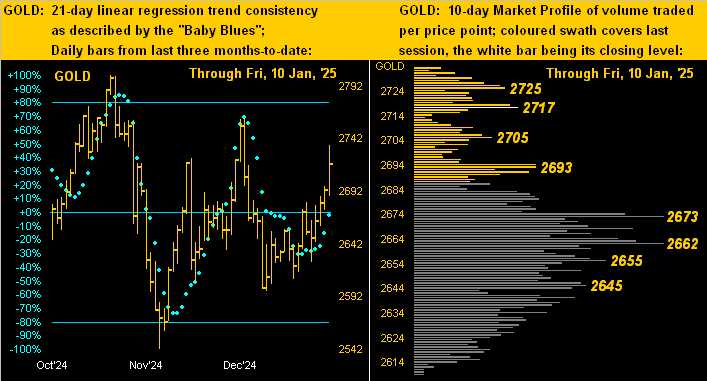
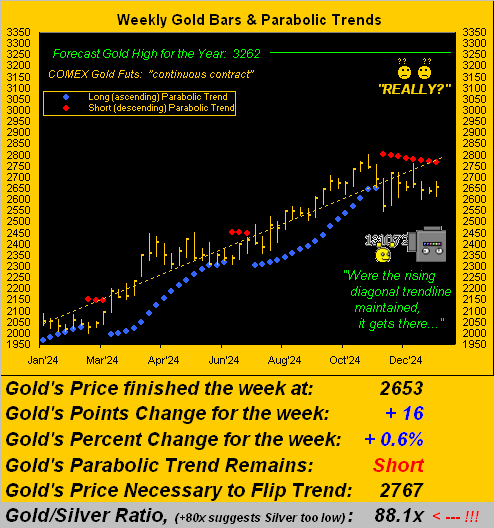
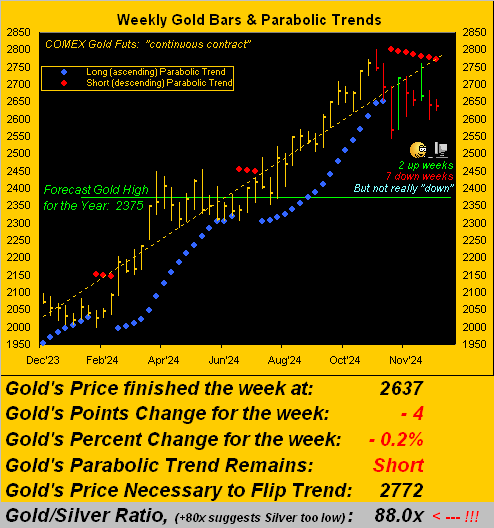
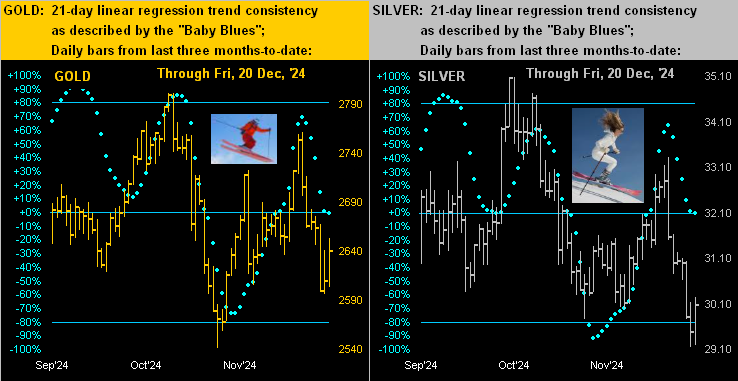
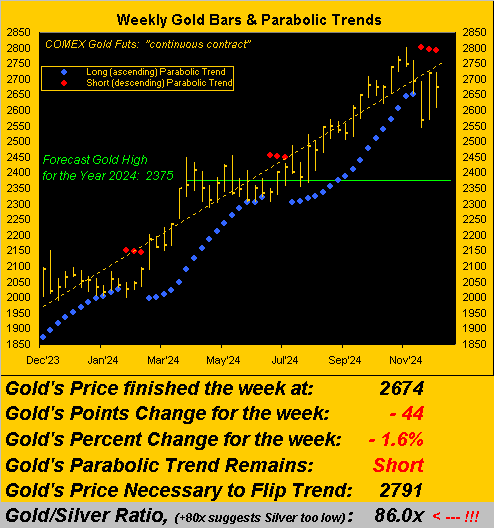
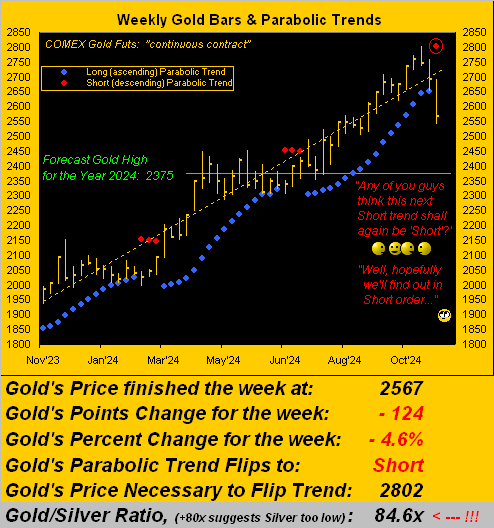
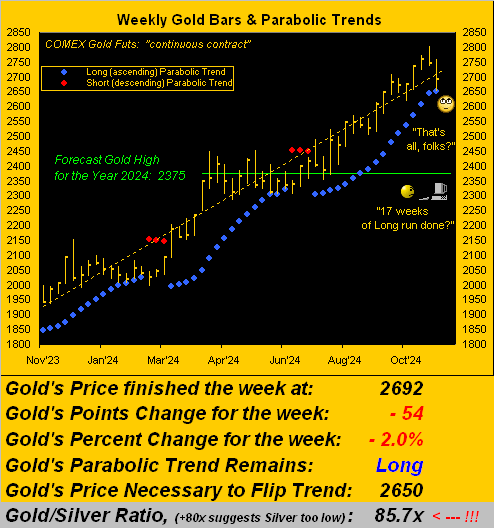
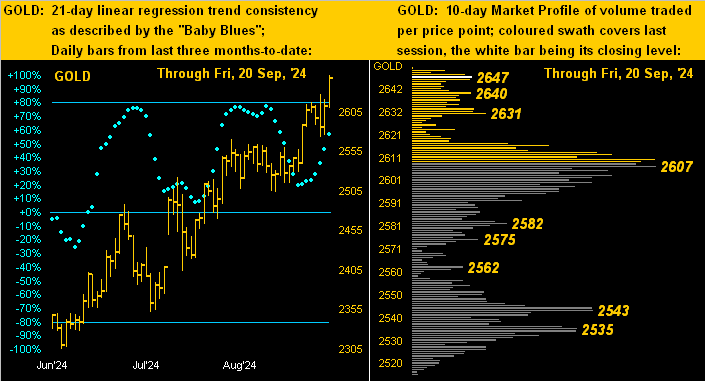
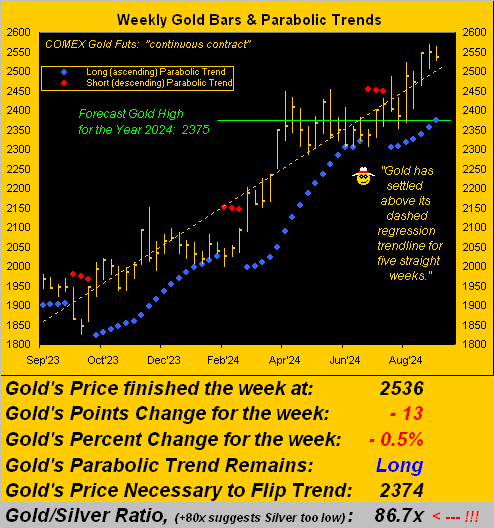
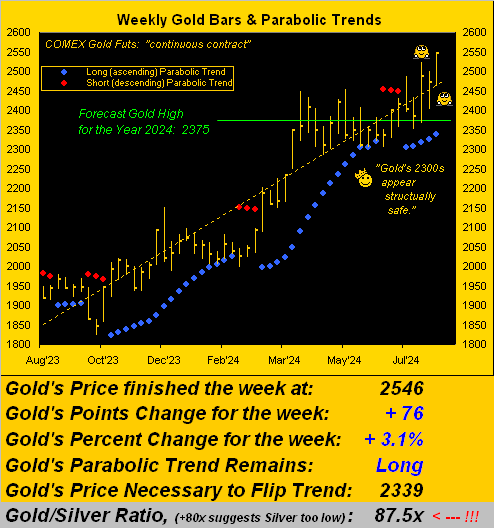
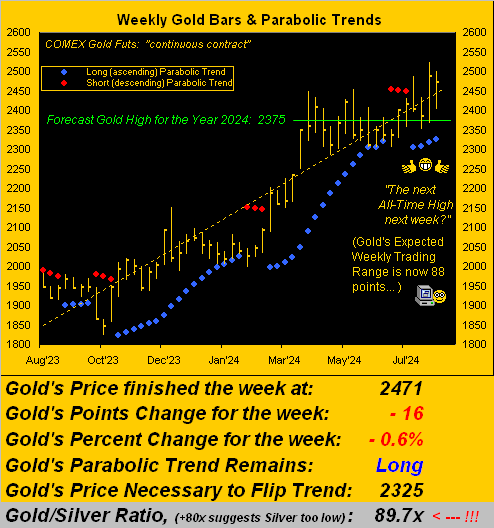
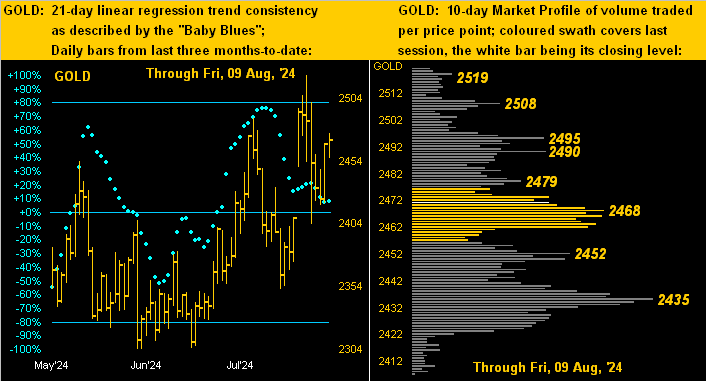
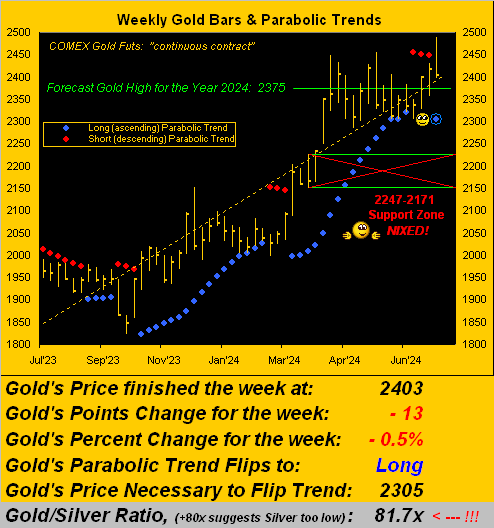
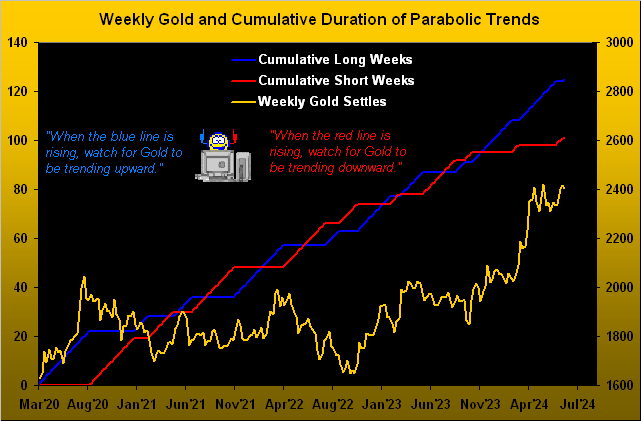
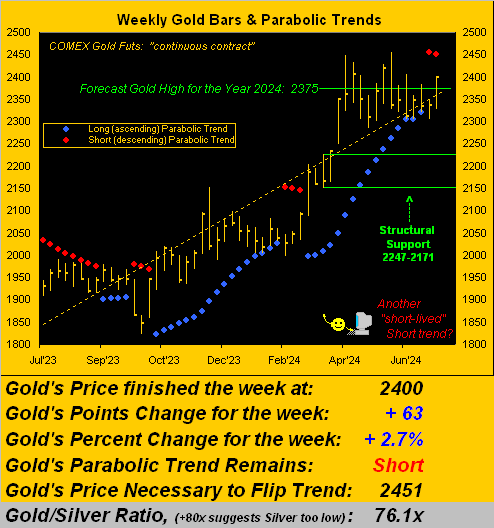
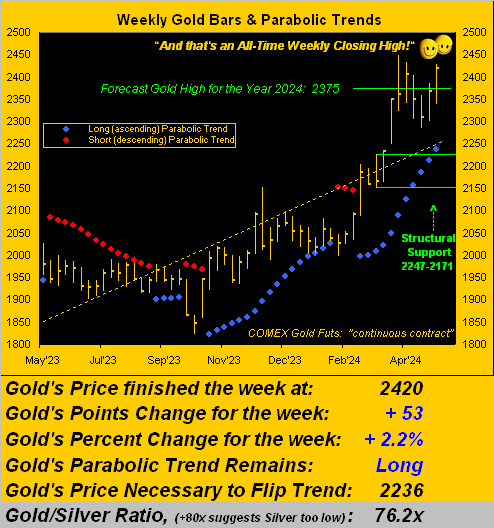
Now obviously we don’t expect Gold to go straight up; however we do see the low coming before the high. Recall from recent missives that Gold is currently in a weekly parabolic Short trend, which — given other negative technicals — we’ve mused price perhaps tapping the upper 2400s near-term. And applying the “expected yearly trading range” method, the year’s low approximates that area at 2507. Then would follow the ascent to its forecast high of …  … 3262. ‘Tis thus basically a +30% run from low-to-high as 2025 unfolds. For now, Gold yesterday (Friday) through the first two trading days of the year settled at 2653. Achieving our 3262 level may seem a very long row to hoe, but with 250 trading days remaining in 2025, there’s time.
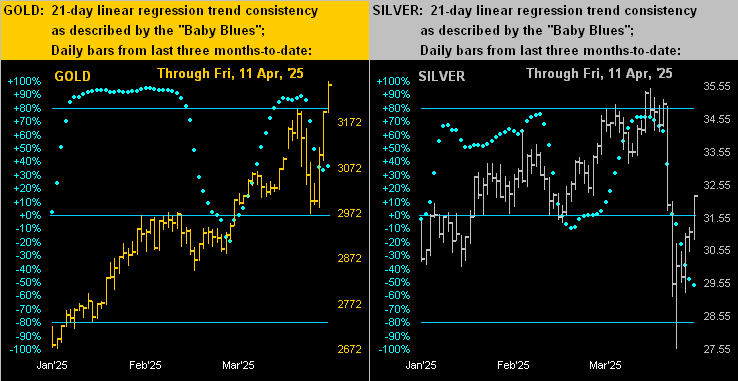
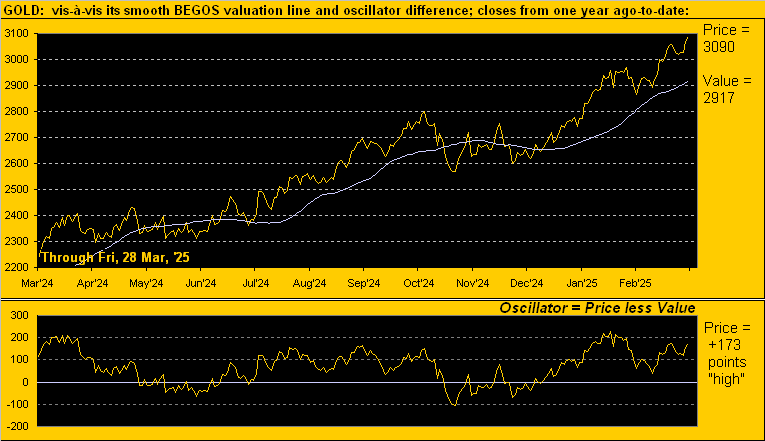
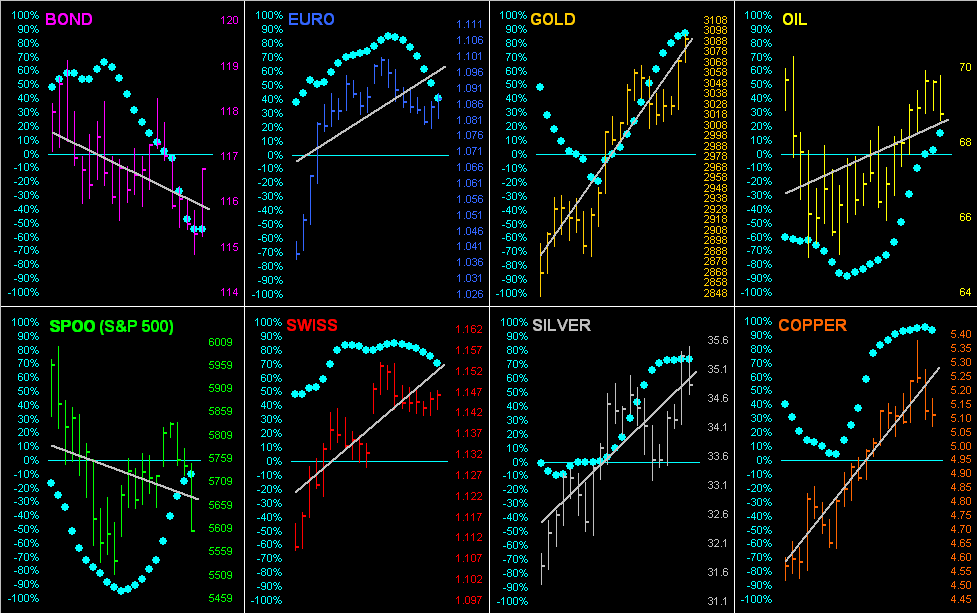
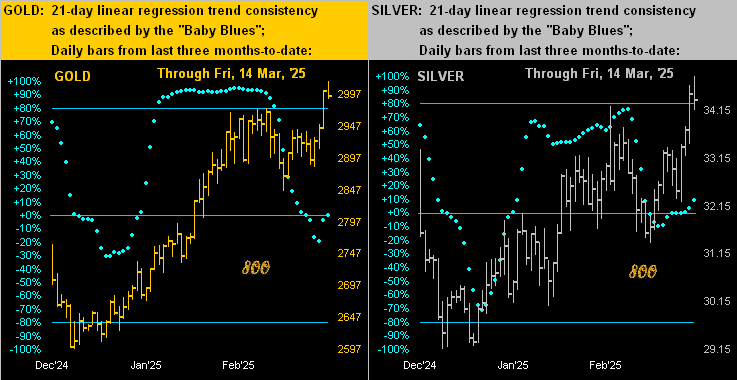
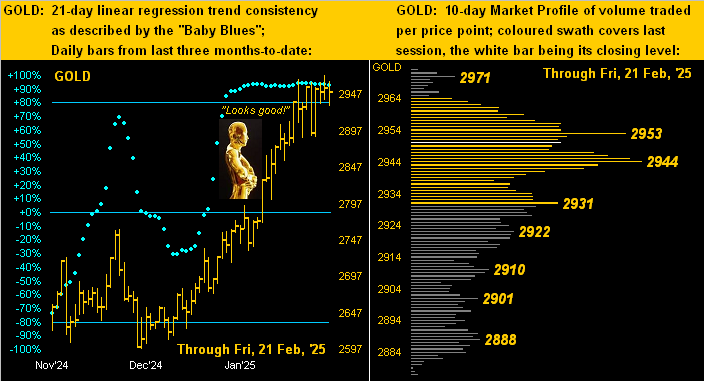
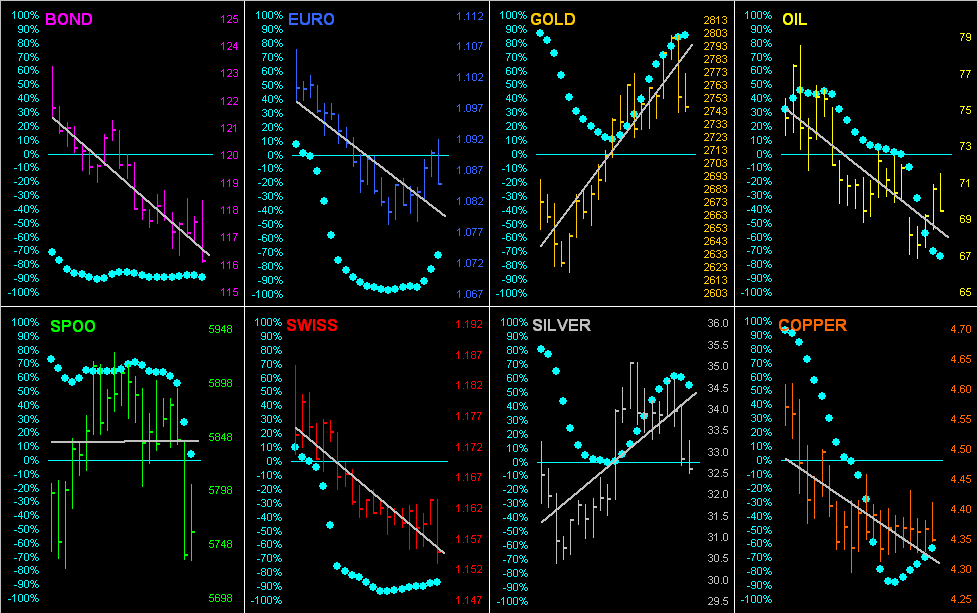
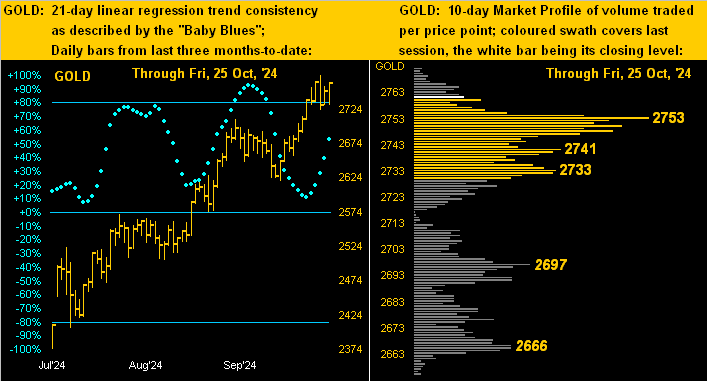
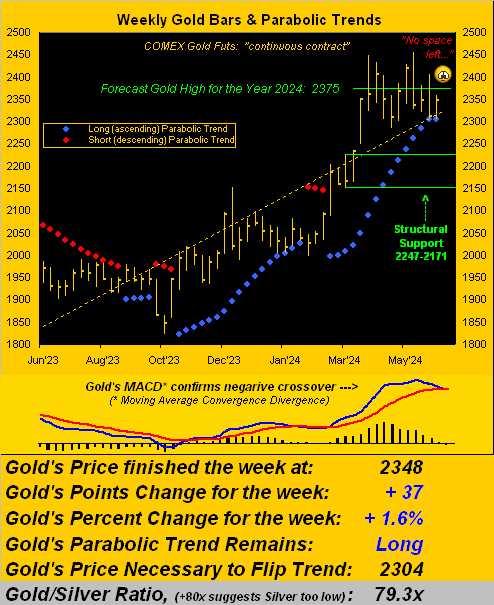
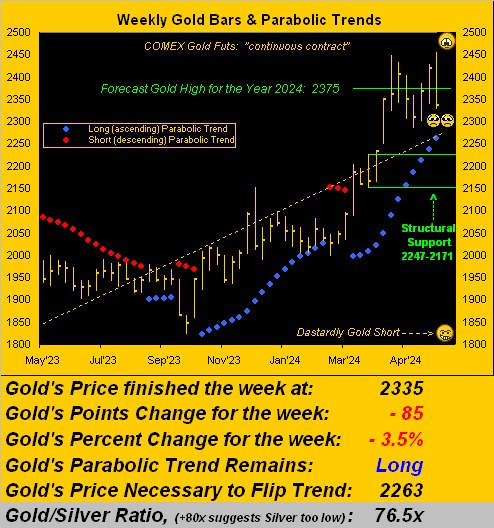
In the meantime, let’s go to Gold’s aforementioned weekly parabolic Short trend, the rightmost red dots now eight weeks in duration. Yet at present, the positively sloping dashed trendline is on pace to reach 3262 within the year, albeit obviously such trend can rotate to negative: