On the off chance you somehow missed this past Monday’s early morning tweet (@deMeadvillePro) with Gold then wallowing about in the 1920s, here ’tis:
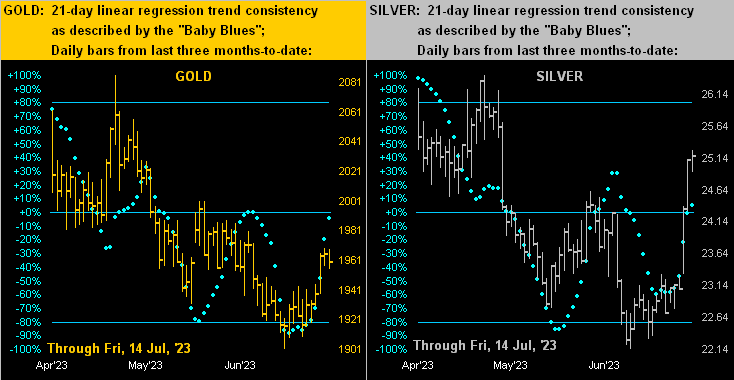
“Gold’s ‘Baby Blues’ have confirmed moving above their -80% axis, indicative of higher price levels near-term; a run to the overhead 1980-2020 support structure would not be untoward; still, the broader weekly parabolic trend remains Short”
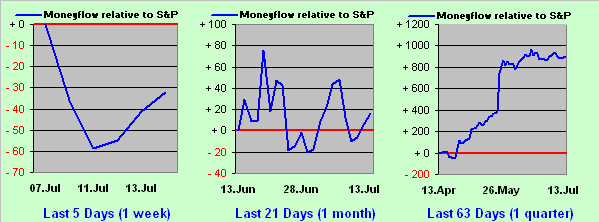
Thus for the nonillionth time, we repeat: “Follow the Blues…” Here’s the animated picture by the day from one week ago through yesterday (Friday) as Gold went on the ascent:
Indeed for this past week, Gold’s low-to-high gain of +50.5 points was on a percentage basis its best (+2.633%) in over three months (since the week ending 06 April) toward settling yesterday (Friday) at 1959, the high en route being 1969.
Enthused by it all, as email-queried a most-valued charter reader of The Gold Update: “When is Blast-off Time?” We responded in part as follows:
We below see such remains the case through now eight weeks of descending parabolic red dots, the prescient wee green support line nonetheless still marking the precise recent low, (should it not later let go):
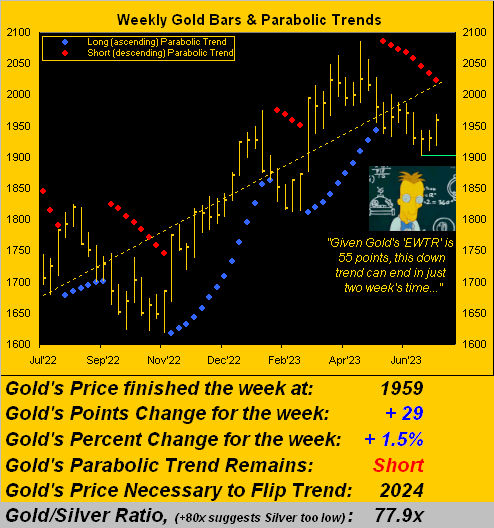
And what the professor therein is going on about per Gold’s EWTR (“expected weekly trading range”) being 55 points — the distance from present price (1959) to the parabolic “flip trend” price (2024) being but +64 points — is that Gold appears well within range of reaching up there in a couple of weeks, (save for the cruelly conniving COMEX crushers coming first to the fore to beat price down more, as is their ardour).
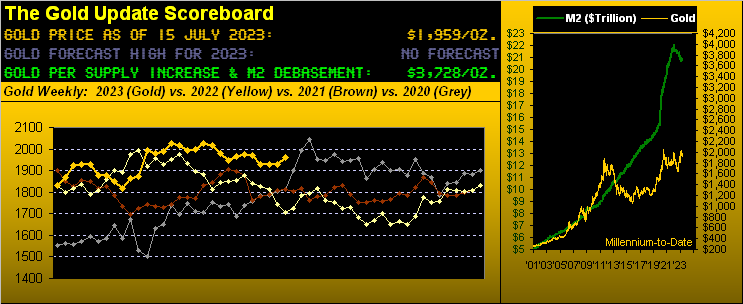
Either way, ’tis good to see Gold getting a bid as “’tis said” inflation is shutting its lid, the Dollar Index in turn having just traded to as low as 99.260, a level not seen since 05 April 2022.
‘Course, you know, and we know, and everyone from Bangor Maine to Honolulu and right ’round the world knows: the StateSide June inflation reports this past week for both the retail and wholesale levels are not those at which the Federal Open Market Committee preferably view; rather ’tis Core Personal Consumption Expenditures pricing, which for June shan’t be reported until 28 July, two days after the FOMC’s next Policy Statement of 26 July. And you’ll recall, the annualized May Core PCE reading was nearly double that ultimately sought (+2%) by the Fed, which of course on 14 June “paused” … but prematurely?
Or as put forth this past week in a headlining opinion piece by one Peter Morici to Dow Jones Newswires: “Fed fumble on inflation has left the U.S. economy vulnerable to stagflation.” No argument here. Further as SanFran FedPrez Mary Daly just said: “It’s really too early to declare victory on inflation”. In tow, perhaps long-time Fedder (34 years!) James “Bullish” Bullard is stepping down in St. Louis at just the right time to become the Dean of the Boilermakers’ Business School.
Then from the “Fun With Numbers Dept.” came another DJNw piece offering “Measure It Differently, and Inflation Is Behind Us … Gauge U.S. price changes the way Europe does, and inflation was already just below 3% in May.” Right. That plus a subway token won’t get you anywhere.
But wait, there’s more. ‘Twas also reported this past week that the larger StateSide banks face growing loan losses, for which Fed ViceChair of Supervision Mike Barr says more capital shall be required. From where does that come, hmmm?
Or how’s this for an inflation gauge: when we took up skiing back in ’64 at the eternally-charming Sugar Bowl, a child’s all-day lift ticket cost $2. As of last season, ’tis $96 for your kid, a 58-year increase of +4,700%. Inflation indeed.
Meanwhile, incoming metrics to the Economic Barometer have lost all sense of direction, the blue line now tracking as a yo-yo whilst yo-yo’s flock to stocks. Did you see where the “live” price/earnings ratio for the S&P 500 settled yesterday? 58.2x. And the Index itself recorded its 29th consecutive day of being “textbook overbought”. The good news however for the S&P is that math illiterates still parrot the P/E as being “twenty-something”. Remember that hit by Chicago from back in ’77 ![]() “Baby, what a big surprise”
“Baby, what a big surprise”![]() ? Oops… Here’s the Baro:
? Oops… Here’s the Baro:
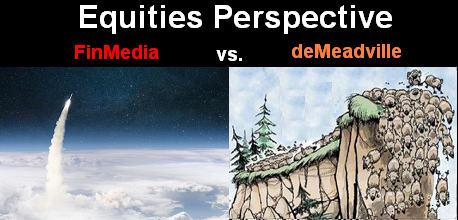
And now for the teased wrap. Since dear old Dad taught us how to read the newspaper stock tables (back during that same year in which we learned to ski), never to this day have we seen our FinMedia colleagues so “All-In!” on the stock market. The left-hand panel in the following graphic (with a tip of the cap to Getty Images’ iStock Photos) was displayed this past Thursday by DJNw. Certainly over the many generations of financial reporting, seasoned investors — from Joe Kennedy and his shoeshine boy to today’s few alert folks who are misvaluation-aware — regard such wreckless abandon as “The Top … That’s it.”
Whether ’tis or ’tisn’t, our view clearly is that of the right-hand panel, if for no other reason than history repeats itself:
And thus: we repeat ourselves as Gold gets some glow but stocks go whacko: “Got Gold?”
Cheers!
…m…
www.TheGoldUpdate.com
www.deMeadville.com
and now on Twitter: @deMeadvillePro