The Gold Update: No.708 (10 June 2023) – Gold Sees Short Squeeze? S&P’s Weak Knees?

The Gold Update by Mark Mead Baillie — 708th Edition — Monte-Carlo — 10 June 2023 (published each Saturday) — www.deMeadville.com

Gold Sees Short Squeeze?  S&P’s Weak Knees?

As you regular readers know, Gold’s weekly parabolic trend confirmed flipping from Long to Short at the close of trading back on 26 May per the August (now front month) contract price of 1963.  Since then, price has barely been lower than 1950 and instead briefly climbed back to 2001.  Now we’ve Gold having settled out the week yesterday (Friday) at 1976.

Thus to this point, ’tis been a wee squeeze of the Shorts, Gold having closed higher these last two consecutive weeks.  Indeed let’s straightaway start with Gold’s weekly bars and parabolic trends from one year ago-to-date.  The green support line just above the 1900 level we still view as a reasonable  guide should Gold resume its slide:

Moreover — to lend to their strain — one of our long-standing tenants is lending to the Shorts’ pain as below we show the “Baby Blues” across the last 21 trading days for Gold on the left and for Silver at center; rounding out the metals triumvirate is Copper on the right.  Those blue dots represent the day-to-day consistency of these metals’ respective grey diagonal trend lines. And the near-term significance of the dots rising across the board here means the present downtrends for both Gold and Sister Silver are losing said consistency, whilst the trend for Cousin Copper (oft considered the metals’ leader) has already rotated to positive.  To reprise the tenant:  “Follow the Blues instead of the news, else lose your shoes.”

Broader views of the “Baby Blues” are of course on the website’s Market Trends page for all eight BEGOS Markets (Bond, Euro/Swiss, Gold/Silver/Copper, Oil, S&P500). And specific to Gold:  whilst the weekly parabolic Short trend as aforeshown is only newly on the go, as herein written a week ago “…wouldn’t it be lovely to have the present Short trend short-lived?…  When first confirmed two weeks ago, we cited (per historically downside follow-through) that the 1850s would not be untoward on this run, even as the noted low 1900s make support sense.  Still, across Gold’s past 10 prior parabolic Short trends extending back into May 2018, the average duration is some 14 weeks, albeit three of which were single digits.  ‘Course with the Fed to add another +0.25% to its FundsRate on Wednesday (14 June), conventional wisdom selling ought then put Gold back on the skids.

And yes, we think such rate raise — and more — are baked into the cake per this graphic herein presented two weeks ago showing the Fed’s favoured inflation indicator:  the Core Personal Consumption Expenditures Price Index.  To refresh your memory, the red line is the Fed’s 2% inflation target to be achieved by effectively strangling the economy via interest rate increases.  Are we there yet?  No:

And per our Barometer of the Economy, is it being strangled yet?  No:

“Well, it is coming down now mmb…”

Squire, to be sure the Econ Baro has weakened a tad since its most recent peak from just nine trading days ago (on 30 May); this past week alone was quite sparse for incoming reports with just six having arrived, notably low-lighted by April’s slowing Factory Orders and a burst in Jobless Claims.  However, next week we’ve 16 metrics due for the Baro, including inflation measures at both the retail and wholesale levels.  And by “consensus” versus prior period, it appears the Baro may further take a bit of a dip, but not by enough to make the Fed quit.

Either way, per the red line (S&P 500) in the above Econ Baro graphic, the stock market clearly doesn’t care a wit. Yet regardless of what conventional wisdom sees, we continue to couch the S&P as standing on weak knees, due overwhelmingly to weak earnings growth, if you please.  The S&P settled the week yesterday at 4299, its highest closing level since last 16 August.  The S&P’s “live” price/earnings ratio back on that day?  38.8x.  Today?  53.3x.  On an implied basis for that stint, (given the “P” of the P/E is the same), S&P earnings on a cap-weighted basis have thus declined -27%; (that shan’t be reported on CNBS, Bloomy, Foxy…).  So we justifiably await the oft-metioned “Look Ma! No Earnings!” crash.

Or if you prefer: as of yesterday’s close, the market capitalization of the S&P is $37.5T … but the U.S. liquid Money Supply (M2 basis) is “just” $20.4T.  Hence there’s perhaps the “Look Ma! No Money!” crash.  To reprise that stated by the sole recipient (J.G.S.) of the first Gold Update nearly 14 years ago:  “Sumpthin’s gonna happen…”   Or as we’ve put more recently:  “Marked-to-market, everybody’s a millionaire; marked-to-reality, everybody’s broke.”

Notwithstanding lack of earnings or money, there’s always the feared “crash” announcement triggered by a prominent investment bank, for example:  “Churnem & Morefees this morning declared a 20% reduction in clients’ exposure to equities.  S&P futures are locked limit-down.” 

Here’s a mitigating thought:  “Got Gold?” 

And yet by the website’s MoneyFlow page for the S&P 500, ’tis into which investors continue to throw dough.  Here’s a visual snippet showing the cumulative MoneyFlow differential (as regressed into S&P points) for the past week, month and quarter.  We don’t have to comb back through our 18 years of daily MoneyFlow data to know the rightmost differential extreme has never before been seen:

But wait, there’s more:  have you been keeping a wary eye on the VIX, (which for you WestPalmBeachers down there is known as “The Fear Index”)?  Its present level of 13.83 indicates “No Fear” for stocks.  As we tweeted earlier in the week (@deMeadvillePro), the VIX has not been at this complacent a level since one month prior to 2020’s COVID crash.  Further:  across the some 34 years of VIX history, its average level-to-date is 20, and one standard deviation below that is 12.  And if you look back across all those years, when the VIX rarely gets down into the 12s, the S&P has a tendency to become rather, shall we say, “unstable” into the ensuing year or two, including with some past “corrections” ranging from -11.4% to -48.5% … just in case you’re scoring at home.

Meanwhile, scoring a bit better than Gold of late is Silver.  From her recent 26 May low of 22.79 (July contract), she’s increased as much as +8.1% to yesterday’s high of 24.62, whereas Gold from its recent 30 May low of 1950 (August contract) managed just a +2.6% increase to the aforementioned 2001 level.  Nonetheless, the Gold/Silver ratio is still historically high at 81.0x vis-à-vis its century-to-date average of 67.5x.  “Got Silver?” We have her 10-day Market Profile here (below right), the relative present level therein better than that for Gold (below left):

So toward this week’s wrap, let’s assess

The Gold Stack
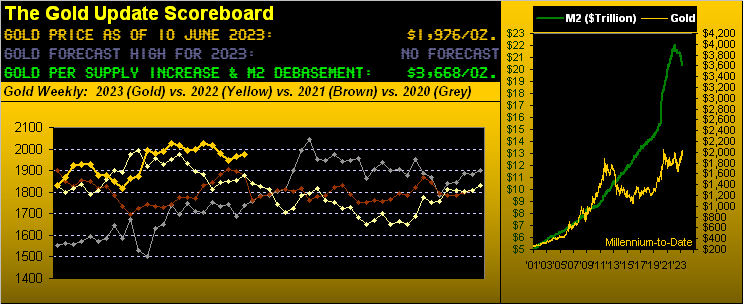
Gold’s Value per Dollar Debasement, (from our opening “Scoreboard”): 3668
Gold’s All-Time Intra-Day High: 2089 (07 August 2020)
2023’s High: 2085 (04 May)
Gold’s All-Time Closing High: 2075 (06 August 2020)
The Weekly Parabolic Price to flip Long: 2073
10-Session directional range: up to 2001 (from 1950) = +51 points or +2.6%
Trading Resistance: 1977 / 1980 / 1991 / 1996
Gold Currently: 1976, (expected daily trading range [“EDTR”]: 26 points)
10-Session “volume-weighted” average price magnet: right here at 1976
Trading Support: 1961
The Gateway to 2000: 1900+
The 300-Day Moving Average: 1841 and rising
2023’s Low: 1811 (28 February)
The Final Frontier: 1800-1900
The Northern Front: 1800-1750
On Maneuvers: 1750-1579
The Floor: 1579-1466
Le Sous-sol: Sub-1466
The Support Shelf: 1454-1434
Base Camp: 1377
The 1360s Double-Top: 1369 in Apr ’18 preceded by 1362 in Sep ’17
Neverland: The Whiny 1290s
The Box: 1280-1240

And indeed to wrap, we couldn’t help but notice this claptrap, courtesy of the UPI, (such as to have former President and Chairman Hugh Baillie likely rolling in his grave):  Ready?  “Heat-trapping carbon dioxide hit record levels in May … not seen in 4 million years” Really?  Moreover, how can it be a record if it already was the case 4 million years ago… Right?  We’d really like some clairification on this if any of you valued readers might ring up one of your australopithecus relatives … you know … to find out at what laboratory in what state or country such measurement was made back then, and so forth.  Just curious.

‘Course, 4 million years ago is peanuts when we consider that Gold (so ’tis said) extends back some 4 billion years when The World was then being pelted by asteroids.  Now that’s real climate change!  In fact:  “Miss Gibbs?  Would you kindly contact Hollywood Studio Rentals and see if we can get H.G. Wells’ time machine for a week or so?”  (She’s a winner).  Oh to linearly regress the value of Gold from then through now and into the future, WOW 

Cheers!

…m…

www.TheGoldUpdate.com
www.deMeadville.com
and now on Twitter:  @deMeadvillePro