The Gold Update: No. 734 – (09 December 2023) – “Gold-Record’s Calamity; Stocks’ Stark Misfortune-to-Be”

The Gold Update by Mark Mead Baillie — 734th Edition — Monte-Carlo — 09 December 2023 (published each Saturday) — www.deMeadville.com

Gold-Record’s Calamity; Stocks’ Stark Misfortune-to-Be

British Prime Minister (1874-1880) Benjamin Disraeli is infamously quoted in reference to the leader of Parliament’s Opposition:  If Gladstone fell into the Thames, that would be a misfortune; and if anybody pulled him out, that, I suppose, would be a calamity.”

And whilst misfortune for the stock market is well overdue to ensue, with respect to Gold, calamity is descriptively apropos following the second consecutive daily record high of 2152 achieved this past Monday (04 December) … following which it all went a bit wobbly, price settling out the week yesterday (Friday) at 2021.

To be sure, a week ago we acknowledged Gold’s “Finally!” having recorded a fresh All-Time High of 2096 on 01 December, a milestone comprehensively missed by the FinMedia.  A watchful reader even wrote to us:  “Nothing in Barron’s or WSJ…”  But then herein penned last week “…new highs in major financial markets tend to draw in the “mo-mo” crowd…” and in turn, Gold on Monday left no doubt in shredding the Shorts all the way up to 2152.  ‘Twas a beautiful thing, albeit then came calamity as highlighted here:

However:  let’s couch calamity in context.  Oh yes, this past Monday’s reversal of -114 points from 2152-to-2038 across just 16 hours ranked as Gold’s fifth-worst same-day high-to-low points plunge century-to-date; but by percentage, such -5.3% intra-day drop ranked only 34th-worst.  Which for you WestPalmBeachers down there means the prior 33 even worse same-day percentage drops all eventually led to All-Time Highs for Gold, (i.e. the trend is your friend given Gold eventually goes all the way back up — and then some — as we just saw.)

Further, Gold’s dominant trends all remain up:  that includes the key 21-day linear regression trend, and as we below see both the year-over-year dashed regression trend along with the rightmost weekly blue-dotted parabolic Long trend, now a healthy eight weeks in duration and accelerating upward:

“But Silver took quite a hit, eh mmb?” 

‘Twas the case, Squire.  Gold’s net fall for the week of -3.4% pales in comparison to Silver’s net -9.9% weekly shellacking, her worst since that ending 14 October 2022.  This in turn blasted the Gold/Silver ratio from 80.8x just a week ago up to now 86.8x.  Fortunately, Sister Silver still has plenty of weekly parabolic Long trend cushion beneath her, present price being 23.29 vs. the flip-to-Short level now 21.07.

Speaking of taking a hit, you regular readers and website followers have witnessed that taken of late by the Economic Barometer.  So much so that the now-defunct Funkin’ Waggnalls might have defined “straight down” as “The Econ Baro”.

But the Baro did get a bit of a boost on Friday from better payrolls data for November:  net job creation beat both “expectations” as well as the October increase; the pace of Hourly Earnings doubled from +0.2% to +0.4%; the Average Workweek grew; and the Unemployment Rate fell by -0.2% from 3.9% to 3.7%.  

Now a month-over-month drop of -0.2% in Unemployment may not seem like much, but ’twas the second-best monthly improvement since the April 2022 reading.  ‘Course the ADP Employment data actually worsened for November, (but Labor’s data survey is better, depending upon “who’s in office”, right?).  Then how about that University of Michigan “Go Blue!” Sentiment Survey:  from November’s 61.3 to 69.4 for December!  And The Wolverines are ranked Number One in StateSide collegiate football!  How great a picture is this?  (Well, maybe not…).  We’ll see what the Federal Reserve’s Open Market Committee has to say next Wednesday (13 December):

Thus we’ve covered calamity following Gold’s record high — and to an ongoing extent — same for the above Econ Baro.  But what about (as entitled) misfortune-to-be for the stock market?  After all the FinMedia appears all-in for an S&P 500 record high (above 4819 vs. the current 4608 level).  To wit, Dow Jones Newswires just reported “The VIX says stocks are ‘reliably in a bull market’ heading into 2024…”  So clearly no one has done the math as to the stock market’s usual demise when the VIX is this low (12.35 at Friday’s settle).  And yet by the website’s S&P 500 menu, we’ve still yet to see any true “fear” in the MoneyFlow, even as we tweeted so (@deMeadvillePro) this past Tuesday.

Further, we’ve herein on occasion enumerated a number of factors continuing to be present for it all to go wrong for stocks, notably the ongoing lack of earnings support.  Yet as a long-time reader wrote in this past week:  “It hasn’t been about EPS for a long time. It’s all about stock price.”   And we comprehensively agree.  That is because “It’s different this time” … just as ’tis always been different prior to every one of the stock market’s true crashes; (e.g. in our lifetime:  27 August 1987, 24 March 2000, 11 October 2007, and 19 February 2020, not to mention the myriad of other double-digit “corrections” therein).  Imagine the 38 roulette slots (or 37 here in Europe) having their numbers replaced with S&P 500 constituent symbols.  “Half on NVDA and half on AMZN!”  … “Le jeux sont FAIT, Monsieur, rien ne va PLUS!”  That’s where we are today.

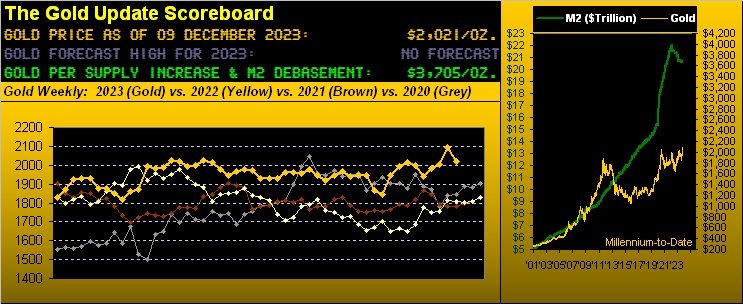
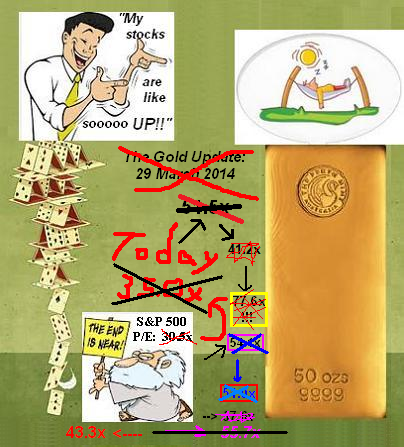
Not to belabour the point, but we have a question.  What are companies such as Advanced Micro Devices (AMD, p/e 1,003.3x), Ceridian HCM (CDAY, p/e 2,593.4x), Ventas (VTR, p/e 3,593.8x) et alia even doing in the S&P 500?  How about the Index’s 34 constituents not even making money?  Reprise the late, great Vince Lombardi:  “What the hell’s goin’ on out there?!?!?” (Friendly reminder:  US liquid Money Supply [“M2”] now $20.7T; S&P 500 market capitalization now $40.2T; have a nice day).

Stark misfortune-to-be, indeed.  By any historical yardstick, the is S&P is so significantly overstretched ’tis stunning that it hasn’t yet steeply succumbed.  But until it does — and ’twill — as is our wont to say, the Investing Age of Stoopid merrily rolls on its way.

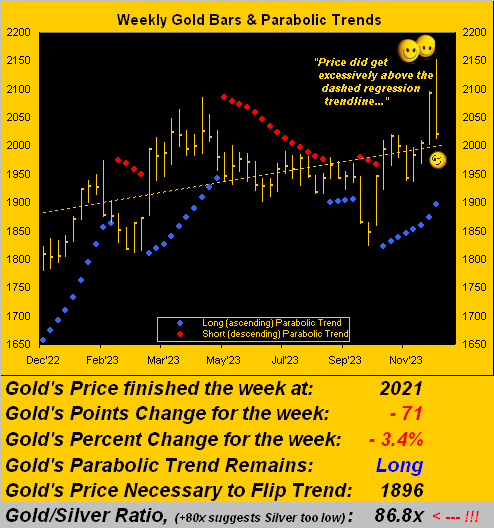
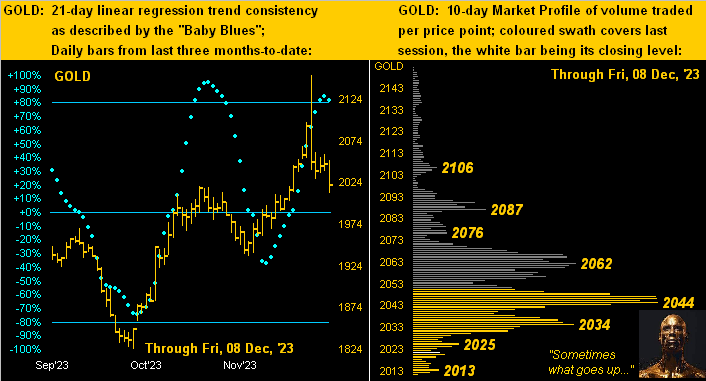
Meanwhile not so merrily rolling downward this past week were the precious metals.  First to Gold’s two-panel graphic of the daily bars from three months ago-to-date on the left and 10-day Market Profile on the right.  Earlier we mentioned Gold’s key 21-day linear regression trend as being up, which ’tis; however, its baby blue dots of trend “consistency” are just now kinking over to the downside, suggestive of still lower prices near term.  Yet by pricing structure, we don’t see too much further damage beyond the present 2021 level down to 1975.  But by the Profile for now, the mid-2040s clearly show as trading volume resistance:

Similar is Silver’s two-panel slate.  Her “Baby Blues” (at left) already have departed below their key +80% axis; price presently as noted at 23.29, her safety support structure ranges from 23.88 down to 21.93.  ‘Course by her Profile (at right), Sister Silver hardly is the happiest camper:

We’ll close it here with another FinMedia bemusement.  The once-mighty now ratings-floundering CNN ran on Gold’s record-high Monday with:  Gold has never been this expensive.”  With all due respect to the network’s writers and editorial staff, Gold remains extraordinarily cheap“Expensive” was back in 2011 when Gold’s price growth was outpacing U.S. Dollar debasement, (recall our then writing about “Gold having gotten ahead of itself”).  But for the chump news-droolers out there, the price of Gold last Monday reached its highest level ever at 2152 … yet valued today at 3705, Gold is cheap!  What’s inanely “expensive” (understatement) is the stock market.  And thus we wrap with this favourite graphic:

Stay with your Gold!

Cheers!

 …m…

www.TheGoldUpdate.com
www.deMeadville.com
and now on Twitter(“X”):  @deMeadvillePro