The Gold Update: No. 722 – (16 September 2023) – “Gold – Fundamentally Fabulous, Technically Torturous”

The Gold Update by Mark Mead Baillie — 722nd Edition — Monte-Carlo — 16 September 2023 (published each Saturday) — www.deMeadville.com

Gold – Fundamentally Fabulous, Technically Torturous

Firstly:  Gold is fundamentally fabulous given its ultimate valuation is a function of currency debasement.  Hardly is that news to our veteran readership, nor to anyone who fully comprehends The Gold Story.  So let’s just briefly break down the ultimate effect of valuation on Gold with three bullets:

  • Gold settled this past week yesterday (Friday) at 1946; per the opening Gold Scoreboard, valuation is 3706; Gold is thus presently priced at but 53% of its valuation;
  • Gold’s highest level of valuation-to-date is 4031 (per the week ending 15 April ’22), with price concurrently at 1977; obviously since then, the Federal Reserve has been “rebasing” the money supply (“M2” from $22.1T to now $20.7T, or -6.3%);
  • Gold’s price — whilst typically lagging valuation — eventually ascends to past high valuation levels; Price’s All-Time High of 2089 (on 07 August 2020) matched the valuation high of 2089 achieved eight years earlier (as of 24 July 2012).

Thus ’tis fundamentally fabulous to know there is so much higher for Gold — dare we say “automatically” — to go.  Precisely put, Gold’s price today so relatively inexpensive, ’tis akin to Roger Moore opting for “player’s privilege” in rolling Louis Jourdan’s lucky backgammon dice:  “It’s all in the wrist … double sixes … fancy that.”  –[Octopussy, Eon-MGM/UA, ’83]

“Yet if I can play devil’s advocate, mmb, Gold is just not popular anymore…

Your Yet is the operative word there, Squire:  merely move it to the end of your sentence in replacing the word “anymore“.  Moreover as recently penned, Gold’s popularity amongst the so-call “sovereigns” remains substantive.  When including Gold as a currency (albeit this data is six years in arrears per the World Gold Council), it reportedly makes up better than 50% of foreign reserves belonging to Austria, France, Germany, Greece, Italy, The Netherlands, Portugal, The United States, and (again per six years ago) Venezuela.

But as the Investing Age of Stoopid rolls along, “The Herd” don’t want yield-less Gold.  Rather, their preference is to be all-in with equities, even if earnings-less.  “No, we gotta own Nvidia ya know [p/e 105x] “No, we gotta own Amazon ya know [p/e 110x] “No, we gotta own Salesforce ya know [p/e 133x]…”  That’s just a few of the 25 S&P 500 constituents with price/earnings ratios currently in excess of 100x.  As for the total market capitalization of the S&P now priced at 4450?  $38.9T.  The aforementioned liquid money supply (“M2”) of the US?  $20.7T.  Sleeping well?  Got Gold?  Admittedly that said…

Secondly:  Gold is Technically Torturous given its performance since the weekly parabolic trend flipped from Short to Long two weeks ago.  “Long” means “Up”, not “Down”.  But the latter has been Gold’s state from settling at 1966 since starting September, from which price has been as low as 1922 (-2.2%).  Worse for Silver after settling 01 September at 24.55, she has since succumbed to as low as 22.56 (-8.1%).  Torturous indeed!  That stated, both precious metals are still clinging (precariously) to their respective weekly parabolic Long trends as we see here from one year ago-to-date:

At least by each rightmost respective bar, Gold and Silver got bids into week’s end to close well off those noted lows.  And to stick with this technical treatise — torturous as ’tis — we’ve a near-term Gold study that bodes well for higher prices.  In reviewing the week’s ending data runs, from the website’s Market Rhythms page up popped a pending positive crossover for Gold’s 12-hour MACD (“moving average convergence divergence” … which for you WestPalmBeachers down there is a very popular market-following study).  Here’s the graphic of Gold from mid-year-to-date in 12-hour units with the MACD’s blue line poised to cross above its red line, visibly-viewed by the trading community as indicative of higher price levels in the offing:

‘Course, has this signal been performing well?  In order to qualify for our Market Rhythms page, various criteria must be met.  And specific to Gold’s 12-hour MACD:  across the past ten signals (since 03 May — Gold then 2082 — in perpetually swinging from Long-to-Short-to-Long-etc.) has been complied a pure-swing bi-directional gain of 159 points with an “average maximum” gain per swing of 48 points.  Just in case you’re scoring at home.  The point is:  should this next up swing confirm, we’d expect it to help Gold get back on its broader parabolic up track.

Speaking of “up track”, have you been following that of the StateSide Economic Barometer?  Nothing recessionary there:

Highlighting the past week’s streak of 15 incoming Econ Baro metrics was August’s Capacity Utilization, the 79.7% reading ranking as second highest across the past 10 months, whilst Retail Sales increased their growth to +0.6% from July’s +0.5% pace.  Too, September’s New York State Empire Index — which was largely negative throughout 2022 into 2023 — posted its fourth positive reading of the past six months.

Therein, the bogeyman of the bunch was ramped-up inflation which falsely feeds into economic “growth”.  At both the retail and wholesale levels, August headline inflation (which acknowledges that you eat and drive) more than doubled their July paces.  But is Mr. Bogey frightening Wall Street’s children?  Going by our Moneyflow page, we’ve yet to see “fear” in the S&P 500, (note again that adverb’s emphasis).  But with our “live” p/e of the S&P at an honestly-calculated 39.6x, “tick, tick, tick goes the clock, clock, clock…”

And to be sure, the rising price of Oil is nurturing numbers higher as it inflates its way through the economic system.  Here we’ve the percentage tracks of the five primary BEGOS Markets (Bond / Euro / Gold / Oil / S&P) across the past 21 trading days (one month).  “Somebody stop that Oil!”:

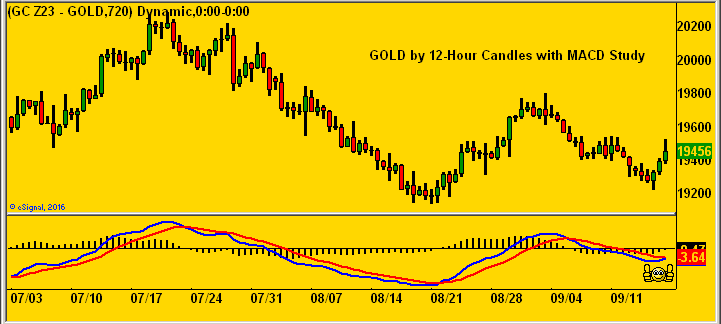
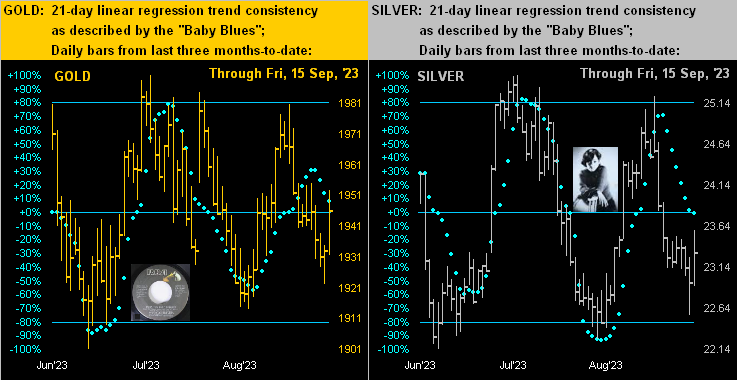
As for the precious metals from three months ago-to-date, here next we’ve their daily bars along with those “Baby Blues” that depict the consistency of the evolving 21-day linear regression trend.  For both Gold on the left and Silver on the right, the baby blue dots are falling, which does not lend well to price’s firming and turning higher.  Still, the rightmost bar in each case is indicative of buying interest, which beneath the umbrella of the weekly parabolic Long trend — plus the aforeshown pending MACD positive cross — can combine to  “Turn the beat around…”  –[Vicki Sue Robinson, ’76]:

To the 10-day Market Profiles we go for Gold (below left) and for Silver (below right).  Their both having departed basement residency from the past two weeks enhances the (hopefully) supportive aspects for the yellow metal’s 1932-1952 zone and the white metal’s denoted 23.40 level:

Time to wrap with the stack:

The Gold Stack
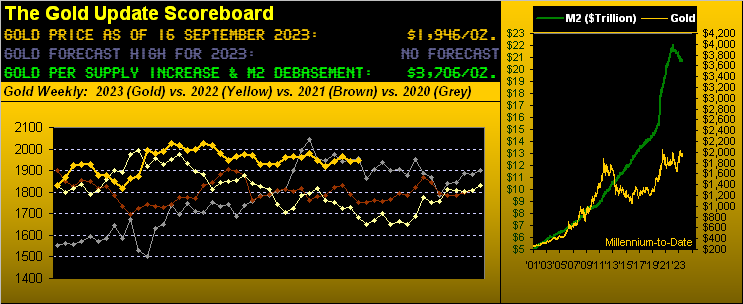
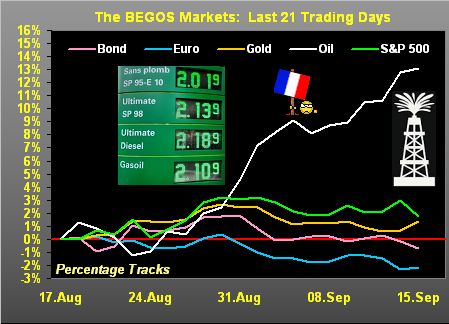
Gold’s Value per Dollar Debasement, (from our opening “Scoreboard”): 3706
Gold’s All-Time Intra-Day High: 2089 (07 August 2020)
2023’s High: 2085 (04 May)
Gold’s All-Time Closing High: 2075 (06 August 2020)
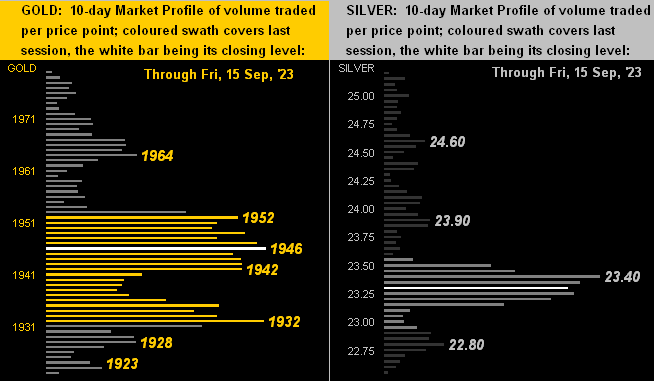
Trading Resistance: 1952 / 1964
Gold Currently: 1946, (expected daily trading range [“EDTR”]: 16 points)
10-Session “volume-weighted” average price magnet: here at 1946
Trading Support: here at 1946, then 1942 / 1932
10-Session directional range: down to 1922 (from 1980) = -58 points or -2.9%
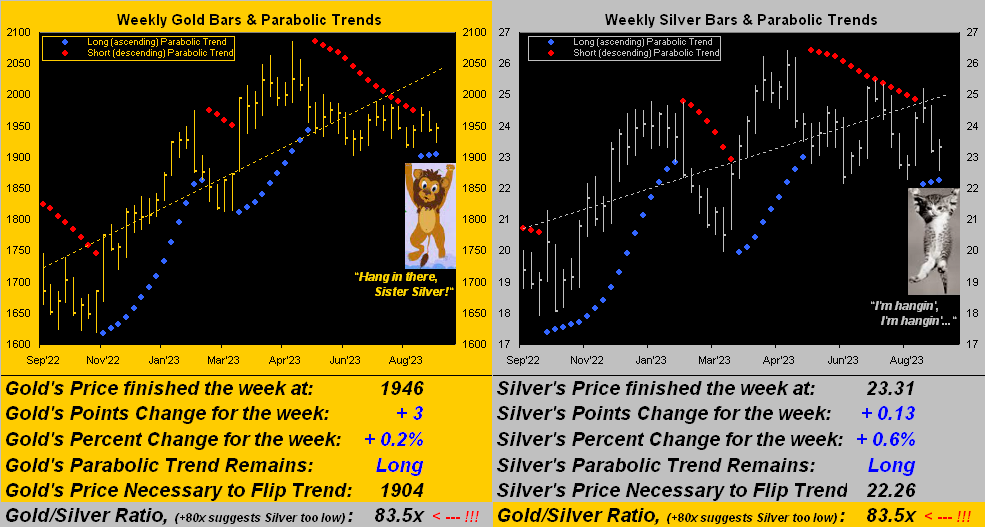
The Weekly Parabolic Price to flip Short: 1904
The Gateway to 2000: 1900+
The 300-Day Moving Average: 1859 and rising
2023’s Low: 1811 (28 February)
The Final Frontier: 1800-1900
The Northern Front: 1800-1750
On Maneuvers: 1750-1579
The Floor: 1579-1466
Le Sous-sol: Sub-1466
The Support Shelf: 1454-1434
Base Camp: 1377
The 1360s Double-Top: 1369 in Apr ’18 preceded by 1362 in Sep ’17
Neverland: The Whiny 1290s
The Box: 1280-1240

If all this weren’t exciting enough, wait:  there’s more!  Wednesday (20 September) brings the next Policy Statement from the Federal Open Market Committee.  Sense across the spectrum has been the Fed shall “pause” as it recently did two Statements ago (14 June) before again raising last time ’round (26 July), as just did the European Central Bank.  So with August inflation having notably picked up the pace, this time appears more of a “Crapshoot” –[Moriarty, ’16], albeit we think the Fed shall make the raise.  Alors, on verra mes chers amis!  In the meantime, survive the torture toward achieving the fabulous:  stay with Gold and Silver if you please!


Cheers!

…m…

www.TheGoldUpdate.com
www.deMeadville.com
and now on Twitter(“X”):  @deMeadvillePro