On the heels of last week’s piece “Gold – Fundamentally Fabulous, Technically Torturous“, we’ve given consideration to some infamous tortures foisted upon mankind across the centuries. And how well-documented they are! The exasperating drips of the Chinese Water Torture… the exhausting torture of Sleep Deprivation… and (“Don’t say it!”) yet we must –> the excruciating endlessness of the Tickle Torture, (just to name a few).
But wait, there’s more! Today ’tis the ever-exponential agony of the GPTT: Gold Price Tease Torture! “Oh please mother make it stop!” –[Linda Blair, ‘The Exorcist’, Warner Bros., ’73]
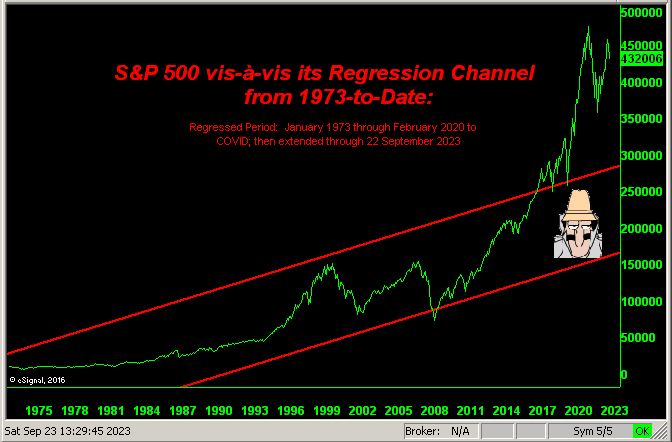
“Well, mmb, there’s also your ‘live’ p/e of the S&P still unsupportably high in the sky as everybody waits — in your own words — ‘for it to all go wrong’; that’s kinda torture too…”
So ’tis, Squire. That price/earnings ratio now at 37.7x keeps clear-cut the case for a comprehensive S&P “correction”. However, there’s a significant difference between the S&P 500 and Gold: whereas the former is fully-engaged, the latter lingers unengaged. Folks follow stocks; few follow Gold. Going by Gallup as of this year, 61% of adult Americans own equities; going by “Gold IRA Guide” as of 2020, just 11% of adult Americans owned Gold. And globally, Gold’s ownership has been cited as less than 1%.
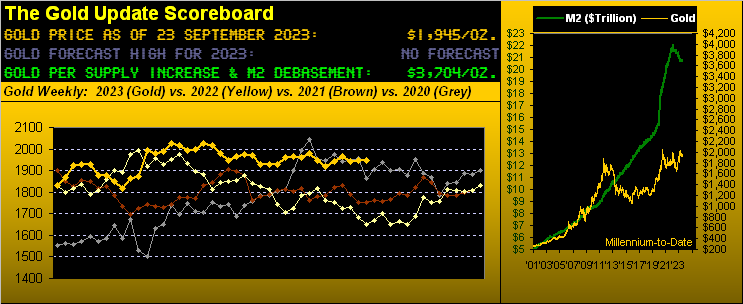
Still for those of us is the Gold know, our so-called GPTT continues blow-by-blow. For nary over a week ago, we were waving Gold’s flag to and fro. And as this past week did unfold, it appeared that Gold finally was on the go. Gold having then settled at 1946, we wrote our song and dance — including in last Tuesday’s Prescient Commentary the anticipation of price reaching the mid-1970s — and come Tuesday the yellow metal had streaked up to 1969 … only to then give it all back and then some by reaching down to as low as 1933 come Thursday.
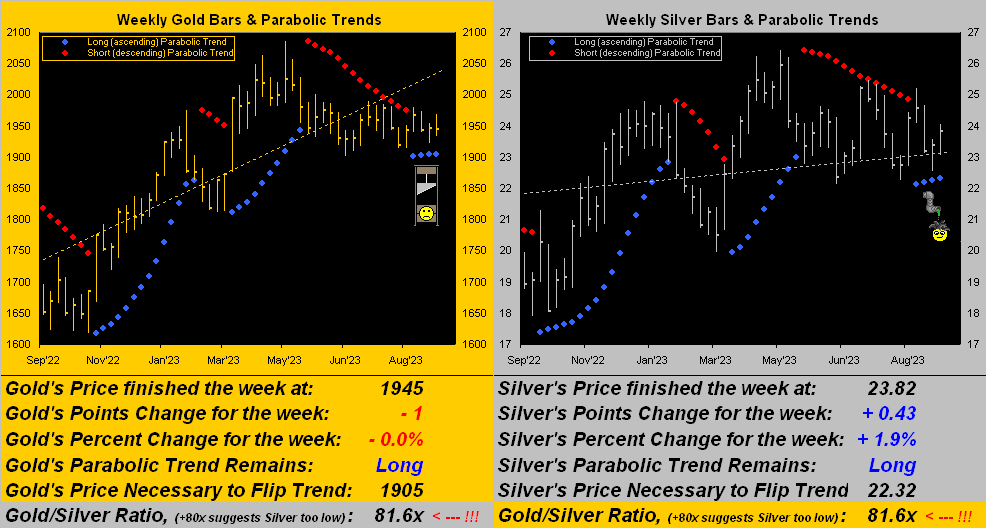
“Blame it on the Fed!“, they say. “The Dollar’s soaring up!”, they say. “Rates’ll never go down!”, they say. Either way, Gold settled the week yesterday (Friday) at 1945 in netting a -1 point loss for the week after tracing therein a high-to-low range of -36 points. ![]() “It’s torrr-orrr-turrre…”
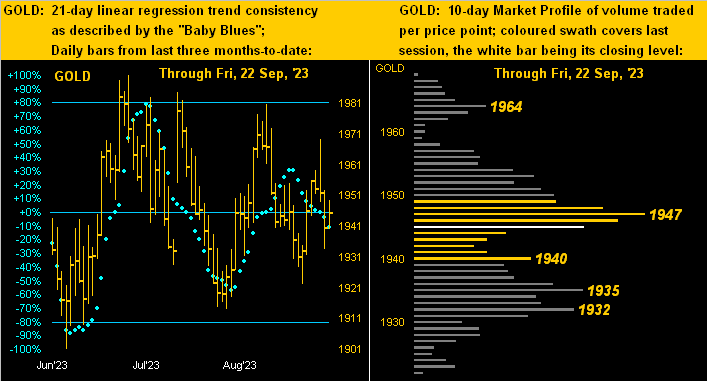
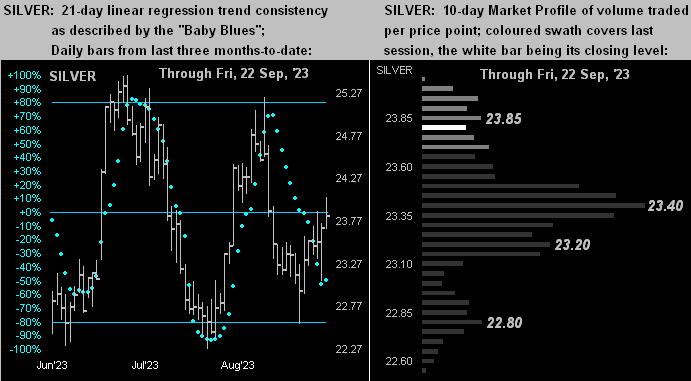
“It’s torrr-orrr-turrre…” ![]() –[The Cure, ’87]. And yet for both the yellow and white metals, the respective weekly parabolic trends remain Long per their rightmost four blue dots, with Silver actually bettering Gold for the week:
–[The Cure, ’87]. And yet for both the yellow and white metals, the respective weekly parabolic trends remain Long per their rightmost four blue dots, with Silver actually bettering Gold for the week:
Torturous as may be this read, this let’s close with a notable FinMedia musing from late in the week: ’tis the notion that the Fed’s so-called “neutral rate” (i.e. inflation-adjusted lending rate) may have to naturally rise going forward. We wonder if this is to cover for the Fed having creamed the Dollar — increasing its “M2” supply by +42% or some +$6.6T from March 2020 into April 2022.
And yet specific to the Dollar Index, it has nonetheless risen from March 2020 (then 98.05) to 105.29 today. Either “the more there are, the more they’re worth” — else the offsetting currencies, substantively the €uro and ¥en — have been strained and puréed: which of course is the case. The €uro (that surprisingly has lasted more than four years) has gone from costing $1.104 in March 2020 to as low as $0.959 a year ago; (’tis today $1.068 as it now pays an interest rate). But pity the poor ¥en! From 107/$ in March 2020 to a vacation-worthy 146/$ today!
Cue Deep Purple from back in ’73 with ![]() “My Woman from Tokyo”
“My Woman from Tokyo” ![]()
Cheers!
…m…
www.TheGoldUpdate.com
www.deMeadville.com
and now on Twitter(“X”): @deMeadvillePro