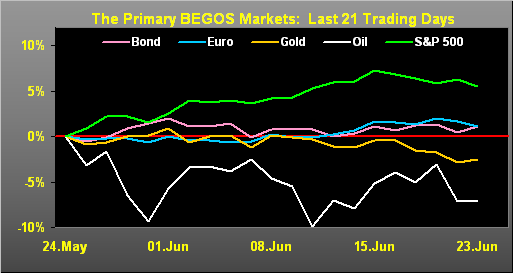
‘Course as you regular readers and website users know, the red line in the above graphic is the track of the S&P 500 astride the Econ Baro from one year ago-to-date. And even as the S&P has come off from its recent high (4448 on 16 June), the mighty Index nonetheless through yesterday’s close (now 4348, exactly -100 points off that high) remains to what we refer as “textbook overbought” using a series of near-term, widely-observed technical indicators.
Further, as we tweeted (@deMeadvillePro) on Thursday with respect to the S&P Futures: “Spoo (4410) daily parabolic flipping Short: last 10 Shorts “averaged” -100 points; so test of Market Profile 4319 apex is reasonable.” Also this past Thursday, the VIX quietly reached its lowest level of complacency (12.73) since pre-COVID January 2020. (That courtesy of the “What, Me Worry? Dept.”)
And yet just a week ago, from one FinMedia source to the next we read ’twas nothing but “The next bull market is just underway!” they say. “Ya gotta be in it to win it!” they say. “S&P targeting 5000!” they say.
But now just four trading days hence (give the StateSide holiday), a 180° turn took sway. Dow Jones Newswires just ran with this headline as tipped by J.P. Morgan: “U.S. stocks head for punishing selloff as ‘unknown unknowns’ could drag market lower…” Oh no, say it ain’t so! Make up yer mind already!
Moveover, now comes this from the childrens’ writing pool over at the once-brilliant Barron’s: “Here’s how to know when to start worrying about the market.” Heck, we’ve been addressing that ad infinitum, as ’tis the easiest query with respect to equities (hat-tip to one Mike Holland from many years ago that “…at the end of the day, stocks are valued by earnings…”). Ready? Per yesterday’s S&P 500 close:
‘Tis not actually that bold of a statement; just the do the math. Still, the parrots cling to “twenty-something”. And given means-reversion, in due course we shall actually — indeed mathematically — revisit a true “twenty-something”. Or to coin a phrase from Madison Avenue: “Watch this space.”
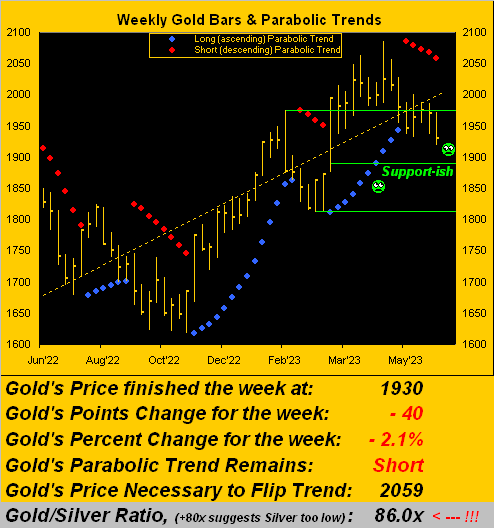
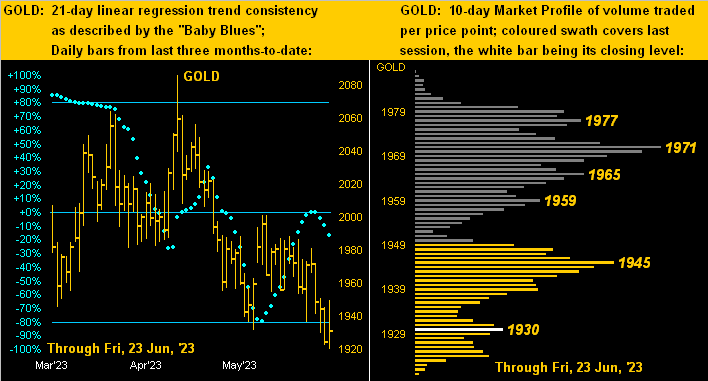
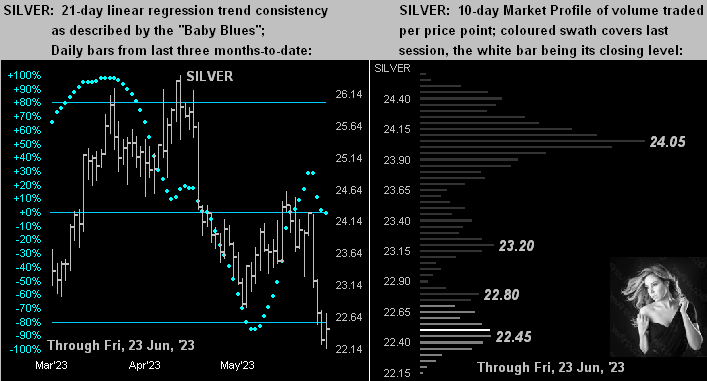
Watch as well from the website our daily updating of these Gold panels. On the left we’ve price’s daily bars from three months ago-to-date. The most recent days highlight the downtrend picking up steam, the blue dots of trend consistency as well curling southward, for which you know the quip: “Follow the blues instead of the news, else lose yer shoes.” On the right is Gold’s 10-day Market Profile with its dominant overhead trading resisitors as labeled:
Looking ahead, as if we’ve not had enough of the Fed planted in our head, comes their favoured inflation gauge: Core Personal Consumption Expenditures, due Friday, 30 June. “Happy Mid-Year!”
Recall for April the annualized Core PCE pace came in at +4.8% (the 12-month summantion being +4.3%). Now for May, “expections” are for a month-over-month dip from +0.4% to +0.3%. Should that be the case, the annualized pace becomes +3.6% and the 12-month summary still +4.3%. Either way, both are still well above the Fed’s inflation target of +2.0%, their “pause” notwithstanding.
Still, in fervent anticipation, our FinMedia friends are out to keep us educated: “What is inflation? And why for so long? And why so high?”
“Well, hardly is it ‘high’, mmb…”
Exactly right Squire. But a lot of these folks weren’t around in the Carter years. We recall seeing a rate sheet barely pre-Reagan away back in our banking days in early ’81 declaring the best customers could borrow “at prime” for 22.5%. That’s nearly triple today’s 8% rate. And it hasn’t been for very long at all.
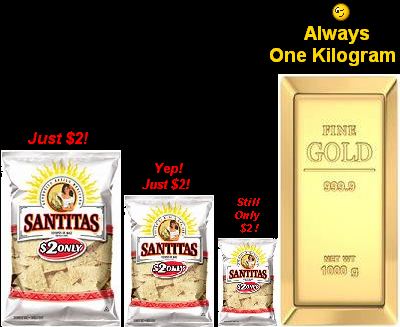
‘Course for you WestPalmBeachers down there as to what really is inflation, ’tis simple: the more there is of something (i.e. Dollars) the less they’re worth and thus the more of ’em it takes to buy the same thing. Or per the famous Santitas example, the less you receive for the same number of Dollars:
And remember: regardless of trend, shorting Gold is a bad idea; so hang on to your Gold!
Cheers!
…m…
www.TheGoldUpdate.com
www.deMeadville.com
and now on Twitter: @deMeadvillePro