The Gold Update: No. 718 – (19 August 2023) – “Gold’s Bottom-Seeking Descent; BRICS Seeming a Non-Event”

The Gold Update by Mark Mead Baillie — 718th Edition — Monte-Carlo — 19 August 2023 (published each Saturday) — www.deMeadville.com

Gold’s Bottom-Seeking Descent; BRICS Seeming a Non-Event

Gold just completed its 10th down week of the last 15, “spot” settling yesterday (Friday) at 1890 and the far more actively-traded December contract at 1918.  Regardless, where is the bottom?

Such bottom-seeking descent hasn’t actually been that dire:  basis December from its 01 May settle of 2081 to today’s 1918 is a price decline -7.8% across those 76 trading days.  Within that period, the yield on three-month money has increased from 5.000% to now 5.278% whilst the liquid StateSide money supply (“M2”) has shrunk from reaching $20.89T (per 02 June) to now $20.70T.  Thus in turn, the Dollar Index has increased from 101.885 on 01 May to now 103.350, as “less is more”.

‘Course you long-time readers of The Gold Update well know that such conventional wisdom “resistors” are futile. For when Gold goes, it goes.  Recall the six-month run from January 2010 through June 2010 wherein even as the Dollar Index rose some +10%, Gold in stride rose nearly +7%?  Or with respect to interest rates when from 2004 through 2006 the Federal Reserve’s Funds Rate rose from 1.00% to 5.00%, Gold therein rising +59% (from 402 to 639)?  So again now, with respect to Gold today:  where is the bottom?

Let’s assess Gold’s weekly bars and parabolic trends from one year ago-to-date:


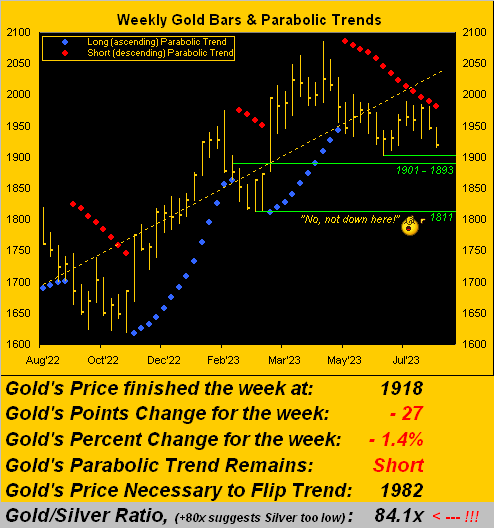
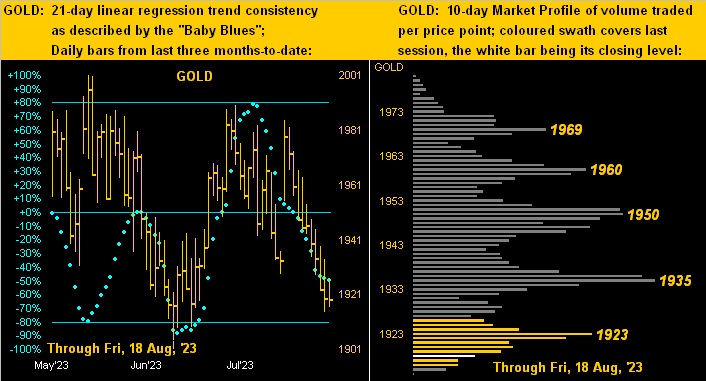
Our best sense is that Gold is near — if not at — its bottom for this red-dotted parabolic Short trend, (now 13 weeks in duration).  Note the two green support lines for the 1901-1893 zone:   1901 is the trend’s overall low from the week ending 30 June; and 1893 is the oft-reliable mid-point of the 1975-1811 support structure established during those weeks ending 03 February through 03 March.  Were that zone to go — to which we say “No!” — 1811 would then become ripe for consideration.

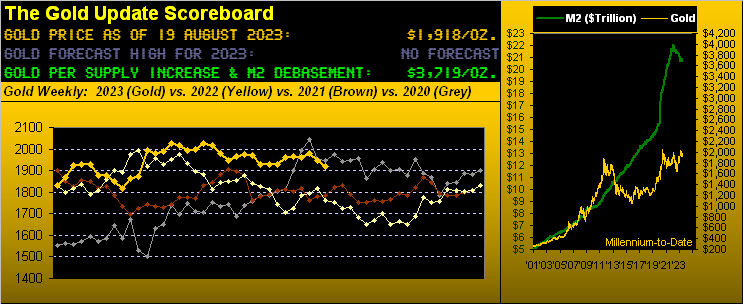
To be sure, the market — today 1918 — is never wrong; yet neither is Gold’s value — today 3719 — mathematically to Dollar debasement.  And since Gold is overwhelmingly priced in Dollars over any other currency, let’s briefly consider some FinMedia bantered-upon tricks by the BRICS.

Thus with a tip-of-the-cap to our Who Knows What to Believe Dept.” as Brazil, Russia, India, China and South Africa gather in the latter for the ensuing week’s meeting, speculation is significantly rife over a variety of outcomes.  “Yet another new currency regime”, they say, (indeed a curious combining of the “5Rs”:  Real, Rouble, Rupee, Renminbi, Rand).  “The world’s new reserve currency”, they say. “And it’ll be pegged to Gold”, they say.  “But it won’t be convertible to Gold”, they say.  And the “they says” continue ad nauseum.  For what ’tis all worth, (which perhaps is nothing), we deem the outcome of it all as a non-event, and further that ’tis (whatever ’tis is) already priced into the primary BEGOS Markets (Bond, Euro, Gold, Oil, S&P 500)

Still, we’re a bit bemused again by the speculation of pegging a new currency to Gold yet without convertibility thereto.  Given Gold primarily is transacted in Dollars, then is the new currency not in that sense pegged to the Dollar?  And given the Dollar itself is (as are all the fiats) based on nothing, a BRICS currency is but another money mix.  It thus might well be based on cereal box of Trix.  You can see where the logic in pricing falls apart.

Moreover, what would you pony up to buy a “5R”?  If the BRICSters desire creating a new currency, great:  go for it.  We’ve had ’em all though history, some notables being various Dinars, Kwanza , Pengo, various Pesos, notorious Reichsmarks, et alia.  Remember too 97’s Asian Contagion and 98’s Russian Debt Crisis?  So what’s another pile of bad actors’ BRICS anyway, eh?  “Got Gold?”  To reprise the late, great Richard Russell:  “Gold’ll be the last man standing.”

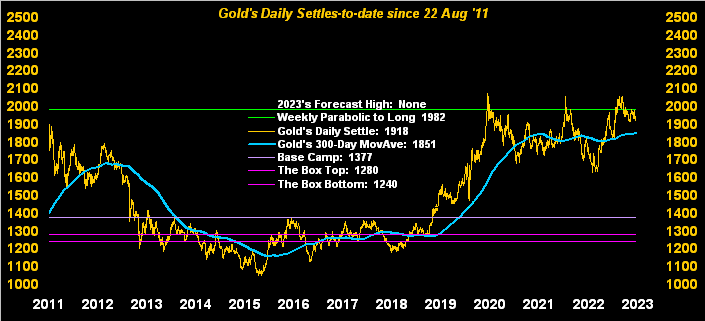
In fact, let’s see how Gold has been standing across the past dozen years.  As vastly undervalued as the yellow metal remains, the bent of price’s daily settles from what was then (on 22 August 2011) Gold’s All-Time Closing High of 1900 to today has at least regained resiliency even as StateSide “M2” has since more than doubled!

But mmb, you did write back in 2011 that Gold was too high…

Absolutely correct, Squire.  But run the regression vis-à-vis Dollar debasement across the last four decades and — even accounting for Gold’s own supply increase — valuation today is the aforementioned 3719.  Just in case you’re scoring at home.  “Tick, tick, tick goes the clock, clock, clock…”  Do not miss out:

Turning to the Economic Barometer, its week produced quite an up-streak.  Of the 14 incoming metrics, 10 improved period-over-period, albeit the National Association of Home Builders portends August’s Housing Starts and Building Permits shall show slowing (when next reported on 19 September).  But quite curious amongst the data was the NY State Empire Index tanking from July’s +1.1 reading to -19.0 for August, whilst the Philly Fed Index was rising from -13.5 to +12.0(!)  Is that indicative of a mass exodus from New York City to so-called “Little New York”?  Stay tuned…

Meanwhile as to this current Econ Baro spike, to borrow from an old Memorex advert of 40-50 years ago:  “Is it real? Or is it inflated?”  This past 27 July we had the first peek at Q2 Gross Domestic Product annualized growth, which at +4.6% — less the 2.2% “chain deflator” — netted a real GDP pace of +2.4%.  In other words for you WestPalmBeachers down there, essentially half of the economic growth seems solely due to inflated numbers:  “Yeah, well we sold less product this year but we made more money ’cause we raised prices!”  Let’s see how long that lasts.  Here’s the Baro:

Therein the red line is of course the S&P 500, this year’s high (4607 on 27 July) we’re ruminating as it for all of 2023.  Yes, our “live” price/earnings ratio for the S&P remains unrealistically high at 44.3x (basically double the Index’s lifetime P/E mean).

That is even more significant given the overall poor quality of Q2 Earnings Season having just ended.  Doubtless you shan’t find the following on your favoured FinTv station:  because we actually do the math, for the 1,867 companies collected, only 49% bettered their bottom lines from Q2 a year ago.  Ex-COVID quarters, that is the worst year-over-year comparative performance since Q3 of 2015.  (‘Course 65% of earnings “beat estimates”, the brokering tool to suck in the ignorant).  And whilst 60% had revenue increases, this bottom-line decline means ‘tis getting more costly to run businesses“Uh-oh, say it ain’t so!”  See?  ‘Twasn’t on your FinTV.  From the website, here’s Q2 visually:

Visually for Gold we next go to our two-panel display of price from three months ago-to-date on the left and 10-day Market Profile on the right.  And as much as we hate being right when assessing Gold’s descending baby blue dots of trend consistency, again we say “Follow the blues instead of the news, else lose your shoes.”  (To wit, too, last week’s leading tweets [@deMeadvillePro] on Oil).  As for Gold, price again lies near the base of the Profile:

Then we’ve Silver — whose ratio from Gold is a value-grabbing 84.1x (this century’s mean being 67.7x) — and for whom the like display is looking a bit better.  Silver’s “Baby Blues” (below left) are just starting to curl upward, whilst price sits just above major trading support (22.75) in the Profile (below right).  Can Sweet Sister Silver actually lead Gold?  Absolutely!  (Your homework assignment is to review October-November 2022).  Whoo-hooo!  Here’s the current graphic:

Let’s wrap with a look at the stack:

The Gold Stack
Gold’s Value per Dollar Debasement, (from our opening “Scoreboard”): 3719
Gold’s All-Time Intra-Day High: 2089 (07 August 2020)
2023’s High: 2085 (04 May)
Gold’s All-Time Closing High: 2075 (06 August 2020)
The Weekly Parabolic Price to flip Long: 1982
10-Session “volume-weighted” average price magnet: 1945
Trading Resistance: 1923 / 1935 / 1950 / 1960 / 1969
Gold Currently: 1918, (expected daily trading range [“EDTR”]: 18 points)
10-Session directional range: down to 1914 (from 1982) = -68 points or -3.4%
Trading Support: (none by the Profile)
The Gateway to 2000: 1900+
The 300-Day Moving Average: 1851 and rising
2023’s Low: 1811 (28 February)
The Final Frontier: 1800-1900
The Northern Front: 1800-1750
On Maneuvers: 1750-1579
The Floor: 1579-1466
Le Sous-sol: Sub-1466
The Support Shelf: 1454-1434
Base Camp: 1377
The 1360s Double-Top: 1369 in Apr ’18 preceded by 1362 in Sep ’17
Neverland: The Whiny 1290s
The Box: 1280-1240

To sum, the two big (arguably non-) events in this week next spent are of course the FinMedia BRICS-speculative narratives plus the Kansas City Fed’s annually-sponsored summer camp at magnificent Jackson Hole, to a degree on par with The Who’s (indeed Krazy Keith Moon’s) “Tommy’s Holiday Camp” –[1969].  

So who’s camping your monetary value? Hopefully YOU with Gold and Silver too!

Cheers!

…m…

www.TheGoldUpdate.com
www.deMeadville.com
and now on Twitter:  @deMeadvillePro