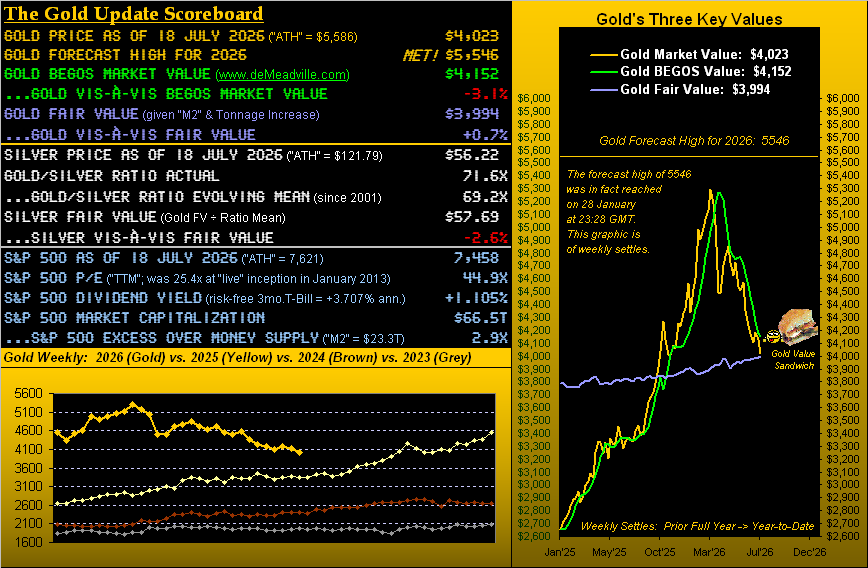
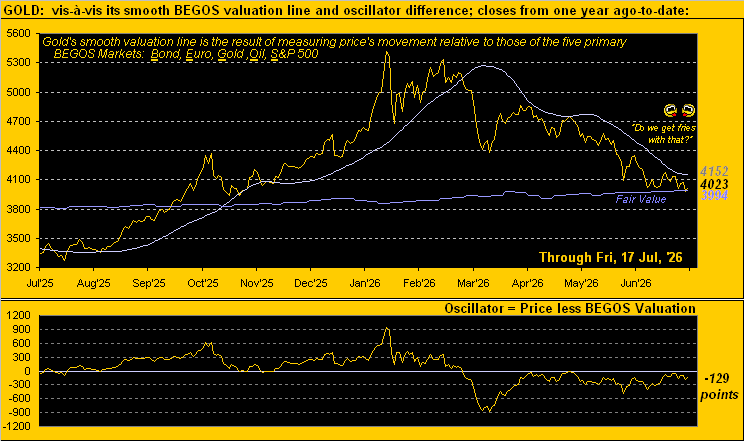
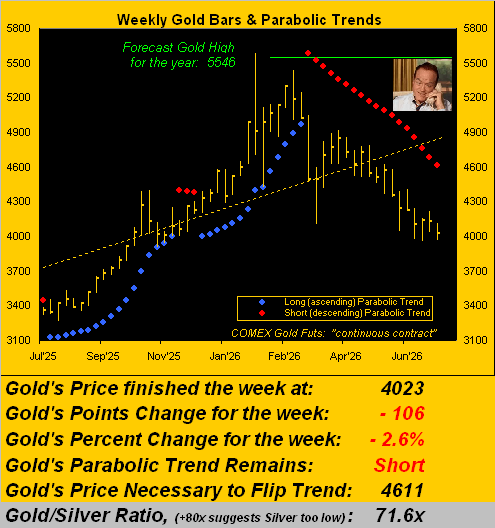
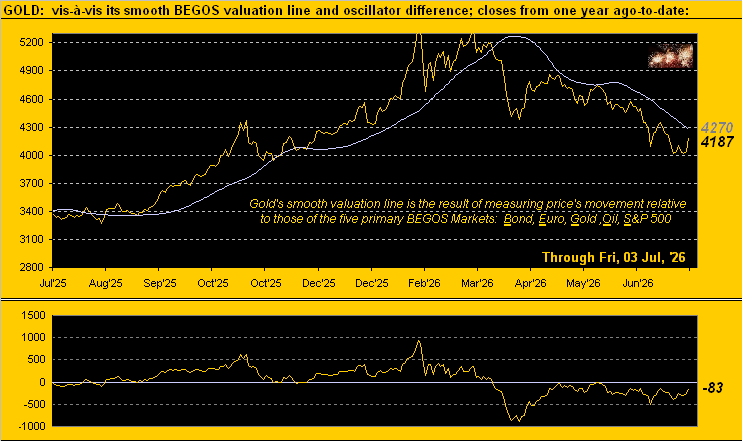
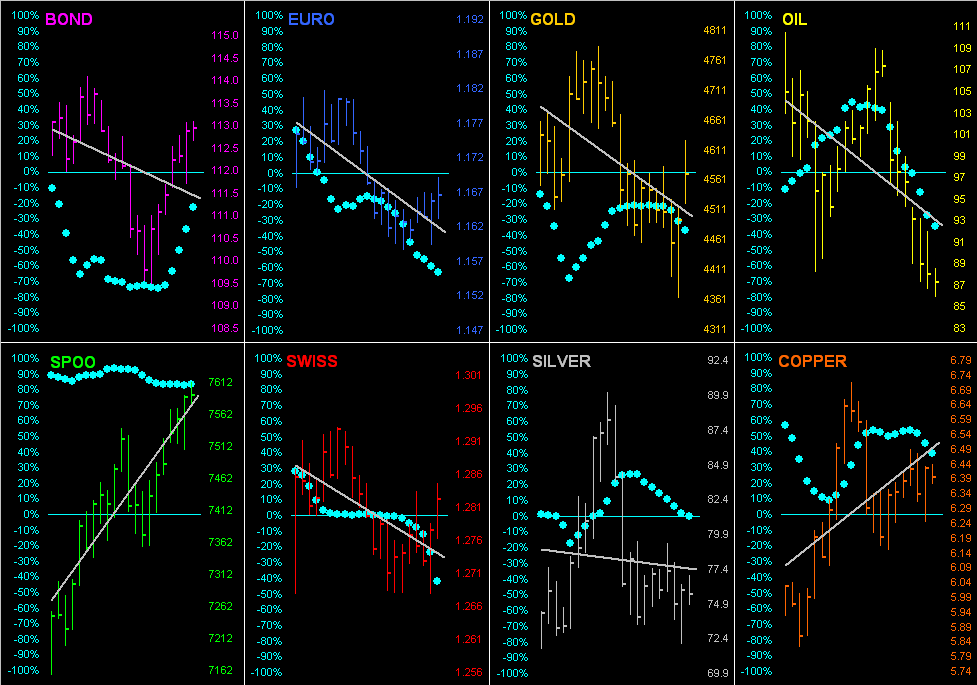
The Bond is below its Neutral Zone for today, whilst above same are both Silver and Oil; session volatility for the BEGOS Markets is mostly moderate. The Gold Update sees price closely sandwiched between Fair Value (3994) and the BEGOS Market Value (in real-time 4151), albeit the key trends (daily linreg and weekly Parabolics) remain negative. Oil on Friday settled above its own BEGOS Market Value: we sense there is a run to at least 86, although price has already gapped higher to start the week; looking at Oil’s best Market Rhythm for pure swing consistency, we’ve (on a 10-test basis) the 6hr Parabolics and (on a 24-test basis) the 2hr MACD. Following a very busy week of 20 incoming Econ Baro metrics, just three come due for this week, beginning today with June’s Leading (i.e. “lagging”) Indicators. Rather, taking center stage is Q2 Earnings Season, its third week kicking into high gear.
 Mark
Mark
The Gold Update: No. 870 – (18 July 2026) – “Gold Hope Need Cope With Downslope”
Yet suddenly, is it all going “right” for the Fed? Is the pressure off to raise the Funds rate come the Federal Reserve’s Open Market Committee vote on 29 July? Can they instead simply enjoy summer down in the easy chair since they ![]() “…ain’t goin’ nowhere…”
“…ain’t goin’ nowhere…”![]() –-[Dylan, ’67]?
–-[Dylan, ’67]?
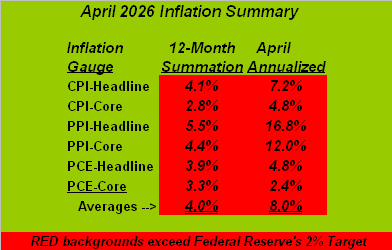
To wit, the June inflation numbers thus far: at the retail level the Consumer Price Index deflated -0.4%, as at the wholesale level did the Producer Price Index by -0.3%. And as herein noted a week ago, the “Fed-favoured” Personal Consumption Expenditures inflation gauge shan’t be released until the day after the meeting, (barring the Bureau of Economic Analysis tipping them off in advance, which surely wouldn’t be cricket). Yet now, you know and we know and everyone from Bangor Maine to Honolulu knows the FOMC for a rate change shall vote “No”.
But there is some mildly negative change in direction of the Economic Barometer. Oh to be sure, nine of last week’s large batch of 20 incoming Econ Baro metrics improved period-over-period, the notable Big Winner being June’s Housing Starts which beat both consensus and those for May, even as they were revised higher. But at the other end of the month’s housing spectrum, Building Permits notably slowed, missing consensus with May revised lower, and Pending Home Sales actually shrank at the third worst rate in nearly two years. As for deflation? Again cue Lewis Carroll’s Alice: “Curiouser and curiouser…”:
Here now is the stack:
The Gold Stack (continuous contract pricing):
Gold’s All-Time Intra-Day High: 5586 (29 January 2026)
2026’s High: 5586 (29 January)
Gold’s All-Time Closing High: 5411 (28 January 2026)
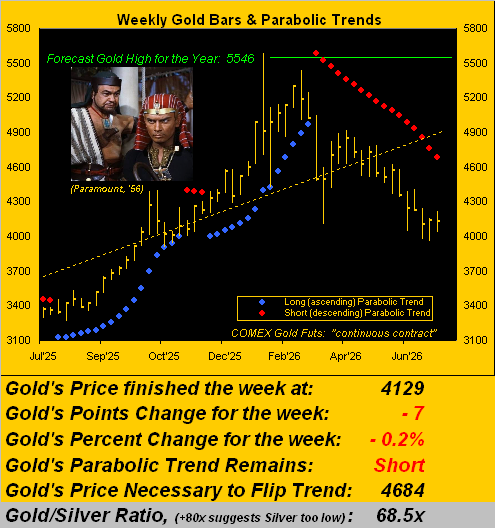
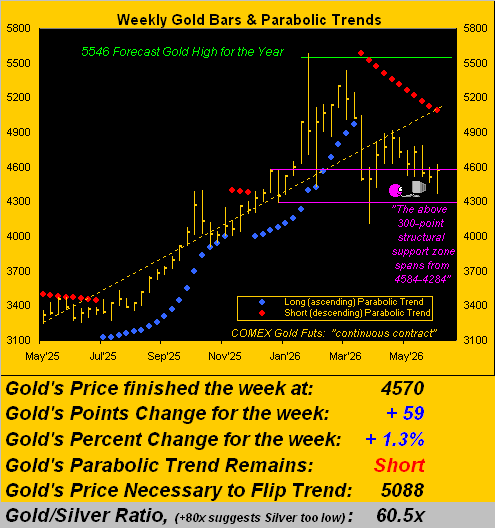
The Weekly Parabolic Price to flip Long: 4611
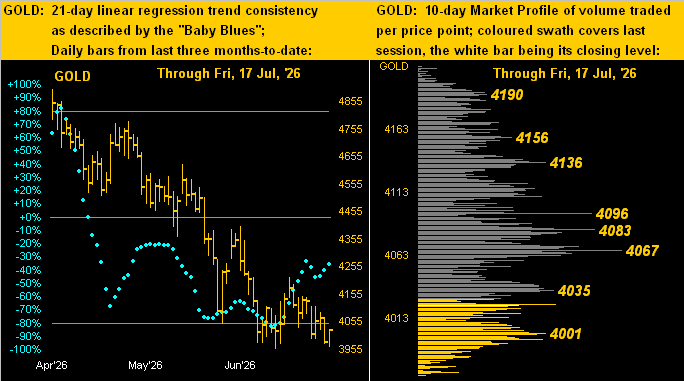
Gold’s BEGOS Market Value (from our opening “Scoreboard”): 4152
The 300-Day Moving Average: 4136 and rising
10-Session “volume-weighted” average price magnet: 4082
Trading Resistance: nearby Market Profile notables: 4035 / 4067 / 4083 / 4096
Gold Currently: 4023, (expected daily trading range [“EDTR”]: 100 points)
Trading Support: per the Market Profile: 4001
Gold’s Fair Value per Dollar Debasement, (from our opening “Scoreboard”): 3994
10-Session directional range: down to 3966 (from 4213) = -247 points or -5.9%
2026’s Low: 3955 (30 June)
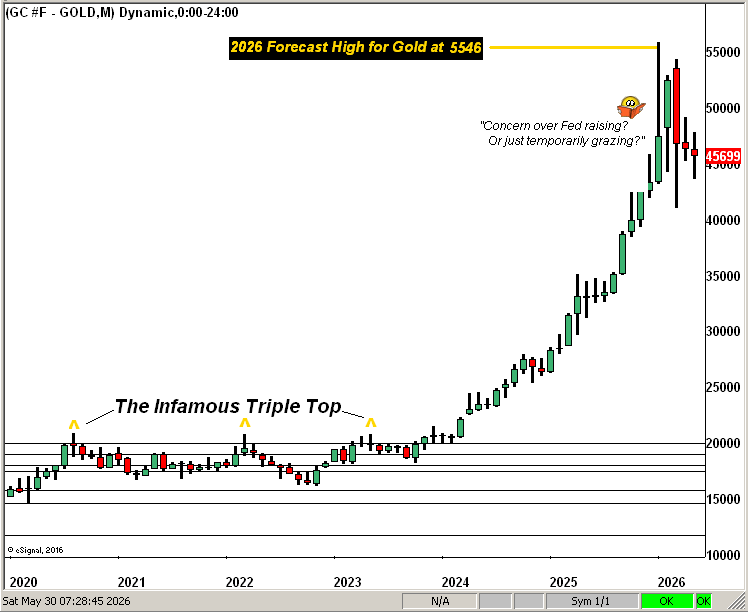
The 2000’s Triple-Top: 2089 (07 Aug ’20); 2079 (08 Mar’22); 2085 (04 May ’23)
The Gateway to 2000: 1900+
The Final Frontier: 1800-1900
The Northern Front: 1800-1750
On Maneuvers: 1750-1579
The Floor: 1579-1466
Le Sous-sol: Sub-1466
The Support Shelf: 1454-1434
Base Camp: 1377
The 1360s Double-Top: 1369 in Apr ’18 preceded by 1362 in Sep ’17
Neverland: The Whiny 1290s
The Box: 1280-1240
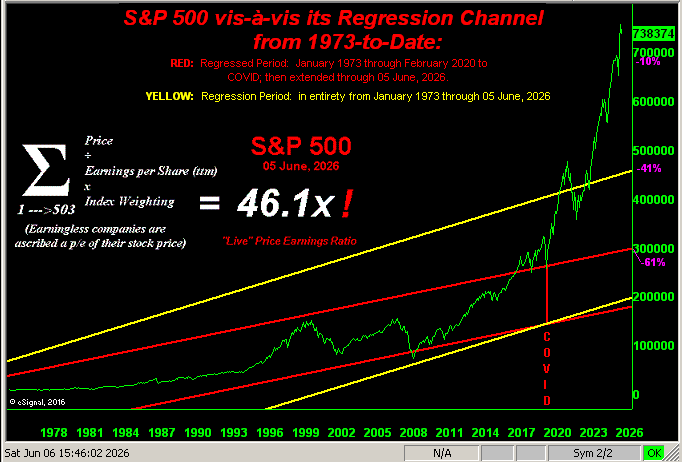
To close, we remain mindful of the S&P “Casino” 500’s excessive (understatement) overvaluation, the price/earnings ratio at this writing (per the opening Scoreboard) at 44.9x, (i.e. double, indeed triple, as was taught in portfolio theory). And to that point, we always are heartened when today’s shrewd (i.e. “rare”) analyst senses same. Hat-tip Oxbow’s Ted Oakley, the wealth manager wary of a -40% correction. Where would that be elicited on our ever-daunting 53-year graphic of the S&P? Here ’tis per the blue line labeled at 4572, (-40% below the record high of 7620)…
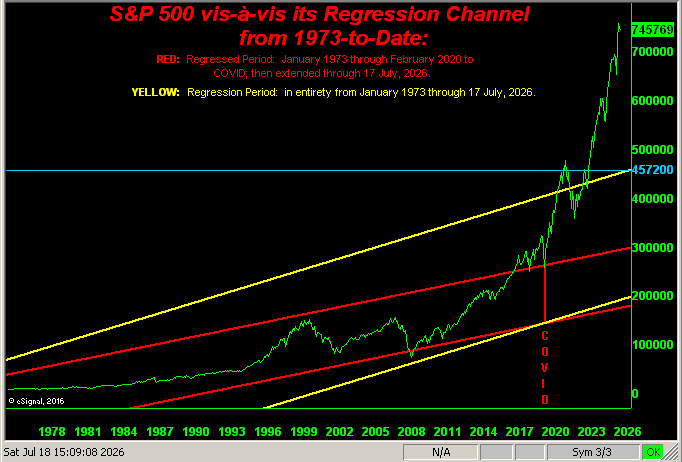
…which is basically spot-on the top of the yellow regression channel. Folks, you canNOT make this stuff up!
So notwithstanding coping with Gold’s downsloping, our hope is your hanging onto Gold when all else is folding!
Cheers!
…m…
www.TheGoldUpdate.com
www.deMeadville.com
and now on “X”: @deMeadvillePro
17 July 2026 – 08:45 Central Euro Time
Presently, Gold is above its Neutral Zone for today, whilst Copper and the Spoo are below same; volatility for the BEGOS Markets is pushing toward moderate. The Spoo (currently 7523) yesterday dropped through its most volume-dominant Market Profile supporter of 7590, albeit by Market Trends, the Spoo (and barely Copper) are in positive linreg, that being negative for the other six BEGOS components. The Spoo’s best Market Rhythm for pure swing consistency its ponderous daily EMA (10-test basis) and its daily Moneyflow (24-test basis). Q2 Earnings Season, whilst still quite young, is thus far very good with year-over-year improvement; problematic thereto is the ongoing issue of earnings — even as improved — ultimately being unsupportive of price, especially give the short-term risk-free annualized yield of the T-Bill (3.697%): the “live” (futs-adj’d) P/E of the S&P is 45.1x, and its risk-full yield a wee 1.118%. The Econ Baro concludes its busy week with July’s UofM Sentiment Survey, plus June’s Housing Starts/Permits, Ex/Im Prices, and IndProd/CapUtil. And tomorrow brings our 870th consecutive Saturday edition of The Gold Update.
16 July 2026 – 08:47 Central Euro Time
Gold, Silver and Oil are presently below today’s Neutral Zones; the rest of the BEGOS Markets are within same, and session volatility is again light. Yesterday, both the Euro and Swiss Franc crossed above their Market Magnets and cleared volume-dominant Market Profile resistance (respectively at 1.146 and 1.247); this suggests further near-term upside for the currencies; cautiously however, the Euro is already well-above its BEGOS Market Value by (in real-time) +0.034 points; still, the “Baby Blues” (see Market Trends) are indicative of both currencies’ negative linregs soon rotating to positive. Cac volume for Oil is rolling from August into that for September. And the Econ Baro looks to a substantive batch of incoming metrics, including July’s Philly Fed and NAHB Housing Indices, June’s Retail and Pending Home Sales, plus May’s Business Inventories.
15 July 2026 – 08:47 Central Euro Time
Both the Euro and Spoo are at present above today’s Neutral Zones, whilst Gold is below same; BEGOS Markets’ volatility is light. Silver by its Market Profile has been flirting either side of its most volume-dominant price of the past fortnight at 58.90, (currently 58.42). Amongst the five primary BEGOS components, the best current correlation is positive between the Euro and Gold: indeed by their 21-day negative linregs, their “Baby Blues” paths of trend consistency are quite similar (see Market Trends). Looking at Market Rhythms for pure swing consistency, the Top Three (10-test basis) are the non-BEGOS Yen’s 1hr MACD, and both Gold’s daily Moneyflow and 15mn Parabolics; too, (24-test basis) we’ve Copper’s 6hr MACD, the Swiss Franc’s 30mn Parabolics and Oil’s 2hr MACD. For the Econ Baro we’ve July’s NY State Empire Index, plus June’s wholesale piece of the inflation puzzle by the PPI: yesterday’s CPI data was indeed surprisingly deflationary by the headline level (-0.4%), supporting the case for the FOMC to sit come 29 July, contra to our long-running notion that they need raise, with the “Fed-favoured” PCE not arriving until after the meeting (30 July). And late in the session comes the Fed’s Tan Tome.
14 July 2026 – 08:41 Central Euro Time
Oil’s +9.1% net daily gain yesterday ranks third-most year-to-date; (Gold’s -2.9% loss was its 12th-weakest). At present we’ve Gold , Copper and Oil above today’s Neutral Zones; the balance of the BEGOS Markets are within same, and volatility for the session is pushing toward moderate. In going ’round the horn for the Market Values of the five primary BEGOS components in real-time: the Bond is 2^18 points “high” above its smooth valuation line, the Euro 0.030 points “high”, Gold +129 points “low”, Oil -2.26 points “low” (it had been more than -20 points “low” three weeks ago), and the Spoo +377 points “high”. Yesterday, both Gold and Silver crossed beneath their Market Magnets, suggestive of further near-term selling, even as The Gold Update is looking for higher levels, albeit therein noting the war can forestall such direction; Gold yesterday basically reached down to Fair Value (3989) before bouncing today (just as had happened two weeks prior). June’s inflation puzzle begins today with what by consensus is expected to be a benign CPI. Et Vive La France!
13 July 2026 – 08:49 Central Euro Time
With the exception of Oil which is above its Neutral Zone for today, the seven other BEGOS Markets are all below same, and session volatility is moderate. The Gold Update has a near-term bullish take, however as therein considered, the ramping up again of the war is maintaining selling pressure on the precious metals, as the Dollar (for Oil) gets the bid. The Euro on Friday fell below the key Market Profile support (now resistance) level of 1.146 and passed below its Market Magnet of 1.145, price now trading in the 1.143s: the Euro’s best Market Rhythm for pure swing consistency has been (on a 10-test basis) the 8hr MACD and (on a 24-test basis) the 30mn MACD. ‘Tis a busy week for the Econ Baro with 18 incoming metrics scheduled, beginning today (late in the session) with June’s Treasury Budget. And financial entities’ take center stage into this second week of Q2 Earnings Season.
The Gold Update: No. 869 – (11 July 2026) – “Gold Rally Is Nigh? S&P Sky-High!”

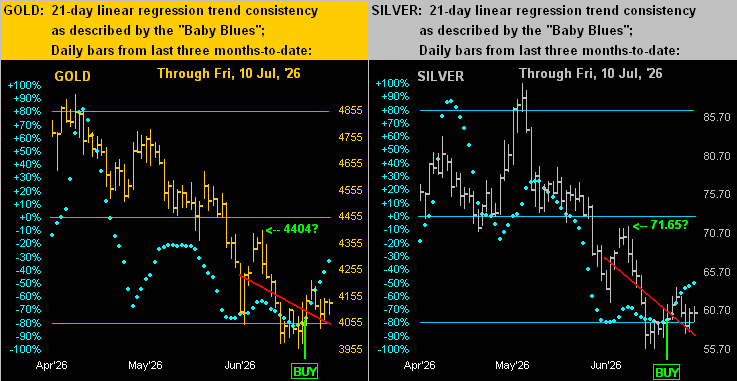
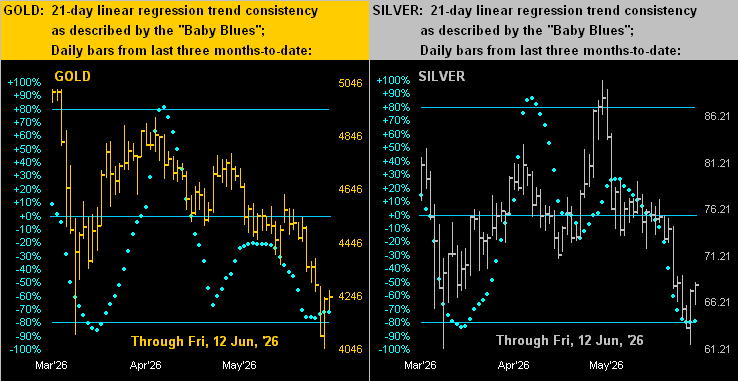
Thus as herein depicted a week ago, the “Baby Blues” signals to buy arrived upon the dots confirming having moved above their respective -80% axes. For those of you scoring at home, these buy points were for Gold per the open on 02 July at 4049, and for Silver a day earlier per her open on 01 July at July 59.25. Too, as above shown, we’ve placed an arrow for both near-term possibilities as stated. Yes: both metals are at present above their buy points. No: there’s not a lot of “grunt in the lump” (a little F1 lingo there meaning “power”)
For in the current day, war keeps getting in the way. And contrary to conventional wisdom — following Gold’s initial war spike back on 28 February when that day’s first trade gapped up +64 points (i.e. “Shorting Gold is a bad idea”) — attempts to further rise have occurred when the war has actually been cooling, only to further fall when actually re-heating.
In this case, the latter is perfectly in tune with the past week, the StateSide Executive Branch declaring termination of yet another USA/IRN “ceasefire”, upon which the metals resumed ![]() “Southbound”
“Southbound”![]() –[The Allman Brothers Band, ’73].
–[The Allman Brothers Band, ’73].
Again, it all sounds backwards; however through recent years we’ve graphically demonstrated Gold’s tendency to “spike n’ plunge” with respect to geo-political events. Notably so is the case with this current war, as it affects the world’s economic engine known as Oil, for which the U.S. Dollar is tendered, the Buck thus getting the bid, in turn making Gold skid.
Regardless, as you long-time readers know, Gold plays no currency favourites. Rather, ’tis ultimately about the weight and purity. Hat-tip Cecil B. DeMille per recounting from the 13th century B.C. Dathan saying to Rameses II “But for ten talents of fine gold, I’ll give you the wealth of Egypt.” That equates to some $45M today. ‘Twas quite the bargain given the country’s GDP is now $430B.
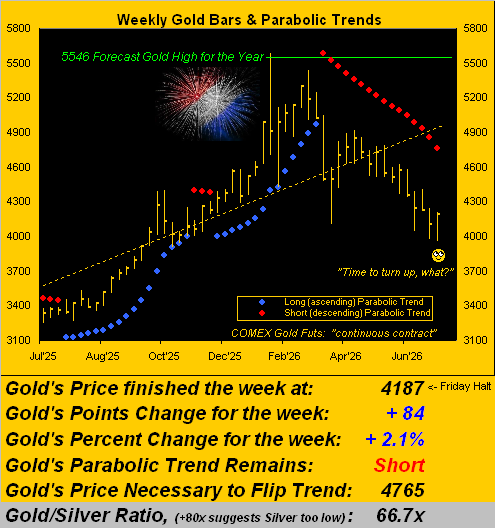
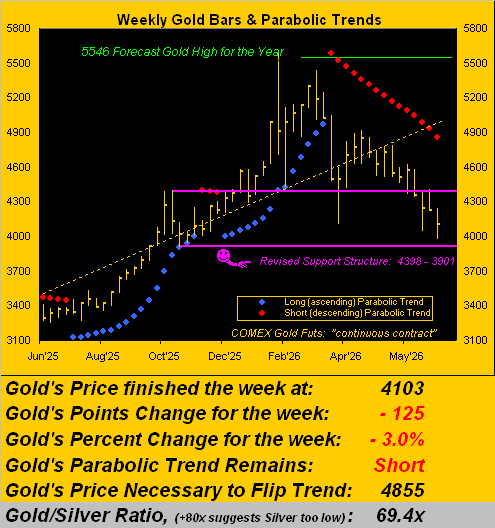
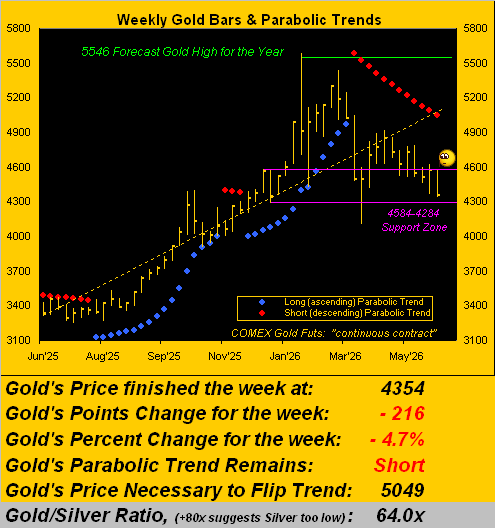
Either way, we segue to Gold’s weekly bars from one year ago-to-date, the red-dotted parabolic Short trend continuing to pound its way down. But “upon further review” price is significantly below the still-positive, dashed regression trendline, such that if the prior week’s low (3955) can hold, again we sense higher days near-term for Gold. You tell ’em, Yul:

And yes, those two embedded Dow Jones Newswires headlines came displayed online one right after the other: even the FinMedia is hedging! Let’s see how next week’s incoming load of 20 Econ Baro metrics — plus Q2 financial entities’ earnings — plus the on-again off-again on-again war — affect it all. As for our recently math-measured case for a -10% correction in the S&P 500, instead, the mighty Index now at 7575 is within a day’s trading range of another record high, which would be above 7616. (No, we’re not shelving our -10% correction notion).
Which puts us in mind of this classic graphic included in The Gold Update of 10 February 2024, the S&P 500 then -34% lower than ’tis today. (Yes, really). Why re-post it now as ’twas then, rather than update it? Because the theorized “stock market” red line would be well above the chart’s available frame space:
.png)
“Very funny, mmb, yeah I remember it…”
Squire, we also remember this from the same missive as regards the price/earnings ratio of the S&P:
- The day before the Garzarelli Crash of ’87 the P/E was 20.3x;
- The day before commencement of the DotComBomb of ’00-’02 the P/E was 29.3x;
- The day before the start of the FinCrisis of ’07-’09, the P/E was 18.7x.
Today (per the opening Scoreboard) the S&P 500’s P/E is 47.0x. “Whoopsie!”
Just do the math yourself, of which at times we’ve cited “AI” (“Assembled Inaccuracy”) is incapable:
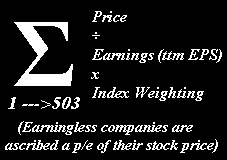
Indeed, Got Gold?”
Cheers!
…m…
www.TheGoldUpdate.com
www.deMeadville.com
and now on “X”: @deMeadvillePro
10 July 2026 – 08:47 Central Euro Time
At present, we’ve the Bond, Euro, Swiss Franc and Copper all above today’s Neutral Zones; the rest of the BEGOS Markets are within same, and session volatility is mostly moderate; of note thereto, the non-BEGOS Yen has already traced 160% of its EDTR (see Market Ranges). Despite Oil’s ongoing negative linreg, its “Baby Blues” of trend consistency (see Market Trends) yesterday confirmed having moved above the key -80% axis, indicative of still higher prices near-term, (which fundamentally would be in sync should the war re-heat). The Spoo remains the sole BEGOS component with a positive linreg, albeit that is now weakening. Tomorrow brings the 869th consecutive Saturday edition of The Gold Update. As previously stated, nothing is due for the Econ Baro. And the first week of Q2 Earnings Season concludes today.
09 July 2026 – 08:45 Central Euro Time
The Bond, Euro, Swiss Franc, Gold, Copper and Spoo are all at present above their respective Neutral Zones for today; below same is Oil and within same is Silver; BEGOS Markets’ volatility is moderate. The re-heating of the war did not play well into the S&P 500 yesterday, albeit price firmed in the latter part of the session, and would open a bit higher still were stocks to open at this instant; still, we remain sensitive to a -10% correction for the S&P, the Spoo’s “Baby Blues” (see Market Trends) of trend consistency having (in real-time) kinked lower. Too, as noted yesterday, the Bond’s linreg (also in real-time) has provisionally rotated to negative, even as price is higher thus far in this session; therefore, the only BEGOS component still with a positive linreg at the moment is the Spoo. The Econ Baro concludes its light week today, incoming metrics including June’s Existing Home Sales.
08 July 2026 – 08:42 Central Euro Time
Both Gold and Silver are at present above today’s Neutral Zones; the rest of the BEGOS Markets are within same, and session volatility is light. Notably, EDTRs (see Market Ranges) having been narrowing since March/April, at a time when the war was a more dominant trading influence, some examples of maximums-to-now being Oil above 10 points then vs. 3.19 for today, the Spoo 142 points then vs. 99 for today, Silver over 13 points then vs. 3.45 points today, and Gold 283 points then vs. 112 today. As to the Bond, its linreg (see Market Trends) appears en route to rotating to negative by week’s end: the 30yr yield has moved back above 5% for the first time in three weeks. Today the Econ Baro looks to May’s Wholesale Inventories and (late in the session) Consumer Credit. And at 18:00 GMT come the FOMC Minutes from the 16/17 June meeting.
07 July 2026 – 08:41 Central Euro Time
Presently, we’ve the Bond, Swiss Franc, all three elements of the Metals Triumvirate and the Spoo below their respective Neutral Zones for today; otherwise, the Euro and Oil are within same, and volatility for the BEGOS Markets is pushing toward moderate. By Market Trends, only the Bond and Spoo are in positive linreg, the latter having twice flirted in rotating to negative within the past three weeks; that noted, the “Baby Blues” of trend consistency are curling upward for every BEGOS component, save for the Bond. Looking at our Top Three Market Rhythms for pure swing consistency, we’ve (on a 10-test basis) the Euro’s 30mn MACD, Silver’s 12hr Parabolics and Gold’s daily Moneyflow, plus (on a 24-test basis) Copper’s 6hr MACD, the non-BEGOS Yen’s 2hr Moneyflow and Oil’s 2hr Parabolics. The Econ Baro looks to May’s Trade Deficit, which by consensus is expected to be far more negative than normal, (’tis said), due to excessive demand for foreign supplies over fears of shortages due to the war, (i.e. higher-than-normal imports).
06 July 2026 – 08:42 Central Euro Time
The two-day session continues from Friday for settlement today, with at present the Swiss Franc below its Neutral Zone, whilst above same are Gold, Copper and the Spoo; BEGOS Markets’ volatility continues as moderate. The Gold Update looks to price’s negative trend as abating, with near-term potential above 4400 for Gold and back up into the 70s for Silver; the weekly Parabolic Short trend for Gold can reasonably flip to Long by month’s end; Gold’s best Market Rhythm for pure swing consistency has been (on a 10-test basis) the daily Moneyflow and (on a 24-test basis) the 30mn MACD; for Silver, her best per those test bases have been the 12hr Parabolics and 6hr MACD. The Econ Baro begins a fairly light week of incoming data with June’s ISM(Svc) Index. And this is the first week of Q2 Earnings Season, the initial reports arriving following Tuesday’s session.
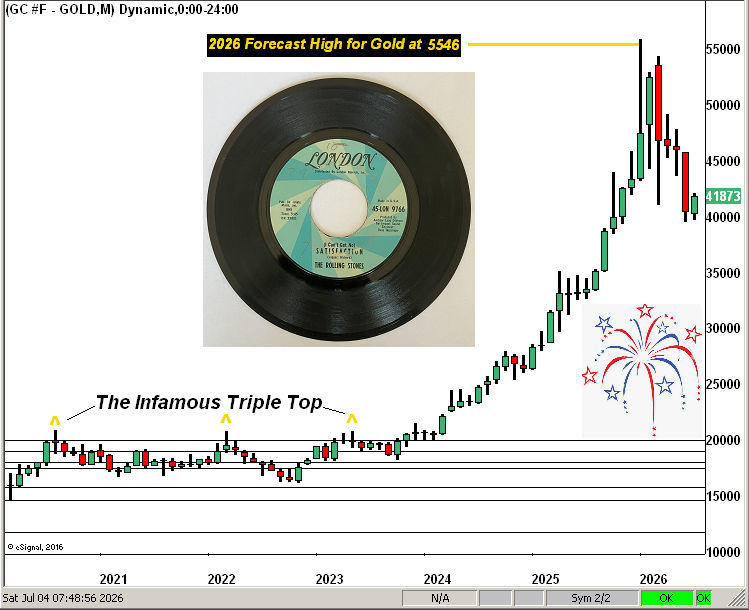
The Gold Update: No. 868 – (04 July 2026) – “Get Gold Groovin’!”

As to Gold’s structure by the month since the year 2020, price’s last four consecutive down months (March through June) may just now be getting some relief this early July (the rightmost candle) after gettin’ no ![]() “Satisfaction”
“Satisfaction”![]() :
:
So there we are, half the year but a memoir. Our deMeadville analytics are indicative of higher Gold near-term, supported (just maybe) by a little waffling as to Fed direction. Again, how might “The Warrior” be drafting it?

In the interim, let’s get groovin’ rather than fazed, and watch precious metals’ prices get raised!
…m…
www.TheGoldUpdate.com
www.deMeadville.com
and now on “X”: @deMeadvillePro
03 July 2026 – 08:44 Central Euro Time
StateSide physical bourses are closed in recognition of tomorrow’s holiday; however, the BEGOS Markets are again in a two-day session (with a trading halt today at 17:00 GMT) for Monday settlement. And save for the Bond, the seven other BEGOS components presently are up, six being above their respective Neutral Zones; the Bond and Oil are within same, and session volatility already is mostly moderate. Gold has done quite well after bottoming a week ago in and around Fair Value: more on the metals in tomorrow’s 868th consecutive Saturday edition of The Gold Update. The Spoo for the second time in the past three weeks has reversed its negative linreg (see Market Trends) back to positive; ’tis been our sense that the S&P 500 is into a -10% correction down toward the 6800s, yet money keeps flowing back into the Index, even as the “live” (futs-adj’d) P/E is at this moment an excessively high 46.6x. A Happy, Safe & Sane Fourth to our StateSide mates!
02 July 2026 – 08:47 Central Euro Time
As was the case coming into yesterday for Silver, now Gold’s “Baby Blues”(see Market Trends) are moving up from their -80% axis, indicative of still higher near-term prices. The yellow metal at present is the sole BEGOS Market outside (above) its Neutral Zone for today, and overall session volatility is light. Gold (now 4085) has moved above its most volume-dominant Market Profile resistor (now supporter) of 4042. The Spoo is trading either side of the volume-dominant 7545 level. Our best current correlation amongst the five primary BEGOS components is positive between the Euro and Gold. And the month’s normally “first-Friday” release of Payrolls data for June is instead scheduled for today given tomorrow’s StateSide holiday; other incoming metrics include May’s Factory Orders and the usual Thursday Initial Jobless Claims. The BEGOS Markets tomorrow do commence a two-trading-day session for Monday settlement, all components having a Friday halt at 17:00 GMT. We shall comment.
01 July 2026 – 08:40 Central Euro Time
Yesterday, Silver’s “Baby Blues” of linreg consistency (see Market Trends) curled up above their key -80% axis, suggestive of higher prices: currently 57.90 (albeit down for the day thus far), a rally toward 61.60 wouldn’t be untoward near-term. At present along with Silver, we’ve also Gold, Copper and the Euro below today’s Neutral Zones; the other BEGOS Markets are within same, and session volatility is moving toward moderate. The futs-adj’d “live” P/E of the S&P 500 is back over 50x (50.7x at this instant) with a wee yield of 1.085%, (that annualized for the 3mo T-Bill being 3.732); still, the MoneyFlow into the S&P has been relatively firm, notably so across the past four trading days, (see S&P 500 > MoneyFlow); that noted, we still sense the -10% correction into the 6800s is developing. For the Econ Baro we await June’s ADP Employment data and the ISM(Mfg) Index, along with May’s Construction Spending.
30 June 2026 – 08:48 Central Euro Time
Into quarter-end, we’ve at present the Euro and Swiss Franc below their respective Neutral Zones for today, whilst above same are Silver and Copper; session volatility for the BEGOS Markets is mostly moderate. Updating our Market Values in real-time for the five primary BEGOS components, there are some remarkable deviations therein: we’ve the Bond +6^30 points “high” above its smooth valuation line, the Euro +0.027 points “high”, Gold -281 points “low”, Oil -21.22 points “low” and the Spoo +316 points “high”. Notably at Market Profiles, the Swiss Franc (1.246) is trading just beneath is most volume-dominant price of the past fortnight (1.247); Oil is right on same at 70.00. The Econ Baro wraps the first half of 2026 with June’s Chi PMI and Consumer Confidence.
29 June 2026 – 08:49 Central Euro Time
Both the Euro and Spoo are presently above today’s Neutral Zones, whilst below same is Gold; BEGOS Markets’ volatility is pushing toward moderate. The Gold Update graphically depicts price having returned to Fair Value, which currently is 3979; ’twas interesting to note the buying surge upon having reached Fair Value, price having since traded (on Friday) to as high as 4112. The Spoo is getting a bid today, at present +0.8% even as by Market Trends the linreg continues to further its negativity; and it remains the case across all of the BEGOS components (except for the Bond) that the linregs are negative. The Bond, at this moment “unch” at 114^04, is trading just above a volume-dominant Market Profile apex of 114^02. The Econ Baro is quiet today ahead of what may be an unsteady week of 11 incoming metrics with few by “consensus” expected to improve.
The Gold Update: No. 867 – (27 June 2026) – “Gold – !! ♫ Return to Fair Value ♫ !!”

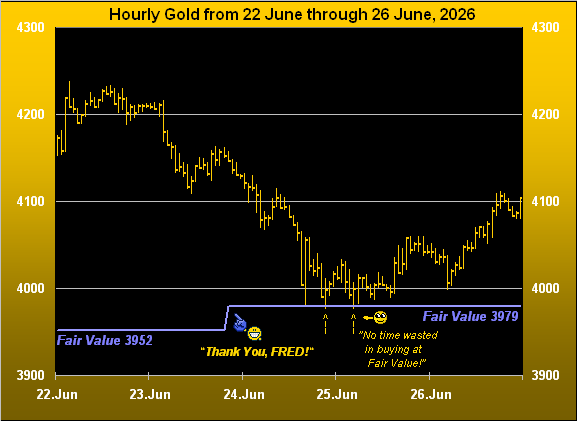
Thus quite obviously, we must cue this one: ![]() “Do the Freddie”
“Do the Freddie”![]() –[Freddie and the Dreamers, ’65]
–[Freddie and the Dreamers, ’65]
“But mmb, you seem all excited because price has been going down!”
Not so much “excited“, dear Squire; rather, “relieved” by Gold’s having reverted to its most important valuation mean. Moreover, the axiomatic attraction of Gold at Fair Value is its buying opportunity. For (courtesy of the “Preaching to the Choir Dept.”), you know, and we know, and everyone from Bangor Maine to Honolulu and right ’round the world knows that Gold’s Fair Value never materially decreases because neither does the StateSide money supply.
We specify “materially“, for during times of rising interest rates, banks repaying loans through the Fed window in fact momentarily cause a reduction the money supply. Yet, from as far back as 1980, the largest reduction in “M2” occurred just briefly over two weeks during 2023 from $20.765T to $20.599T following the FedFunds rate having increased in excess of 5%. So rarely, if ever, do money supply reductions last very long. The higher the level of “M2”, the higher Gold’s Fair Value, even as adjusted for tonnage increases. And Gold inevitably (although it can take years) reverts to — or at least toward — Fair Value, be it higher or lower.
Remember the ridiculously oversold Gold low of 1045 away back on 03 December 2015? Fair Value that day for “the discarded, yieldless, old relic” was +134% higher at 2442. This past 29 January, Gold reached 5586, (albeit ’twas then well overvalued as herein documented, Fair Value that day being 3856).
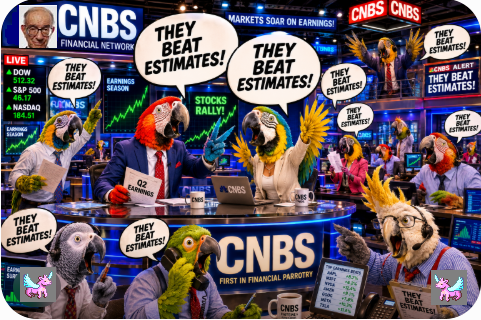
But now we’ve returned to reality, even as century-to-date Gold in settling yesterday (Friday) at 4103 is now +1,399%. By comparison, the S&P “Casino” 500 including dividend reinvestment is but half that at +677%. “What’s been in your wallet?” (As you long-time readers know, we fortunately learned to turn off the FinTV parrots 20 years ago and instead do our own math. Gold wins. Overwhelmingly).
The point being: if you purchase Gold at or below Fair Value, with patience, it categorically will be worth more in the future. Period. ‘Tis the world’s easiest long-term trade! Again as herein penned in our 29 March piece:
- “…What if — to pay off the StateSide federal debt of now $39T — the Fed merely made an accounting entry of same, and ’twas distributed to all the creditors? To be sure, the ‘M2’ money supply would leap 2.7x from today’s $22T to some $61T. Inflation would become hyper-impalpable. And were it to happen, say, over this weekend, Gold having settled Friday [then] at 4492 would open Monday at 10,606 (by Fair Value precision) … just in case you’re scoring at home. ‘Got Gold?’…”
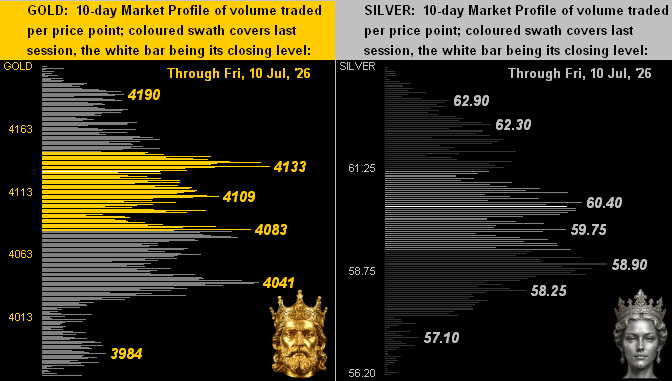
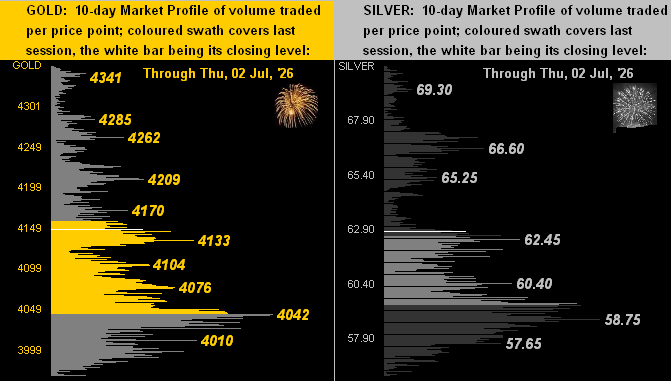
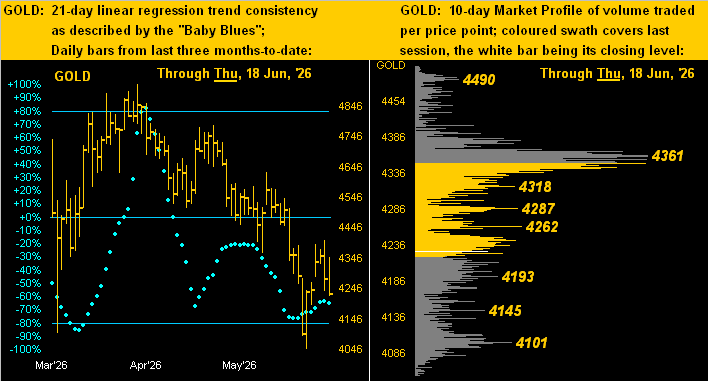
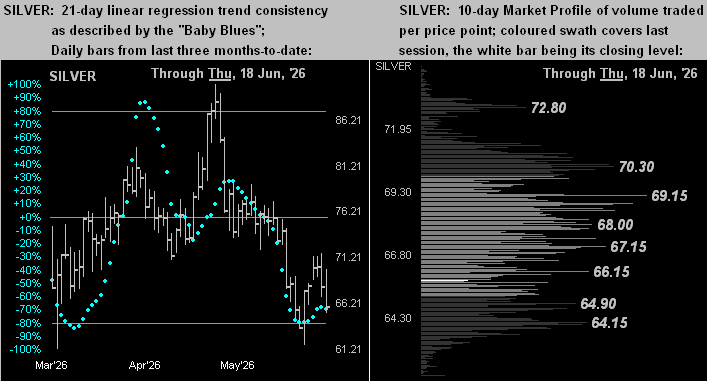
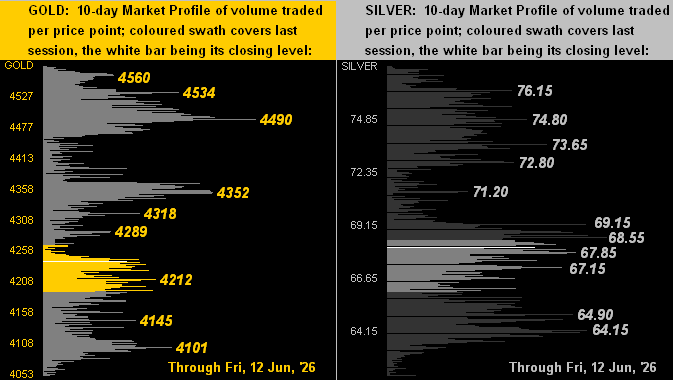
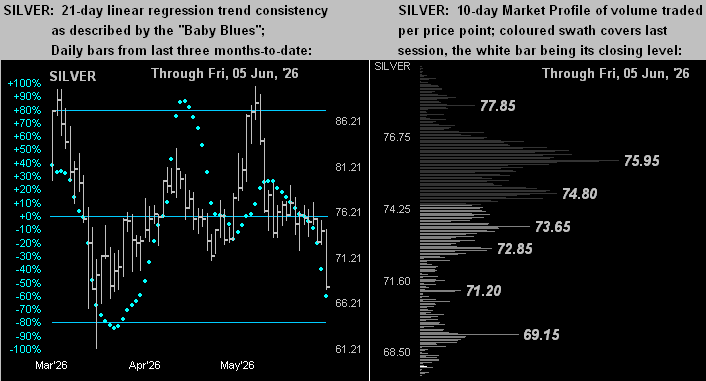
Too, by their respective 10-day market Profiles, overhead resistors appear as minefields for both Gold (below left) and Silver (below right). How about a little Jefferson Starship from back in ’84? ![]() “No Way Out”
“No Way Out”![]() :
:
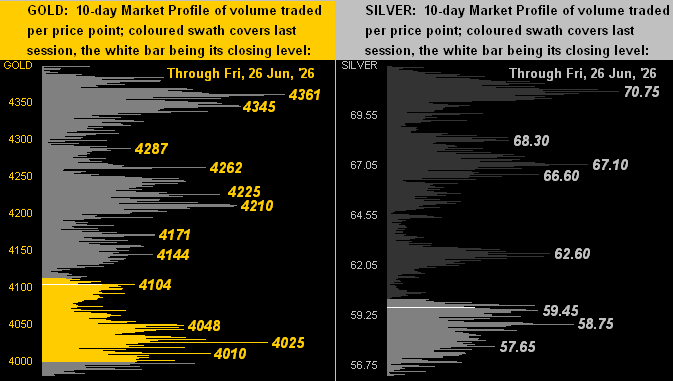
And thus the selling of the precious metals has continued, but again, we now seek some degree of consolidation. The overhead resistors as labeled in the above Profiles may serve at least as cash management guidance, admittedly a lost art in today’s “Nuthin’ but stocks!” casino. But at least for Gold, its ♫ Return to Fair Value ♫ is a most welcome opportunity, especially should price move lower still, (for that later means higher).
Alternatively, there are the parrots:
Last, but hardly least: R.I.P. Alan “Gold Bug” Greenspan. His 20-year chairing of the Federal Reserve System fostered a +138% increase in the StateSide “M2” money supply and a +262% rise in the national debt. But his successors these past 20 years have debased M2 an additional +249% and skyrocketed the debt by another +362%. Double trouble! What’s next? “Got Gold?”
…m…
www.TheGoldUpdate.com
www.deMeadville.com
and now on “X”: @deMeadvillePro
26 June 2026 – 08:40 Central Euro Time
Presently, Copper, Oil and the Spoo are below today’s Neutral Zones; the other BEGOS Markets are within same, and session volatility is mostly moderate. Yesterday’s release of PCE data for May continued to find it above the annualized Fed target of +2%, further supporting a rate hike case for 29 July. The Spoo’s “Baby Blues” of linreg trend consistency are in real-time at their lowest level since 08 April, lending we sense to continuance of a -10% correction for the S&P 500, although a break below the 09 June low of 7247 would add substance to that notion. Obviously tomorrow’s 867th consecutive Saturday edition of The Gold Update shall highlight price having returned to Fair Value. Silver’s cac volume is rolling from July into that for September. And the Econ Baro finishes its week with May’s revision to the UofM Sentiment Survey.
25 June 2026 – 08:53 Central Euro Time
Gold has returned down to Fair Value, that level now 3979 as it incorporates the just-released “M2” data update from the Fed: Gold both yesterday and thus far today has traded to as low as 3976. At present for the BEGOS Markets we’ve just the Bond outside (below) its Neutral Zone, even as price yesterday moved above volume-dominant Market Profile resistance at 112^28 to now 113^31; overall session volatility is again light, in this case expectedly so with “Fed-favoured” PCE data inflation data for May due today. By Market Trends, save for the Bond, the 21-day linregs of the other seven BEGOS components are negative: this is not too surprising given the increase in the Dollar Index through these past several weeks in anticipation of a Fed rate hike as soon as 29 July. Copper’s cac volume is rolling from July into that for September. And amongst other metrics due today for the Econ Baro are the final read for Q1 GDP, plus May’s Durable Orders and Personal Income/Spending.
24 June 2026 – 08:46 Central Euro Time
The Euro, Swiss Franc and Gold are presently below today’s Neutral Zones; the other BEGOS Markets are within same, and session volatility is light. The Spoo settled yesterday below its Market Magnet for the first time since 11 June, indicative of still lower levels near-term, which fits with our notion of the S&P 500 itself en route to a -10% correction into the 6800s; too, the Spoo by Market Trends has rotated in real-time to its most negative slant (mild as ’tis) since 09 April; and by Market Values, the Spoo in real-time is +254 points above its smooth valuation line. Silver today has traded to its lowest level (60.75) since 05 December; and Gold’s low (thus far) today at 4067 is +115 points above Fair Value (3952). For the Econ Baro we’ve May’s New Home Sales and Q1’s Current Account Deficit.
23 June 2026 – 08:46 Central Euro Time
The Metals Triumvirate, Oil and the Spoo all are below their respective Neutral Zones for today; the rest of the BEGOS Markets are within same, and volatility to this point is mostly moderate. The S&P 500 is showing signs of resuming what well can be a -10% correction down into the 6800s: by the Spoo (adj’d for Fair Value), the S&P at this instant would print -1.1% at the open; too, the Spoo yesterday fell through its most volume-dominate supporter at 7564 (see Market Profiles); and the Spoo’s 21-day linreg has again rotated to negative for the second time in the last two weeks; the S&P’s futs-adj’d “live” P/E is 48.8x; by Market Rhythms for pure swing consistency, the Spoo’s best has been (on a both the 10-test and 24 test bases) the 2hr Price Oscillator. Gold at 4131 has reduced to now being +179 points above its Fair Value (3952); and Silver at 62.30 is nearing its recent (11 June) low of 61.60. Again, nothing is on today’s slate for the Econ Baro.
22 June 2026 – 08:41 Central Euro Time
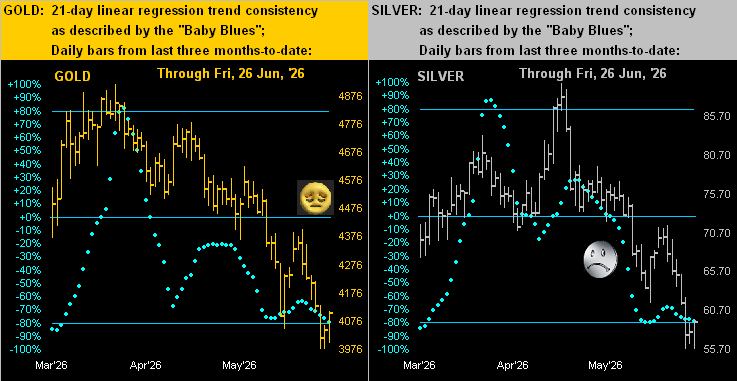
The Friday-to-Monday session continues for the BEGOS Markets, now finding at present the Bond, Swiss Franc, and Spoo below their Neutral Zones; the balance of the BEGOS bunch are within same, and session volatility (inclusive too of Friday) still is moderate. The Gold Update depicts price as having completed a 14th week of parabolic Short trend, (and Silver her 20th); covered as well is BEGOS components’ general market confusion with respect to trends signaling less frequently, and so forth; too therein, the Economic Barometer is suggestive of a top being put in place, as well for the S&P 500. And specific to the Econ Baro, 10 metrics are due for this week, albeit none until Wednesday: the key number shall be Thursday’s “Fed-favoured” PCE for May, thus completing our inflation puzzle for that month.
The Gold Update: No. 866 – (20 June 2026) – “Gold’s Reclusion; Markets’ Confusion”

‘Tis the Northern Hemisphere’s final day of spring: a season of Gold price reclusion and overall markets’ confusion, further festooned with Fed follies, war worries, and ever-sustained super-inflated S&P 500 insanities.
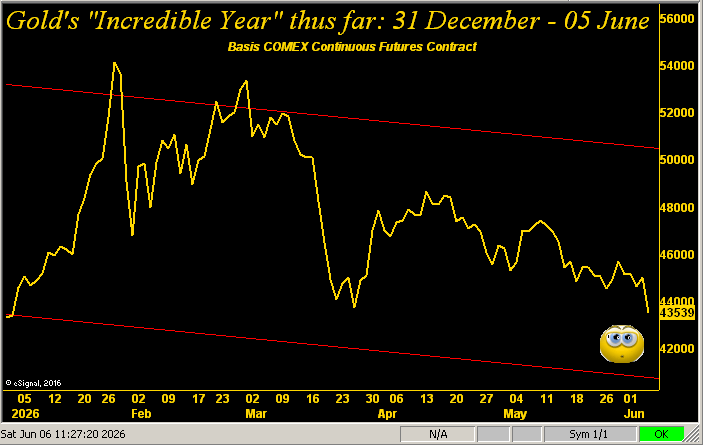
Since Gold opened the first day of spring (20 March) at 4654, price has lost as much as -13.1% to 4046 (just back on 11 June) toward settling this past holiday-shortened week “officially” on Thursday at 4228 — or if you prefer — per yesterday’s (Friday’s) “trading halt” at 4173 toward settlement come Monday: that’s right, this is a Saturday with COMEX Gold “halted” rather than “settled”. When was the last weekend day that happened? Cue San Francisco’s own Jake Holmes’ ![]() “Dazed and Confused”
“Dazed and Confused”![]() –[’67]
–[’67]
By either “halted” or “settled” price, after having peaked year-to-date at 5586 on 29 January, Gold has been in reclusive withdrawal throughout, today’s 4173 level a net decrease from that All-Time High by -25.3%, price all-in thus far for 2026 being -3.7% (having settled out last year at 4332). Here ’tis by the day through the current 4173 “halt” toward Monday’s settle. Note at the graphic’s lower right (per last week’s musical query “? ♫ Return to Fair Value ♫ ?”) price seemingly on approach to such 3952 level :
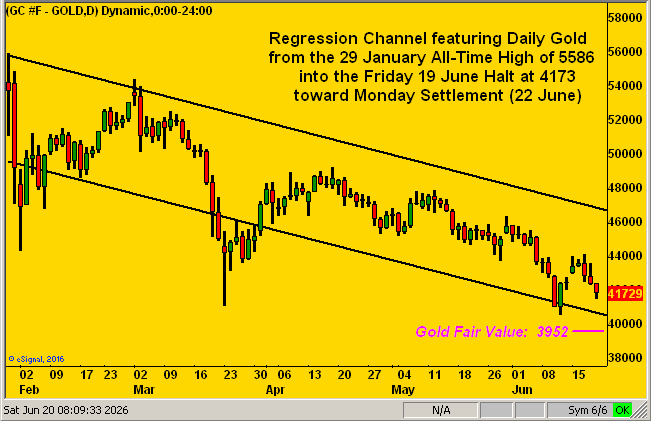
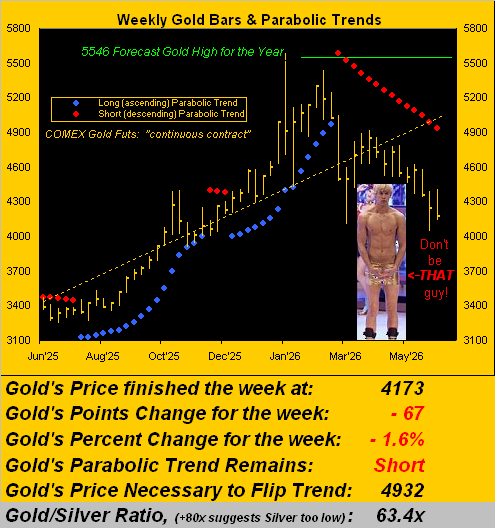
To close, we’ve this from “The Good News Dept.” Century-to-date, “yield-less” Gold now at 4173 is +1,424% and Silver at 64.91 +1,299%. By comparison, the (albeit very scant) yielding “Casino 500” today at 7501 is +631% (or +468% ex-dividends).
To be sure, the precious metals remain in near-to-medium term downtrends. In fact, this past week the children’s writing pool over at the once-mighty Barron’s just figured it out (and we quote): “[Gold] is dangerously close to bear market territory.” (One wonders where’ve they’ve been since February).
Regardless, when FedHead Kevin “The Warrior” Warsh — dare we say “inevitably” — is called upon to bail out Bessent’s Treasury, look for Gold’s reclusiveness to morph into nothing short (no pun intended) of upside monstrousness.
Still — all that said — are you confused by that within your war chest? What say you, Bunky?

“And I sold my Gold for these??” Bummer.
Cheers!
…m…
www.TheGoldUpdate.com
www.deMeadville.com
and now on “X”: @deMeadvillePro
19 June 2026 – 08:49 Central Euro Time
As previously noted, StateSide physical bourses are closed today, however the BEGOS Markets are trading an abbreviated Friday session for Monday settlement. And at present — save for Oil which is above its Neutral Zone for today — the seven other BEGOS components are below same; session volatility is firmly moderate; extended USA/IRN et alia negotiations have for the moment been halted. Tomorrow brings the 866th consecutive Saturday edition of The Gold Update, the yellow metal this past week having moved lower toward Fair Value. By Market Trends, the Spoo’s 21-day linreg — after having rotated from positive to negative (11 June) and then back to positive (15 June) is today (in real-time) virtually flat, indicative that the S&P 500’s correction toward the 6800s may increase its downside pace; the futs-adj’d P/E of the S&P is 48.2x and the yield 1.094%.
18 June 2026 – 08:49 Central Euro Time
‘Tis the final full trading day of the week for physical StateSide bourses; the BEGOS Markets via GLOBEX have abbreviated sessions tomorrow, but all for Monday settlement. As anticipated, the FOMC voted (indeed unanimously) to maintain the FedFunds rate in the 3.50%-3.75% target range via a radically-revised and shortened Policy Statement; our sense for the moment remains the Fed shall pull the trigger come the 29 July Statement, especially should next week’s reporting of the “Fed-favoured” PCE Index for May continue above target. At present, six of the eight BEGOS Markets are above today’s Neutral Zones, Copper being within and Oil below same; session volatility is moderate. Looking at the 21-day linregs (see Market Trends) for all the BEGOS components, six of the eight are moderately negative, the two exceptions being Copper and the Spoo, both mildly positive. We’ve not ruled out the S&P 500 resuming what can be a -10% correction into the 6800s given a Fed rate increase(s) in the inevitable balance. Incoming metrics to close out the Econ Baro’s week include June’s Philly Fed Index and May’s Leading (i.e. “lagging”) Indicators.
17 June 2026 – 08:41 Central Euro Time
Early into “Fed Day” we’ve both Copper and the Spoo presently above today’s Neutral Zones, whilst Oil is below same; BEGOS Markets’ volatility is understandably quite light. By Market Values for the five primary BEGOS components, in real-time the Bond is 3^28 points “high” above its smooth valuation line, the Euro 0.025 points “high”, Gold -139 points “low”, Oil -21.11 points “low”, and the Spoo +383 points “high”. By the latter’s Market Profile, the most volume-dominant overhead resistor is 7630 with like support at 7497; the futs-adj’d “live” P/E of the S&P 500 is 47.9x and the yield 1.115%; that for the “risk-free” annualized three-month T-Bill is 3.630%, (better than 3x the “all-to-risk” S&P). The Econ Baro looks to May’s Retail and Pending Home Sales, as well as April’s Business Inventories. Then at 18:00 GMT comes the FOMC’s “no rate change” Policy Statement, albeit we think ’twill pull the trigger six weeks hence on 29 July.
16 June 2026 – 08:38 Central Euro Time
The volatility of yesterday has notably quieted into today, Oil being the sole BEGOS Market at present outside (below) its Neutral Zone, and overall session volatility is thus light to this point. An interesting observance from yesterday’s +1.7% gain in the S&P 500: as measured by Moneyflow, just two stocks (MU and NVDA) accounted for some +50% of the Index’s gain; otherwise the breadth for the session was 51% up and 49% down, the point being just as two stocks can easily drive the S&P up, they also can drive it well down. Oil’s cac volume is rolling from July into that for August at a discount of -1.30 points; by Market Values (in real-time), Oil is -16.68 points below its smooth valuation line; and by Market Rhythms for pure swing consistency, Oil’s best on a 10-test basis has been the 4hr Price Oscillator, whilst on a 24-test basis ’tis been the 2hr MoneyFlow. For the Econ Baro today we’ve May’s Housing Starts/Permits and Ex/Im Prices.
15 June 2026 – 08:48 Central Euro Time
With “war-deal euphoria” in the air, this morning’s BEGOS Markets directions are predictable: seven of the eight are at present above their respective Neutral Zones for today, the sole component below same of course being Oil, (and thus too the Dollar Index); volatility for the session is moderate. The Gold Update underscores the yellow metal’s key negative trends, suggesting (even as price today is currently up to 4326) that a return to Fair Value (3949) is reasonable to expect. The Spoo’s up-gap opening today — combined with an additional 63 points of price premium as volume rolls from the June cac into that for September — is sufficient to stem the linreg trend having rotated to negative last week; today’s positive price push is flipping the Spoo’s daily parabolics from Short back to Long, however that doesn’t nix our notion that the S&P 500 itself shall soon return to corrective mode with the 6800s in mind. The Econ Baro begins a week of 15 incoming metrics with June’s NY Empire State and NAHB Housing Market Indices, plus May’s IndProd/CapUtil.
The Gold Update: No. 865 – (13 June 2026) – “Gold – ? ♫ Return to Fair Value ♫ ?”
Within Gold’s ongoing negative trend, be it by near-to-medium-term linear regression or by our weekly parabolics et alia, price this past Wednesday at 23:14 GMT posted a year-to-date low of 4046. At that instant, ’twas a net change in 2026 of -6.6%, even though “AI” (“Assembled Inaccuracy”) a week ago had stated that “Gold is having another incredible year.”
We love Gold for its inevitably higher — indeed far higher — levels; however price’s reality of trend, means reversion, and adherence to Fair Value regularly reminds us of present pricing reality. Pure and simple. (The S&P 500 faces that rude awakening, but we digress…)
Given such reality for Gold, we comprised this week’s title by hearkening back to the year 1894, (Gold then ’round $21/ounce). For then from these Mediterranean climes was registered one of the most time-honoured “immortal pillar” standards in musical history as penned and scored by the Neapolitan brothers Ernesto and Giambattista de Curtis: ![]() “Torna a Surriento”
“Torna a Surriento”![]() , which for you WestPalmBeachers down there is
, which for you WestPalmBeachers down there is ![]() “Return (or as on occasion is ascribed “Come Back”) to Sorrento”
“Return (or as on occasion is ascribed “Come Back”) to Sorrento” ![]() . ‘Tis since been modern-day crooned by many-a-star including Frankie (’51), Dino (’52) and Elvis (’61) … just in case you’re scoring at home. And in this case for The Gold Update, we’ve reverently revised it to
. ‘Tis since been modern-day crooned by many-a-star including Frankie (’51), Dino (’52) and Elvis (’61) … just in case you’re scoring at home. And in this case for The Gold Update, we’ve reverently revised it to ![]() “Return to Fair Value”
“Return to Fair Value”![]() .
.
“Because, mmb?”
Because, Squire, upon Gold reaching down to the aforementioned 4046, ’twas within one day’s expected daily trading range of tapping Fair Value at what is now 3949. True, price did not fully [yet] get there; however ’tis ultimately the “raison d’être” (a little French lingo there) of the “Means Reversion Dept.”
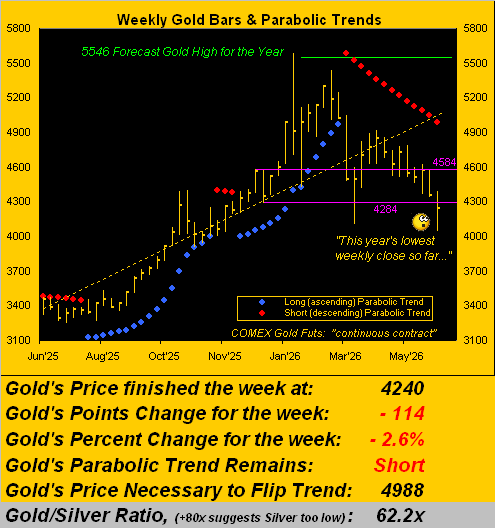
To be sure, Gold from 4046 instead bounced to as high as 4267 before settling the week yesterday (Friday) at 4240. But as the noted trends remain negative, price soon reaching down to Fair Value appears reasonable, Gold having just posted its lowest weekly close year-to-date and sixth down week of the last eight.
Not helping Gold is the Federal Reserve Open Market Committee’s having its knickers in a bit of a bunch. “To raise, or not to raise”, that is the question. Indubitably “yes”, albeit as previously written, we still sense the FOMC shan’t vote to raise the Bank’s Funds rate until their Policy Statement of 29 July, rather than so doing this next Wednesday (17 June), the intrigue of course as overseen by new FedHead Kevin “The Warrior” Warsh.
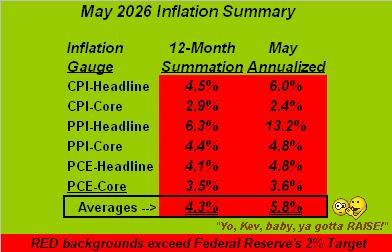
Were the war to wane between those two FOMC dates, (not to mention a “peace deal” possibly being signed at any moment), that could give the Fed some breathing room. But May’s inflation data already is rolling in, the headline Producer Price Index of +1.1% if annualized now +13.2%: Ouch! And ’twill tend to lead June’s Consumer Price Index. As for the “Fed-favoured” Personal Consumption Expenditures Index, its May reading shan’t be released until a week after this next FOMC gathering. But both the PPI and CPI are running sufficiently hot as to be well beyond (understatement) the Fed’s annualized target of +2.0%.
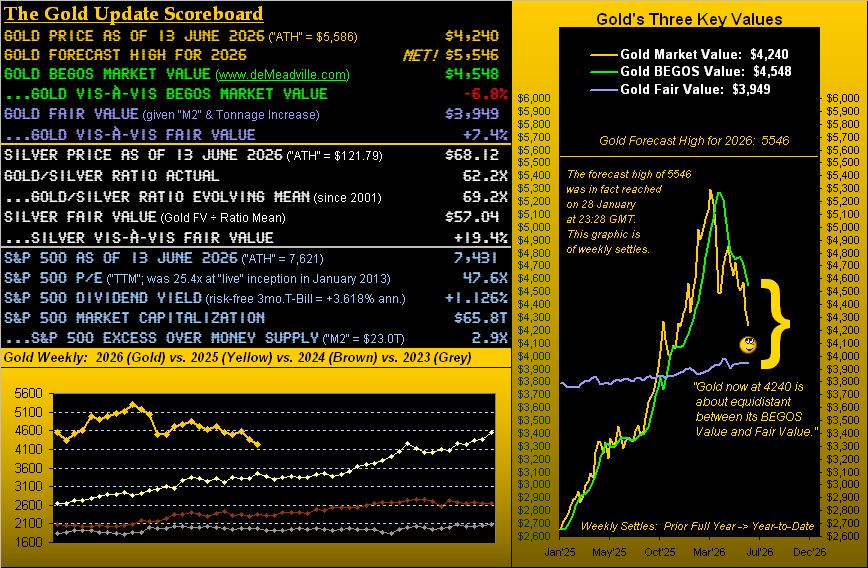
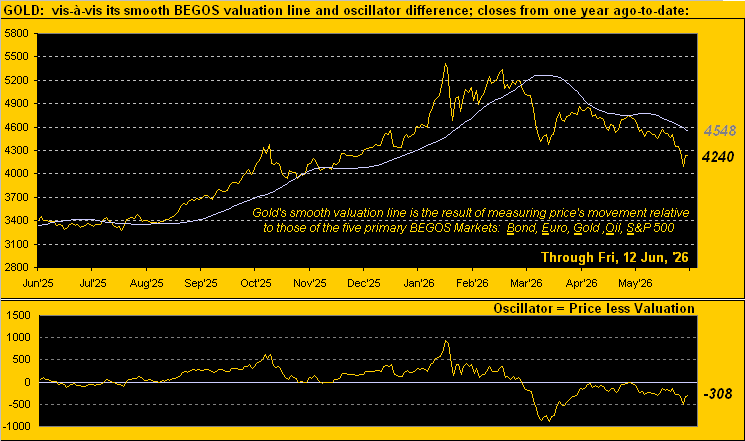
‘Tis thus a convenient period for Gold to return to Fair Value, above which (per the opening Scoreboard) price is presently +7.4% (+291 points) whilst nonetheless being -6.8% (-308 points) below its BEGOS Market Value, the latter as we see here year-over-year:
Note in the Baro’s lower-right corner the S&P 500’s price/earnings ratio having settled the week at 47.6x. Following Wednesday’s -1.6% demise, the mighty (albeit inanely overvalued) Index rebounded +2.3% through Friday. Despite that however, into week’s end the S&P futures’ 21-day linear regression trend rotated to negative for the first time since 10 April, thus reinforcing our sense that the Index remains in “correction” mode down into the 6800s (as herein laid out a week ago) … or further still should the Fed instead unexpectedly be proactive with a Funds rate raise on Wednesday. “Got stops?”
Toward wrapping with that, here first is the stack:
The Gold Stack (continuous contract pricing):
Gold’s All-Time Intra-Day High: 5586 (29 January 2026)
2026’s High: 5586 (29 January)
Gold’s All-Time Closing High: 5411 (28 January 2026)
The Weekly Parabolic Price to flip Long: 4988
Gold’s BEGOS Market Value (from our opening “Scoreboard”): 4548
10-Session “volume-weighted” average price magnet: 4337
Trading Resistance: Market Profile notables: 4289 / 4318 / 4352 / 4490 / 4534 / 4560
Gold Currently: 4240, (expected daily trading range [“EDTR”]: 118 points)
Trading Support: per the Market Profile: 4212 / 4145 / 4101
The 300-Day Moving Average: 4070 and rising
10-Session directional range: down to 4046 (from 4577) = -531 points or -11.6%
2026’s Low: 4046 (11 May)
Gold’s Fair Value per Dollar Debasement, (from our opening “Scoreboard”): 3949
The 2000’s Triple-Top: 2089 (07 Aug ’20); 2079 (08 Mar’22); 2085 (04 May ’23)
The Gateway to 2000: 1900+
The Final Frontier: 1800-1900
The Northern Front: 1800-1750
On Maneuvers: 1750-1579
The Floor: 1579-1466
Le Sous-sol: Sub-1466
The Support Shelf: 1454-1434
Base Camp: 1377
The 1360s Double-Top: 1369 in Apr ’18 preceded by 1362 in Sep ’17
Neverland: The Whiny 1290s
The Box: 1280-1240
And so ’tis toward “Fed Day”, featuring for the first time “The Warrior” as aforementioned. And whilst the Chairman’s vote is but one of 12 comprising the FOMC, his follow-up presser most certainly shall find him in the “hot seat”, so to speak:

‘Course, we wish Warsh well.
But stay with your Gold for the long spell, as a return to Fair Value would not be farewell!
Cheers!
…m…
www.TheGoldUpdate.com
www.deMeadville.com
and now on “X”: @deMeadvillePro
12 June 2026 – 08:33 Central Euro Time
Gold is at present below its Neutral Zone for today; the balance of the BEGOS Markets are within same, and session volatility is light-to-moderate. After trading to the year’s low (4046) yesterday, Gold intra-day recovered nearly +200 points; either way, is Gold returning to Fair Value ’round 3948? More in tomorrow’s 865th consecutive Saturday edition of The Gold Update. Our best Market Rhythms for pure swing consistency are currently dominated by both Copper and Gold: on a 10-test basis, the Top Three rankings are Copper’s 2hr Parabolics, Gold’s daily Moneyflow and Copper’s 2hr MACD; for the 24-test basis they are Copper’s 30mn Price Oscillator and again the 2hr MACD, plus Gold’s 1hr MACD. For the Euro, Swiss Franc and non-BEGOS Yen, cac volume is rolling from June into that for September. And the Econ Baro concludes its week with June’s UofM Sentiment Survey.
11 June 2026 – 08:43 Central Euro Time
We’ve fresh Gold lows for the year, the yellow metal having today reached down to 4046, albeit ’tis since bounced to now 4107, indeed back inside of today’s Neutral Zone; below same is Oil whilst above same is the Spoo, and session volatility for the BEGOS Markets is moderate. Gold’s best Market Rhythm for pure swing consistency has been the daily Moneyflow which flipped to Short effective 28 April’s opening at 4698; too, by Market Trends, Gold’s “Baby Blues” of linreg consistency dropped below their key +80% axis back on 22 April, price having settled that session at 4758. And per its Market Profile, Gold’s “nearby” volume-dominant resistors are 4193, 4289, 4318 and 4352. today’s EDTR (see Market Ranges) being 115 points. Econ Baro incoming metrics for today include May’s PPI, (the month’s “Fed-favoured” PCE not coming due until 25 June during the week following the FOMC’s next Policy Statement of 17 June).
10 June 2026 – 08:39 Central Euro Time
Gold, Copper, Oil and the Spoo are all presently below today’s Neutral Zones; the balance of the BEGOS Markets are within same, and session volatility again is pushing toward moderate. By Market Values, the Bond yesterday settled above its smooth valuation line for the first time since 02 March, albeit as yields have been a bit pressured, price itself has not spent too many days above valuation going back a year or so-to-date. Indeed in going ’round the Market Values horn (in real-time) for the five primary BEGOS components, the Bond shows as +0^14 points “high”, the Euro as -0.003 points “low”, Gold as -357 points “low”, Oil as -9.97 points “low” and the Spoo as +114 points “high”; by Market Trends, the Spoo’s 21-day linreg trend looks to rotate to negative by week’s-end. The S&P 500 after having been technically “textbook overbought” through 42 consecutive trading days finally unwound that condition yesterday; ‘course, fundamentally the “live” (futs-adj’d) P/E of 46.2x remains stratospheric. The May inflation parade beings today as the Econ Baro looks to the CPI, plus late in the session comes the month’s Treasury Budget.
09 June 2026 – 08:35 Central Euro Time
At present we’ve the Euro, Swiss Franc, Copper and Spoo all above their respective Neutral Zones for today; below same is Oil, and BEGOS Markets’ volatility is pushing toward moderate. In concert with the Spoo’s “Baby Blues” now in full cascade (see Market Trends), the S&P 500 (following Friday’s -2.6% fall) yesterday attempted a “relief rally”, at one point having recovered +1.1%, to then settle but +0.3%; our sense remains a fairly near-term return for the S&P down to at least the 6800s, especially as other entities eventually perceive the current rotation of trend toward negative; the Spoo’s best Market Rhythm for pure swing consistency has been its 30mn MACD, and by Market Values (in real-time), the Spoo is +176 points above its smooth valuation line. Today’s Econ Baro awaits May’s Existing Home Sales, plus April’s Trade Deficit and Wholesale Inventories.
08 June 2026 – 08:43 Central Euro Time
The Bond, Gold and Silver are below today’s Neutral Zones, whereas Oil and the Spoo are above same; session volatility for the BEGOS Markets is moderate. The Gold Update cites price’s ongoing negative stance, Gold at this instant (4321) actually now down -0.3% year-to-date. And even as the S&P 500 is poised (via the Spoo) to open higher on the heels of Friday’s -2.6% decline — the biggest one-day drop thus far in 2026 — the Spoo’s “Baby Blues” (see Market Trends) are now in full cascade such that we can see an S&P high-to-low correction of at least -10% down into the 6800s as detailed in The Gold Update; too, despite Friday’s demise, the S&P is entering a 42nd consecutive trading day of being “textbook overbought”. Ten incoming metrics are due this week for the Econ Baro, albeit none are on the slate for today.
The Gold Update: No. 864 – (06 June 2026) – “Gold’s Still-Negative Track; S&P Poised to Crack”
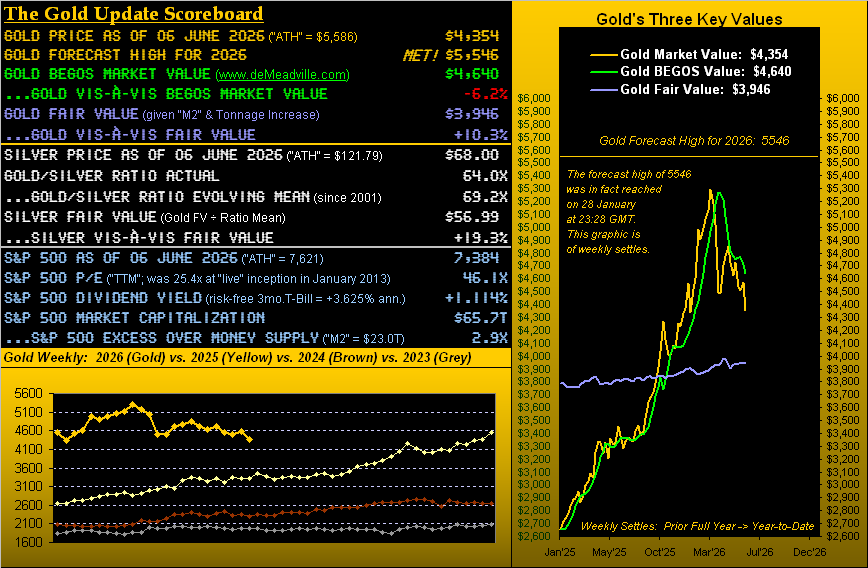
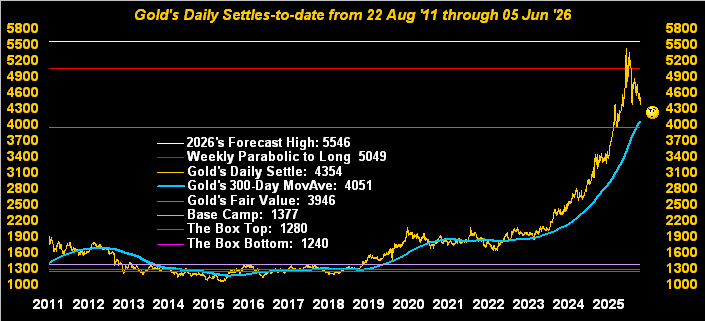
Wrapping it for Gold, clearly the yellow metal has been riding on its net-negative track, even as price by the opening Scoreboard is +10.3% above Fair Value (3946), yet -6.2% below its BEGOS* Market Value (4640) to which typically it can more swiftly ascend as ’tis a “faster” valuation measure.
*BEGOS = Bond / Euro / Gold / Oil / S&P 500
As for the suddenly struggling (albeit long overdue) S&P, we’ll leave you with this:
05 June 2026 – 08:36 Central Euro Time
Let’s start with the Spoo: yesterday we wrote its “Baby Blues” (see Market Trends) of linreg consistency “provisionally” had moved below their key +80% axis; however, come settle, they did not “confirm” as such; regardless, today they are at present again provisionally below -80%, price itself beneath its Neutral Zone for today, as is the case for all three elements of the Metals Triumvirate. The balance of the BEGOS Markets are within today’s Neutral Zones, and session volatility is light-to-moderate. In looking to Market Rhythms for pure swing consistency, on a 10-test basis our top three are Copper’s 1hr MACD, Gold’s daily Moneyflow and Oil’s 30mn EMA; on a 24-test basis Copper owns the top three positions by its 30mn Price Oscillator, 2hr MACD and 2hr Parabolics; Copper’s 21-day linreg still is positively sloped, however the “Baby Blues” are falling such that the trend can rotate to negative during next week. The Econ Baro wraps its week with May’s Payrolls data, plus late in the session comes April’s Consumer Credit.
04 June 2026 – 08:39 Central Euro Time
Both the Swiss Franc and Gold are at present above today’s Neutral Zones; below same are Copper and Oil, and session volatility for the BEGOS Markets is pushing toward moderate. In real-time, the Spoo’s “Baby Blues” which depict linreg consistency are finally breaking down, now provisionally below the key +80% axis; should this be confirmed by session’s end, we’d expect at least initially a drop from here (7544) toward the mid-7400s — which percentage-wise is not that substantive a pullback — but by pricing structure, 7300 appears plausible as does 7279 given the extreme overvaluation of the S&P 500 both technically and obviously fundamentally; as usual, mind the “Baby Blues” on the Market Trends page. Gold, albeit up today, is still in a “mild” downtrend: of technical note, Gold’s weekly Price Oscillator looks to go negative at some point during next week. For the Econ Baro today (along with the usual Thursday Initial Jobless Claims) we’ve the revision to Q1’s Productivity and Unit Labor Costs.
03 June 2026 – 07:36 Central Euro Time
As noted yesterday, just a momentary comment today: we’ve weakness in the the Bond, Swiss Franc and Gold, and strength in Oil. Another record high close yesterday for the S&P 500. The Econ Baro awaits ADP Employment data, Factory Orders and the ISM(Svc) Index. Addendum at 16:58 CET: we’ve returned to our post; the Econ Baro data today was improved for all three reports; later in the session comes the Fed’s “Tan Tome”; and with the exception of Oil, we’ve weakness across the board today for the seven other BEGOS Markets, albeit the Spoo’s “Baby Blues” of linreg consistency (see Market Trends) are still buoyant above the key +80% axis; however their remaining there — we sense — is short-lived.
02 June 2026 – 08:49 Central Euro Time
Currently we’ve the Bond, EuroCurrencies and Metals Triumvirate all above their respective Neutral Zones for today; below same are Oil and the Spoo, and BEGOS Markets’ volatility is mostly moderate. ‘Twas another record-setting day yesterday for the S&P 500, the intra-day high being 7618 and settle at 7600: the Index is now 37 consecutive trading days “textbook overbought” and “extremely so”; by Market Values, the Spoo is (in real-time) +391 points above its smooth valuation line; by Market Rhythms, the Spoo’s best study for pure swing consistency is its 12hr Moneyflow (10-test basis); or if targeting a fixed number of Spoo points, the daily EMA has gained a minimum of 52 points (Long or Short) through its last 10 swings. Nothing is on tap today for the Econ Baro. Note to readers: we are going “in motion” over the next 36 hours or so; tonight’s Tue-Wed work will be run at a minimum level and tomorrow’s commentary may be off-timed and quite brief or later updated; we plan that through the Wed-Thu night work all shall be back to normal.
01 June 2026 – 08:50 Central Euro Time
The new week finds the Bond, Swiss Franc and Gold all at present below today’s Neutral Zones; above same are Copper, Oil and the Spoo, and session volatility for the BEGOS Markets is moving toward moderate. The Gold Update cites the gyrating ways of Gold these days whilst still within a general downtrend since the January All-Time High (5586); too, the weekly Parabolic Short trend mains in place, now entering its 12th week. Were the S&P 500 to open at the instant, ‘twould be at a record high of 7604 give the Spoo still on the upside move this morning.; the Spoo’s “Baby Blues” of linreg consistency (see Market Trends) have yet to break below their key +80% axis. 13 incoming metrics are on the Econ Baro’s docket for this week, beginning today with May’s ISM(Mfg) Index and Construction Spending for April.
The Gold Update: No. 863 – (30 May 2026) – “Golden Gyration; Irksome Inflation”

Gyrating Gold abounds! Through the completion of May’s 20 trading days, Gold (per its August contract) has chronologically gone up to 4708, down to 4546, up to 4810, down to 4681, up to 4769, down to 4488, up to 4616, down to 4396, price nonetheless getting the month-end bid in settling up yesterday (Friday) at 4570. Gold’s gyrating high-to-low run for the month was -8.8% … but the net change was a comparably wee -2.1%, (Gold having closed the month of April at 4669).
Either way, that’s a ![]() “Whole Lotta Shakin’ Goin’ On”
“Whole Lotta Shakin’ Goin’ On”![]() –[Jerry Lee Lewis, ’57] only to result in
–[Jerry Lee Lewis, ’57] only to result in ![]() “Goin’ Nowhere”
“Goin’ Nowhere”![]() –[Chris Isaak, ’95].
–[Chris Isaak, ’95].
However, there’s been this one anti-conventional wisdom constant throughout. On those days wherein ’twas inferred the Middle-East “war shall continue”, Gold would go down; on the alternate days wherein ’twas said a “peace deal was close”, Gold would go up. (And we’ve herein documented ad nauseam how Gold — after initially spiking — then directionally defies geo-political conventional wisdom).
‘Course, on those “war shall continue” days, Oil and the Dollar would get the bid to the detriment of Gold, but vice-versa if “a peace deal was close”. And as noted, such assessment continues to revolve 180° from one day to the next as if ’twere a modern-day rewrite of Leo Tolstoy’s “War and Peace”, –[circa 1865].
“Or even Shakespeare’s ‘Much Ado About Nothing’, huh mmb?”
Well, we wouldn’t go so far as to say war is “nothing”, Squire, but The Bard’s title –[circa 1598] is apropos of Gold’s gyrational travel throughout May, although price’s regression trend has therein been negative, (as surprisingly too has been that for Oil, even as its peaks and troughs have been pointedly opposed to those for Gold).
So, it being month-end, let’s go ’round the horn for all eight BEGOS Markets across their last 21 trading days (one month), featuring their respective grey diagonal trendlines and “Baby Blues” which are the dots that depict the day-to-day consistency of trend. Note the S&P 500 (“SPOO”) sporting the steepest uptrend of the set:
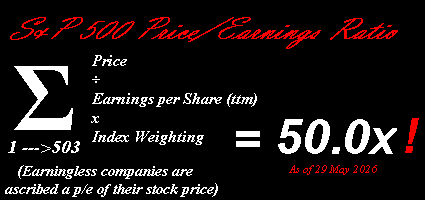
But into feeding “AI” (“Assembled Inaccuracy”) that precise formula, this time the response (and ’tis always different) is that it “…cannot be computed without a private premium database feed…”, in lieu then offering the Wall Street Journal’s calculation of 25.7x. (Clearly, they’ve no idea what’s coming). Again cue Kansas Joe & Memphis Minnie: ![]() “When the Levee Breaks”
“When the Levee Breaks”![]() –[’29], (yes really, the “crash” year).
–[’29], (yes really, the “crash” year).
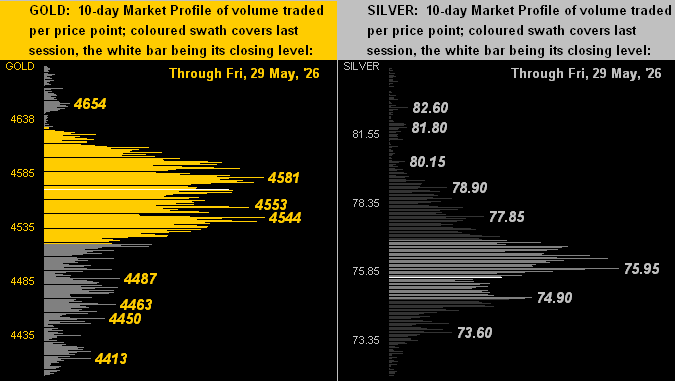
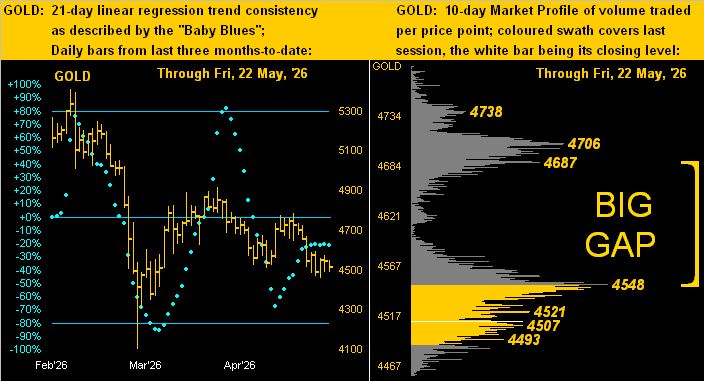
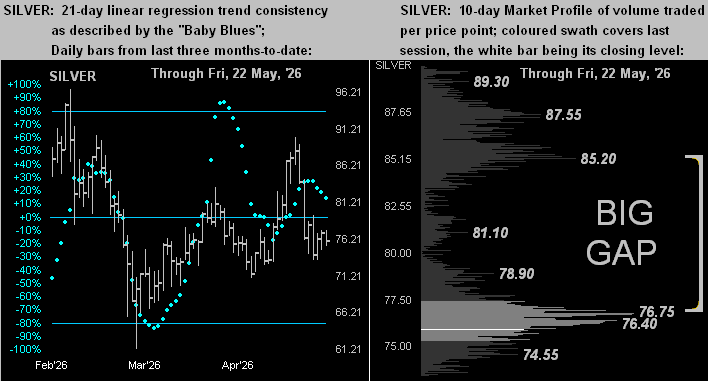
Coming here are the 10-day Market Profiles for Gold on the left and for Silver on the right. Recall a week ago the large pricing Profile gaps for both precious metals, each having since fallen beneath those respective zones. Today, both the yellow and white metals are trading within their most volume-dominant price areas of the past two weeks:
Thus we’ve Golden gyrations and irksome inflation. Might better guidance be obtained from next week’s batch of thirteen incoming Econ Baro metrics, which include a purported slowing in StateSide Payrolls for May? And what about that S&P 500 price/earnings ratio now at a full 50.0x? The Index is now 36 consecutive trading days “textbook overbought”, indeed “extremely” so per Friday’s record high (7599). Regardless…

Hang on to your Gold!
Cheers!
…m…
www.TheGoldUpdate.com
www.deMeadville.com
and now on “X”: @deMeadvillePro
29 May 2026 – 08:37 Central Euro Time
Oil is presently the only BEGOS Market outside (below) today’s Neutral Zone; volatility for the session is light. Yesterday’s “core” PCE for April was sufficiently “Fed-friendly” that the FOMC likely sit on their hands come the 17 June Policy Statement, even as other inflation measures support a FedFunds rate increase: more tomorrow in the 863rd consecutive Saturday edition of the Gold Update. Looking in real-time at the five primary BEGOS components’ Market Values, we’ve: the Bond just -0^23 points “low” beneath its smooth valuation line, the Euro -0.012 points “low”, Gold -163 points “low”, Oil -11.19 points “low, and the Spoo +411 points “high”. The “live” (futs-adj’d) P/E of the S&P is 49.6x and the yield 1.091% vs. the annualized 3mo T-Bill’s 3.590%. The Econ Baro concludes its week with May’s Chi PMI.
28 May 2026 – 08:47 Central Euro Time
Oil is the only BEGOS Market at present above its Neutral Zone for today; below same are the Bond, Euro, Gold, Silver and the Spoo; session volatility is moderate-to-robust, Gold notably having already traded 107% of its EDTR. At Market Trends, the “Baby Blues” of linreg consistency are in decline for every BEGOS component except for the Bond; those for the Spoo barely are falling, yet remain above the key +80% axis, (their actual level in real-time is +82% after having been as high as +93% last week). The S&P 500 established a marginal record closing high yesterday (7520), albeit the intra-day high was not a record. A bevy of incoming metrics arrive today for the Econ Baro, including the first revision to Q1’s GDP, plus April’s Durable Orders, New Home Sales, Personal Income/Spending and the “Fed-Favoured” PCE inflation gauge.
27 May 2026 – 08:43 Central Euro Time
The Bond is the only BEGOS Market at present above its Neutral Zone for today; below same are Gold, Silver and Oil, and session volatility is light. Yesterday, the S&P 500 made both record intra-day (7539) and closing (7519) highs: the Index is now “textbook overbought” through the last 33 consecutive trading days, and the “live” (futs-adj’d) P/E at this instant is 49.1x. The Spoo’s “Baby Blues” of linreg “consistency” have barely been treading water these last several days just above +80%, which we continue to mind for a breakdown toward lower price levels; the Spoo’s best Market Rhythm for pure swing consistency has been (on a 10-test basis) its 2hr Price Oscillator and (on a 24-test basis) its 2hr Parabolics. Cac volume for Gold is rolling from June into that for August with +33 points of fresh premium, whilst that for the Bond is rolling from June into September at a -0^16 points discount. Nothing is due today for the Econ Baro ahead of tomorrow’s “Fed-Favoured” PCE inflation gauge for April.
26 May 2026 – 08:41 Central Euro Time
The two-day session for the BEGOS Markets continues, the Spoo still poised to pull the S&P 500 up to a record high were it to open at this instant, albeit not as robustly so as we saw 24 hours ago; the Spoo is now some -30 points off its intrasession high of 7570. The Metals Triumvirate has all its elements back inside today’s Neutral Zones, while still above same are the Bond, Euro and Spoo; Oil -5.2% remains beneath its Neutral Zone. Overall session volatility still is moderate for the two days combined. The Bond and Oil continue being the best two correlated (negative) of the five primary BEGOS components, although there is firm positive correlation between the Euro and Gold. 10 incoming metrics are due for the Econ Baro as the week unfolds, beginning today with Consumer Confidence for May.
25 May 2026 – 08:49 Central Euro Time
The Spoo has reached an all-time high this morning at 7565, spurred (’tis said) by a potential two-month ceasefire in the USA/IRN war. StateSide (Memorial Day) and EuroSide (Pentecost) physical bourses are closed; however were the S&P 500 to open at this instant, ‘twould so do at a record high 7543. The BEGOS Markets are all trading for Tuesday settlement, six of the eight at present above their Neutral Zones for the session, the two exceptions being Copper (within) and Oil (below), the latter being the largest mover thus far -5.7% at 91.47; volatility is moderate. The Gold Update graphically depicts both precious metals as being in year-to-date linear regression downtrends even as record highs were established back in late January. Q1 Earnings Season has concluded with 80% of S&P reporting constituents having bettered their bottom lines from Q1 a year ago; ex-COVID recovery, this Q1 was the best quarter for year-over-year percentage of improved constituents since Q3 of 2018. There are holiday trading halts for the Bond and Spoo at 17:00 GMT, and for the Metals and Oil at 18:30 GMT; the Currencies go the distance to 21:00 GMT.
The Gold Update: No. 862 – (23 May 2026) – “Precious Metals Prices Perspectives”

To close, regular readers well-know that because we duly track inflation, we’ve suggested for a couple of years now that the Federal Reserve’s Open Market Committee really should raise their Bank’s Funds rate. Yet finally, some in the trading world also are starting to realize same. Welcome aboard, to wit this phrase reported yesterday, (hat-tip Bloomy): “Bond traders are fully pricing in an interest-rate hike by the [behind the curve] Federal Reserve this year.” And within next week’s mix of incoming Econ Baro metrics is the “Fed-favoured” inflation gauge of Personal Consumption Expenditures for April: annualizing its consensus for both the “headline” and “core” numbers continues to state inflation as well above the Fed’s +2% target. So just how shall the FOMC’s 17 June Policy Statement read?
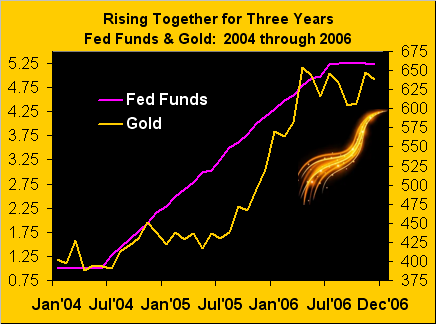
Stay perspectively tuned, and (in the spirit of aforementioned 2004-2006) your Gold holdings unpruned!
Cheers!
…m…
www.TheGoldUpdate.com
www.deMeadville.com
and now on “X”: @deMeadvillePro