The Gold Update: No. 716 – (05 August 2023) – “Gold is Always AAA; the USA? uhhhhh….”

The Gold Update by Mark Mead Baillie — 716th Edition — Monte-Carlo — 05 August 2023 (published each Saturday) — www.deMeadville.com

Gold is Always AAA; the USA? uhhhhh….

We’ll get underway with our title’s “uhhhh….” 

To which you wily readers weren’t surprised a wit this past Tuesday upon “Forever First Fitch” downgrading the credit rating of the dear ol’ USA from AAA to AA+.  For as herein penned 10 weeks ago (on 27 May):  Rating agency Fitch (which always figures to be first) is said to be ‘considering’ a downgrade of its StateSide credit rating.”

‘Course in classic Rodney Dangerfield empathy, Fitch initially “got no respect”, the S&P 500 back then blowing off any threat of a StateSide downgrade by instead rising +9.6% right through this past Tuesday.  But late that day suddenly appeared the actual downgrade and the S&P Futures immediately lopped off -26 points (basically a whole day’s range of S&P Index trading) in just two minutes.  Further on Wednesday, Fitch too cut Fannie and Freddie.  “Oh no, say it ain’t so!”  

Either way, Fitch justified the credit rating cut given an “erosion of governance”, toward which the Secretary of the Treasury took umbrage, Old Yeller disparaging the downgrade as both ‘‘puzzling” and moreover “unwarranted”.  Still at long last, “It all going wrong” may be more materially underway.  Duly noted however (for the present) it remains to be seen if raters Moody’s and S&P follow Fitch (as on occasion is their wont).  We’ll wax a bit further on the state of the stock market, but next let’s go to our title’s “AAA” for Gold!

Now as we cautioned a week ago, Gold’s COMEX contract volume has since rolled from August into December as is the norm at this time of year. Yet ever so noticeable this time ’round was the +40 points of (already eroding) premium of December over August (for the storage cost rationale we’ve previously detailed), the older contract going out as usual essentially at “spot”.

Thus in charting Gold’s “continuous contract”, price has the appearance of having gained +19 points (+1.0%) by the weekly bars, whereas in reality price instead dropped -22 points (-1.1%) settling yesterday (Friday) at 1943 vs. December’s 1978.  Regardless, one might deem that 35-point difference as “noise” given Gold’s “expected weekly trading range” is now 52 points.

Still, Smart Alec may be tempted to Short the futures at 1978 on the vapid assumption that Gold shan’t go anywhere these next several months such as to collect 35 points of ShortSide profit (which at $100/pt/cac on 100 contracts would net Alec a profit of $350k).  Our view, ‘natch, is that Gold shall go the other way (i.e. up) and ’twill be Alec that shan’t have gone anywhere but down, (let alone be around anymore).  But the weekly bars certainly shall be.  Here they are from one year ago-to-date, with the “spot” change as also noted:

And even as you WestPalmBeachers down there can figure, with Gold now (1978) just 18 points below the ensuing week’s flip-to-long level (1996), that 52-point weekly range expectation can easily get us there.  Yet, ’tis critical that we be fair:  through the past trading month (21 days), both Gold and the S&P 500 have been in positive directional correlation (i.e. moving both up and down together) as too have been both the Bond and the Euro; indeed Oil is the only primary BEGOS Market (Bond / Euro / Gold / Oil / S&P) that has wandered up-and-away from that bunch.  Still, such notion puts us in mind of 2008’s “Black Swan” when all five primary BEGOS components simultaneously suffered (the least so the Bond and Gold).  The point is:  if the S&P has put in its high for this year (4607), as it continues to tumble, shall Gold so ride astride, or ideally move up against the tide?  We think broadly the latter will out, but for the present, here are the percentage tracks of Gold and the S&P 500 from one month ago-to-date:

As to the StateSide economy, this past week’s set of 13 incoming metrics for the Economic Barometer was nearly a replay of the week prior.  Six metrics improved, six worsened, and one was “unch”.  Thus the Baro looks stuck in a crunch:

And no, Pinocchio, the Baro does not lie, albeit we oft wonder about the jobs data.  Wednesday’s ADP Employment report for the rate of job growth in July declined by -29% (from June’s 455k to 324k) whereas come Friday, Labor’s Payrolls rate increased by +1% (from June’s 185k to 187k).  Again as we oft quip, it depends upon who’s crunching what.  Too for June, the Factory Orders rate did well (from +0.4% to +2.3%) … but the rate of Construction Spending fell (from +1.0% to +0.5%).

And now just beginning to fall is the stock market.  As we tweeted (@deMeadvillePro) this past  Wednesday:  “Following a streak of 41 consecutive trading sessions as “textbook overbought”, the S&P finally is coming off a bit.  (The record across the past 44 years is 59 days).  Seeking initially Spoo 4455 on this downleg.” (The “Spoo” is the long-beloved nickname for the S&P 500 futures contract).  And ’tis well on its way toward the noted level from the past week’s high (4635), having settled yesterday at 4498.  Other in-house measures suggest the 4300s.  And then more broadly there’s this:

Ahh, the P/E’s ‘inevitable’ (as you would say) reversion to the mean, eh mmb?

Spot-on steady you are, Squire.  Since instituting the honestly-calculated “live” price/earnings ratio of the S&P 500 a decade ago, you clearly can see the P/E (green) always reverts to its evolving average (red).  Let’s too be honest about the “E”:  thus far in Q2 Earnings Season, some 80% of S&P 500 constituents have reported, their combined capitalization-weighted EPS increase from a year ago being +6%, a respectable gain fairly in line with the rate of inflation (of which the stock market is a hedge).  The problem remains that stock prices collectively indexed per the S&P 500 — vis-à-vis earnings — are terrifically expensive, especially given the positive interest rate environment, (such extreme risk variance upon which herein we’ve gone on ad nauseam).

Nevertheless with respect to the above P/E graphic, let’s do the foreboding math (a rarity in financial management these days).  The “live” P/E today is 54.9x, varying vastly from your stockbroker parroting that “it’s twenty-something”.  The evolving average is 40.3x.  Thus to bring the “P” in line with the “E”:  the reversion calls for an S&P 500 price “correction” from today’s 4478 down to 3290, (i.e. -27%). As well — rightly or wrongly — we’d written earlier in the year for the S&P perchance to reach sub-3000; or as our initial reader (one J.G.S.) from the inception of The Gold Update quipped away back in 2009:  “There’s always the overshoot”.  And by the above graphic, indeed there regularly is negative overshoot down through the red line.

Further we again remind:  had COVID never occurred such that the money supply had never ballooned, the top of the S&P 500’s 50-year regression channel today would be 2800.  Isn’t math wonderful?

As for the usually “rah-rah for ratings” FinMedia, we credit Bloomy with having come ’round to reality a bit, their headlining this past Tuesday that “Stocks pull back from July rally on weak earnings”, albeit we did ask ourselves for the bazillionth time “They’re just figuring this out now?”  ‘Tis why we maintain the Earnings Season page at the website, which deep into Q2 results shows 50% of some 1,400 reporting companies having beaten their bottom lines from a year ago … which means 50% have not so done, (just in case you’re scoring at home).

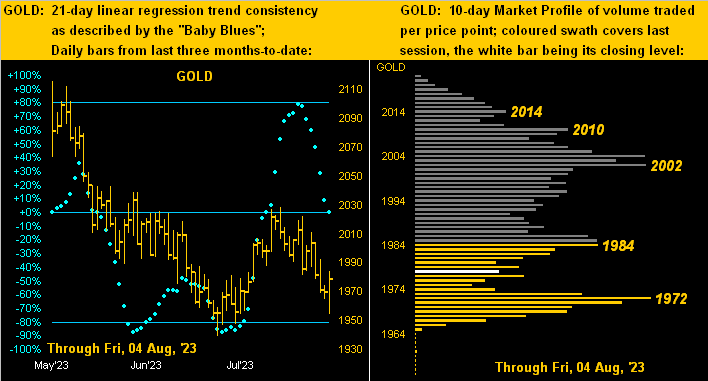
Let’s next move on to assess Gold’s scoring via the following two-panel graphic of the daily bars from three months ago-to-date on the left and 10-day Market Profile on the right.  (Note:  both panels are fully in December contract pricing; to view the effect of the aforementioned 40-point premium gap, please see the website’s page for either “Gold” or for “Market Trends”).  Either way, yesterday Gold was well in play as you can see by its rightmost daily bar, even as the baby blue dots of regression trend consistency continue to descend.  As for the Profile, the most dominantly-traded price in December terms for the past fortnight is that 1972 supporter, the overhead resistors as also labeled.  And yes, Virginia, by the December contract, Gold in the past two weeks has traded to as high as 2022, just 67 points below the 2089 All-Time High from basically three years ago to the day (07 August 2020):

The like setup is much the same for Silver, her declining “Baby Blues” (at left) nearly identical to those for Gold; and as for her Profile support (at right), Sweet Sister Silver is sitting right on it at 23.70:

Peering into next week, the more generic (i.e. less Fed-favoured) July inflation data takes center stage.  And by consensus at the retail CPI level, the headline number is again expected to be +0.2% with the core rising to +0.3%; and at the wholesale PPI level, both the headline and core numbers are expected to increase from June’s +0.1% to +0.2%. In other words: “expectations” are that inflation shall not have slowed but instead picked up during July.  And stocks still are way too high.  And the Econ Baro is hinting goodbye.  And the StateSide credit rating has gone awry.  To quote the late, likeable sports broadcaster Dick Enberg:  “Oh my!”

And thus the bottom line for today:

Don’t become “fitched to be tied” like the USA; go with AAA Gold all the way!

Cheers!

…m…

www.TheGoldUpdate.com
www.deMeadville.com
and now on Twitter:  @deMeadvillePro