The Gold Update: No.709 (17 June 2023) – Fed Doing Cruise Control; Gold Doing Donuts; S&P Doing Wheelies!

The Gold Update by Mark Mead Baillie — 709th Edition — Monte-Carlo — 17 June 2023 (published each Saturday) — www.deMeadville.com

Fed Doing Cruise Control; Gold Doing Donuts; S&P Doing Wheelies!

The title to this week’s missive pretty much puts it all in perspective.  And to the extent this week’s closing bit spooks you from stocks is your own cash management decision.  Nonetheless, let’s start with this triple-shot:

The Fed:  As tweeted on Wednesday (@deMeadvillePro) we were wrong in anticipating the Federal Open Market Commmitee would raise their Bank’s Funds Rate this past Wednesday by +0.25% in accordance with their favoured inflation gauge (“Core PCE Index”) having registered on 26 May an annualized pace of +4%.  Instead, the FOMC unanimously voted to “pause” in cruise control at the 5.00%-5.25% FedFunds target range previously established back in their 03 May Policy Statement.  And again, “unanimously”?  To us, that was an even bigger surprise than the “pause”, as FOMC interviewees in the weeks leading up to this most recent meeting clearly indicated dissent amongst their ranks.  Yet at the end of the day toward emphasizing unity, these birds of disproportionate feather flocked together.  Or as one very wise chap would remind us:  “Don’t listen to what they say; look at what they do.”  And thus 4% inflation has become the new targeted 2%.

“Except they’re gonna keep raising anyway, mmb…”

Indeed as so inferred, Squire.  Let’s see what actually happens given the Economic Barometer has suddenly resumed freefall as we’ll herein install.

Gold:  Obviously the yellow metal is doing donuts. ‘Round and ’round goes Gold without going anywhere.  For a fourth consecutive week, the 1986-1955 range (by the current August contract) was therein traded.  Price then settled its week yesterday (Friday) per the above Gold Scoreboard at 1971, such level first achieved nearly three years ago (28 July 2020) as COVID unfolded.  Since then, the U.S. Money Supply (“M2”) has increased by as much as 22% … but not so Gold.  And as we’ll below see, the weekly parabolic trend remains Short.

S&P 500:  Be it fundamentally and/or technically, this mighty “best of the best” stock market index is so vastly overvalued we could compose an entire multi-chapter tome through which to comb.  Yet in this new paradigm of “earnings” no longer being relevant — and as further boosted by the market-friendly FinMedia proclaiming the new bull market has just begun — ’tis stock wheelies all the way, day after day.  (Or rather, might it be doomsday per that presented toward this missive’s finale…)

Thus with your attention aroused, ’tis on to the vetting, beginning with the current state of the Econ Baro and its frustrations being foisted on the Fed:

As herein penned a week ago “…it appears the Baro may further take a bit of a dip…”  And now with the benefit of hindsight the word “whack” would have been more appropriate.  The Baro was hit this past week with a whopping 16 metrics.  Period-over-period, 10 were worse, including those for June’s Philly Fed Index — which has now been negative for 10 consecutive months — May’s Retail Sales, Capacity Utilization, and Industrial Production — the latter actually having shrunk — and a bloating of April’s Business Inventories.  The only two notable positives were June’s New York State Empire Index going from a strong negative reading to one mildly positive, and The University of Michigan’s “Go Blue!” Sentiment Survey — the latter sporting its second-best year-to-date reading — and thus indicative that everything’s misinformedly great again.  (P.S. How’s that “live” S&P 500 price/earnings ratio now 54.8x gonna work out for ya?  Do keep reading…)

Meanwhile specific to Gold, its still refusing to be bold finds it in fairly stuck mode.  Here are the weekly bars from one year ago-to-date.  Given that the red-dotted parabolic Short trend is now four weeks in duration, the good news is that price has not (yet?) succumbed.  Again, we’re warily eyeing the low 1900s on this run, (indeed by spot ’round 1893), but we’ll gladly accept avoiding such downside spree.  (Jeepers, Squire, did you have to go with the red glaze?)

More broadly, we next go back to view Gold’s daily closing price through this tried-and-true graphic extending back a dozen years astride the 300-day moving average.  And again at right from 2020-to-date is that infamous triple-top temptingly awaiting transcendency:

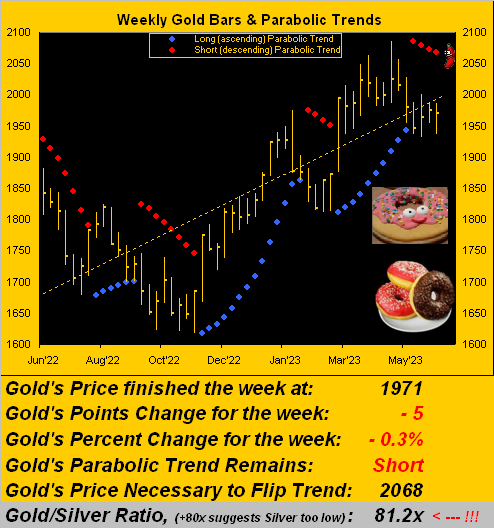
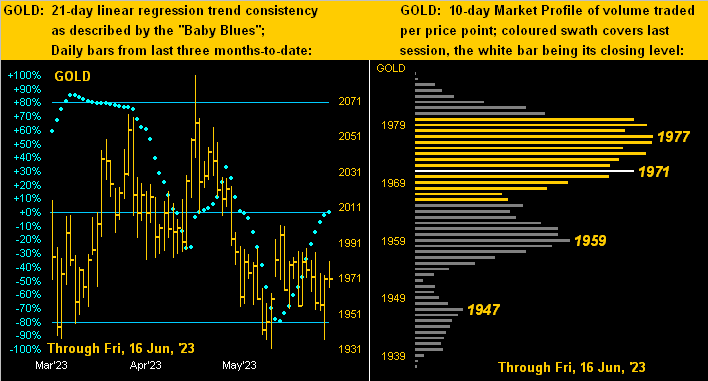
Next let’s go more to The Now with Gold’s two-panel graphic featuring the daily bars from three months ago-to-date on the left and 10-day Market Profile on the right.  And with respect to Gold’s “Baby Blues” of regression trend consistency, they’ve recovered up to their 0% axis meaning that price across the past 21 trading days (i.e. one month) has essentially been trendless.  That fits well in thus describing Gold as doing donuts, indeed to reprise one of our favourite musical analogies  “Goin’ Nowhere” –[Chris Isaac, ’95].  As to the Profile, price at present is up against more trading resistance than underlying buoyancy:

Too for Silver — and similar to that which we saw a week ago — she’s been modestly outpacing Gold to the upside, her “Baby Blues” (below left) indicative of a mild uptrend, whilst her Profile (below right) is a bit more supportive in appearance than for Gold’s like panel.  Indeed with the Gold/Silver ratio today at 81.2x, were it instead at its century-to-date average of 67.6x (with Gold at the present 1971 level), Silver would now be +17% higher than her current 24.27 level at 29.17.  Do not forget Sister Silver:

Now in saving the best — or arguably the worst if not the most frightening — for last, we again turn to the S&P 500.  To say it is “overbought” is formidably understated.  ‘Tis terrifyingly so.  To wit:

First fundamentally:  in this Investing Age of Stoopid where earnings as aforementioned are comprehensively disregarded, money is nevertheless being thrown at the stock market, (see the website’s MoneyFlow page).  ‘Tis the Pavlovian Response of this go-go era, where “‘Tis always up and nothing but!”  After all, as duly noted, we’re told the new bull market is just underway.  So why does the S&P feel to us as if we’re back on 25 August 1987 or 20 July 1998 or 24 March 2000 or 11 October 2007 or 19 February 2020?  (Warning:  if you lack firm intestinal fortitude, do not go back and look at the S&P from those dates).  We’ve already mentioned the accurately and honestly calculated “live” p/e of the S&P is now 54.8x.  Yet since today’s parrots are apparently inept at performing mathematics, they just say “‘Tis 20-something”.  (And many of them may be managing your money).  A couple of critical examples:  the fourth-largest stock in the S&P 500 is Nvidia; its p/e is 220.4x. What that means for you WestPalmBeachers down there is that today for this “must have AI stock” you’ll effectively pay $220 for something that earns $1.  How about for the S&P’s third-largest stock:  ’tis called Amazon.  Its p/e is 299.5x, meaning today you’ll effectively pay $300 for something that earns $1.  “Yeah, ya gotta own ’em.”  We’d rather cover the dozens and columns at the roulette wheel:  ’tis just safer, as is the risk-free (for now) U.S. T-Bill’s annualized yield of 5.065%.

Second technically:  the following graphic is scary, so if ya can’t suck it up, ’tis best move on from this page.  As you valued website perusers know, we’ve a page at the website called Market Values born of that referred to as BEGOS (Bond, Euro, Gold, Oil, S&P 500) and their critically important price-leading valuations.  Ready?  At this writing, the S&P 500 Futures contract (4459) settled yesterday an unconscionable +329 points by the green line above its smooth valuation line as shown here:

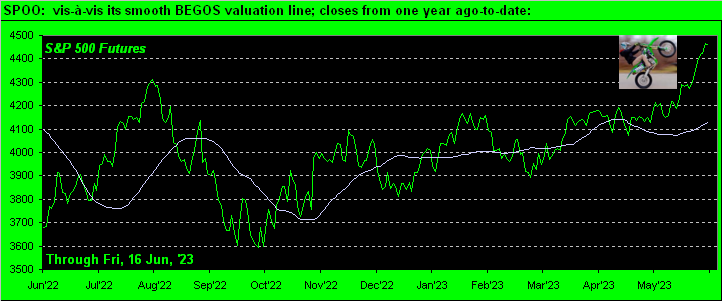
The last time we had such an extreme deviation?  ‘Tis right there in August of a year ago.  And quick as  a wit, the S&P plummeted in mere weeks from 4300 to 3600 (-16%) by September’s end.

But wait, there’s more:  upon our “live” p/e of the S&P reverting to its mean (as historically has always happened) given there being hardly any growth in real earnings (“What are those?”), that mathematically calls for S&P 3300 (or -25% from here).  But that’s just to the “live” mean, (which has evolved by the day since 2013).  For then comes the overshoot, et voilà, we see S&P sub-3000 (or at least -32% from here) as we’ve already on occasion mentioned this year.  ‘Course — again historically — the market always comes all the way back.  It merely depends on how many years or in some cases decades you’re willing to wait.
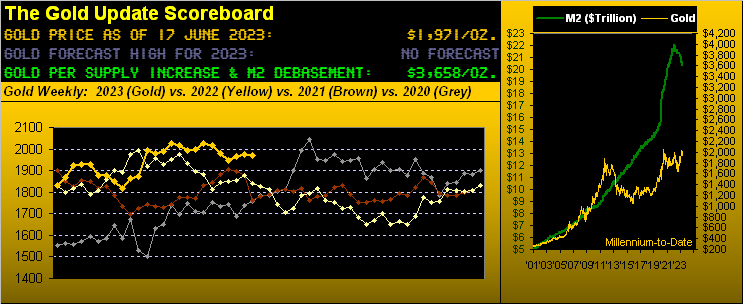
Still, we can end on a high note:  BUY GOLD!  Especially given its being priced today (1971) at just 54% of its true debasement valuation (3658)!

Cheers!

…m…

www.TheGoldUpdate.com
www.deMeadville.com
and now on Twitter:  @deMeadvillePro