The Gold Update: No. 744 – (17 February 2024) – “More Gold Slippin’ as Inflation Renews Rippin’”

The Gold Update by Mark Mead Baillie — 744th Edition — Monte-Carlo — 17 February 2024 (published each Saturday) — www.deMeadville.com

More Gold Slippin’ as Inflation Renews Rippin’

We yet again reprise that from this year’s first edition of The Gold Update:

“…But in seeing the Dollar take flight to start this year — indeed recovering a 10-day losing streak in just the first two days of 2024 — along with the Bond’s fresh demise as yields rise, might renewed inflation be taking first prize?  In other words:  what if the Fed instead tightens … surprise!…”

At that 06 January writing:

  • The Dollar Index was 102.155; ‘tis now 104.195;
  • The U.S. Treasury average product yield (30yr, 10yr, 5yr, 3mo) was 4.368%; ‘tis now 4.564%.

And now just in this past week on January’s renewed inflation front:

  • Core retail inflation (CPI) was +0.4% (+4.8% annualized pace), a 9-month high;
  • Core wholesale inflation (PPI) was +0.5% (+6.0% annualized pace), a 21-month high;
  • And both headline numbers (CPI & PPI) were +0.3% (+3.6% annualized paces), to 4-month highs.

‘Course, the FinMedia anticipates rate cuts, for as we’ve written, the tongue-in-cheek optic is:  as says the media, so does the Federal Reserve, (the political characterization touted as whatever it takes to maintain the present balance of power in Washington DC).  However:  the declining Treasury market says otherwise; and historically, ’tis the market that leads the Fed.

 “So mmb, is it your prediction that the Fed is actually going to have to raise rates?

Not a prediction, Squire; rather a mathematically valid observation.  Obviously the January inflation data (arguably aberrational) went the wrong way.  Albeit in the Fed’s favour, the 12-month summations of inflation at the wholesale level are duly below the +2% target; but at the retail level ’tis +3% headline and nearly +4% core, both a fair piece above +2%: and that’s on the consumer, who makes up some 70% of the Stateside economic engine.  Thus to cool that overheated engine, the Federal Reserve’s Open Market Committee at some point may actually be compelled to again vote to raise rates.  That’s just the way it works.  Here it all is graphically from one year ago-to-date, the four panels identically scaled for comparable context and the Fed’s +2% target as each red axis.  Note:  the annualized (blue line) levels in all four cases for January are well-above such +2% target:

‘Course, January’s missing puzzle piece at present is Personal Consumption Expenditures Prices, such “Fed-favoured” data not due until 29 February; (the subsequent FOMC Policy Statement is not scheduled until 20 March).  Thus whilst we wait, let’s check Gold’s gait.

Fundamentally, Gold (at least by conventional wisdom) can have its nerves stir should a rate scare impair.  To wit, price settled the week yesterday (Friday) at 2026; ’twas Gold’s fifth losing week of the past seven — and admittedly — most of our missives year-to-date have had a negative near-term price bias.  Thus hardly is Gold’s -5.9% net run down from its 2152 All-Time High (04 December) that unexpected.

Technically, and indeed expectedly, Gold’s weekly parabolic trend — following a 17-week Long streak — finally succumbed to Short as confirmed at yesterday’s close.  Per the following chart of Gold’s weekly bars from one year ago-to-date, the rightmost encircled red dot now implicates testing of the underlying green-bounded support structure (2020-1936), the low this past week already having reached down to 1996:

So as a fresh parabolic Short trend commences, the burning question invariably is “How low shall price go?”  Whilst nobody knows, our best sense is the aforeshown 2020-1936 support structure not only shan’t bust, but shall not be that deeply penetrated.  The maximum downside adversity of the past three such Short trends was respectively just -41, -46, and again -41 points, which if replicated from the present 2026 level would find Gold reaching no worse than 1985-1980.  Still in more broadly reviewing the past 10 Short trends, the maximum median adversity was -78 points (if replicated, to 1947 from here) and the maximum average adversity -103 points (if replicated, to 1923 from here, which would improbably be beyond the support structure). ‘Course with Gold by the opening Scoreboard’s valuation at 3739, any near-term decline can merely be viewed as noise — and depending on one’s cash management parameters — an opportunity to add to one’s pile..

Speaking of piling up, this past week brought 19 metrics into the Economic Barometer (2 more than we’d originally stated per our prior missive).  Without combing back through the Baro’s 27 calendar years of data, ’twas the largest pile for a single week in memory.  And therein, 11 of the metrics improved period-over-period, including the CPI and PPI data.  Remember:  increasing inflation nominally is an Econ Baro positive per the principle of “the rising tide of inflation lifts all boats.”  Why even February’s Philly Fed Index posted a gain for just the second time in the past 18 months … “Stop the presses!”  Still, there were some stinkers, notably featuring shrinkage in January’s Industrial Production and Retail Sales, (the latter subject to natural post-holiday belt-tightening), and the month’s Business Inventories having backed up.  But all-in-all, the Baro ratcheted up a bit more in our year-over-year picture:


Meanwhile, the S&P 500 (red line across the Econ Baro) through 33 trading days thus far in 2024 has made all-time highs (the latest being 5048) within 13 of those sessions.  Priced today at 5006, the “live” price/earnings ratio of this “Casino 500” settled the week at 47.5x, vastly beyond the internet “parroted” version of 27.6x.  Why the difference?  The latter version (whilst rightly using “trailing 12-month earnings”) includes “negative p/e ratios” and is unweighted.  The latter version thus is cheating.  As to the current Casino market cap of $43.7T, the liquid money supply (U.S. “M2”) of $21.0T covers only 48% of that; (just something to consider should you sell your stock at the same time as does everyone else).

And still to this day, “everyone else” doesn’t own any Gold, (or so we’re told).  Some say less than one percent of the investing public hold Gold, although in querying AI (Assembled Inaccuracy), it “says” that “10%-15% of managed portfolios” have some (likely indirect) exposure to Gold, even as price trades some -46% below the aforementioned Scoreboard valuation.  But for you WestPalmBeachers down there, why underpay for Gold when you can overpay for the Casino 500?  (Just a passing thought).

Passing through lower price levels somewhat of late has been Gold.  Here next we’ve the two-panel chart of Gold’s daily bars from three months ago-to-date on the left and those for Silver on the right.  In both cases, the baby blue dots of regression trend consistency are, on balance, depicting lack thereof:

Then, too, we’ve the 10-day Market Profiles for the yellow metal (below left) and white metal (below right).  Of interest is the high level of Silver in her Profile versus Gold’s more midrange position.  Indeed as noted earlier in Gold’s weekly bars graphic, the Gold/Silver ratio now at 86.3x is its lowest reading year-to-date.  However:  the century-to-date average being 68.1x, were Silver to rise (and Gold to stay fixed) such as to bring the ratio down to that average, price would be 29.76, a sizable +21% above today’s 23.48 level, (just in case you’re scoring at home):

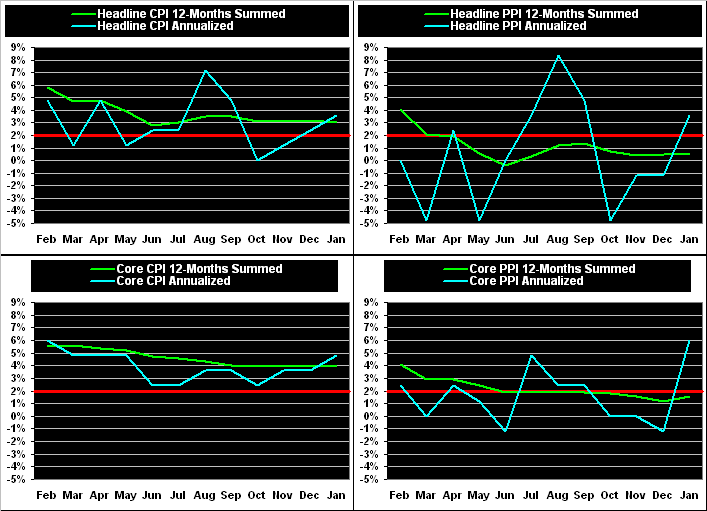
We’ll close with this absurd deception from the rather desperate “It’s All Good!” FinMedia.  (Ensure you’re not sipping your favourite beverage, lest it spew from your nose given uncontrollable laughter).  Following Tuesday’s release of renewed retail inflation per the CPI, floundering CNN Business ran with this headline, (put your glass down…):  “Good News for Americans:  Inflation cooled back down in January”.  Again, the CPI’s pace increased from +0.2% in December to +0.3%, and its core reading from +0.3% to 0.4%.  Cool, baby.

Cheers!  (And don’t forget the Gold!)

 …m…

www.TheGoldUpdate.com
www.deMeadville.com
and now on “X”:  @deMeadvillePro