The Gold Update: No. 731 – (18 November 2023) – “Gold Pops as Inflation Stops and the Economy Flops”

The Gold Update by Mark Mead Baillie — 731st Edition — Monte-Carlo — 18 November 2023 (published each Saturday) — www.deMeadville.com

Gold Pops as Inflation Stops and the Economy Flops

Some 40 years ago per advertising billboards for the evening blatt known as the San Francisco Examiner:  “A lot can happen between 9 and 5”.  And relative to just this past week, ’tis perfectly analogous to the state of Gold, Inflation and the Economy:  “A lot can happen between Monday and Friday”.  To wit for the week:

  • Gold above support spritely popped;
  • Inflation (FinMedia’s take) abruptly stopped;
  • The StateSide economy frightfully flopped.

Just like that.  “Who knew?”

Perhaps our neighbour knew in walking past us mid-week with just a single word uttered our way:  “3000”.

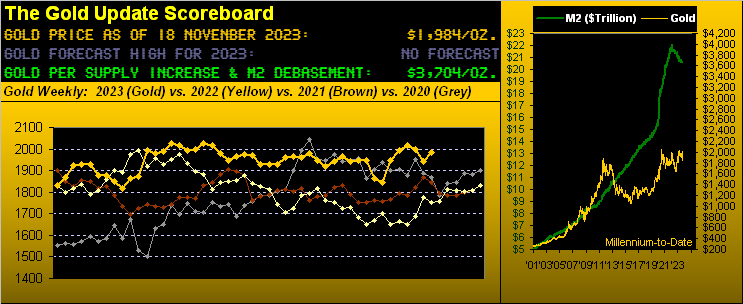
Great to hear some Gold awareness there, even as price settled the week yesterday (Friday) at 1984.  Yet per the above Gold Scoreboard, the yellow metal’s Dollar debasement value is 3704.  At least somebody’s paying attention.

Or (oui, c’est ‘Gold’ en français):  was the utterance of “3000” instead a reference to valuing the S&P 500, itself now 4514?  The inevitable reversion of the Index’s honestly calculated price/earnings ratio (43.8x “live”) to our historical 66-year mean (22.7x incorporating Bob Shiller’s CAPE pre-2013) brings the S&P well sub-3000.  Further, we’ve on occasion herein graphically depicted that were it not for the massive monetary infusion to counter COVID, the S&P by our 50-year regression channel would today be in the high 2000s, a level otherwise gratefully accepted by the investing community had there been no pandemic monetary response.  Just a few things to make one go “hmmm…”

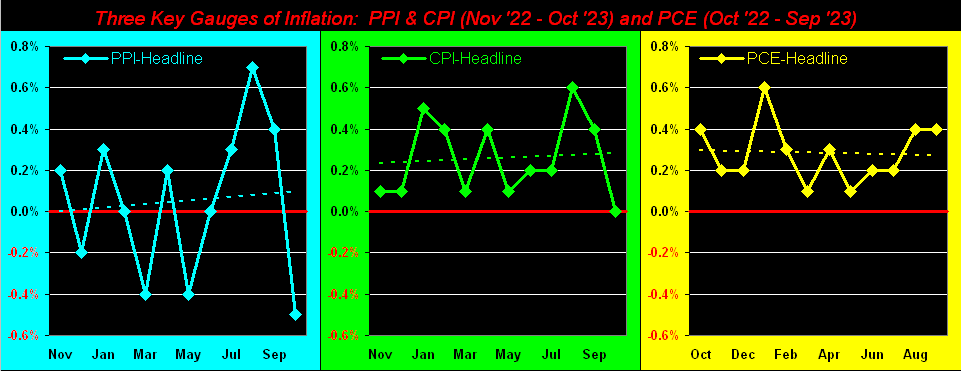
Regardless, let’s break down Gold’s pop, inflation’s stop, and the economy’s flop.

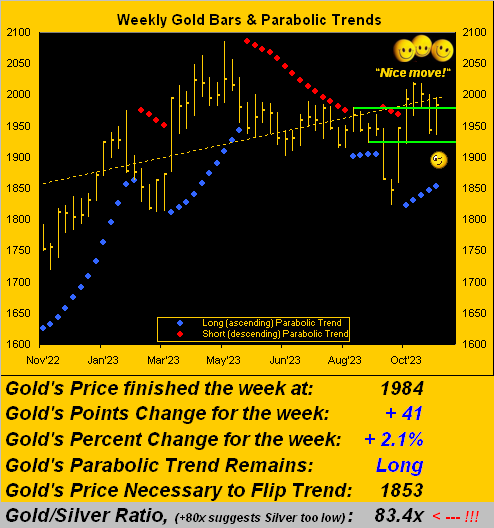
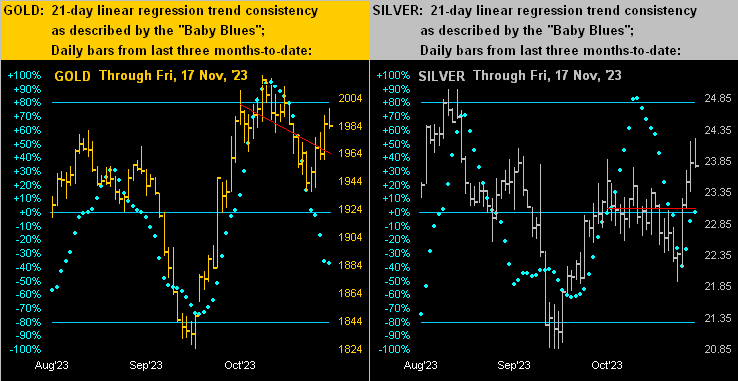
Gold’s pop:  per the opening bullet point, this past week saw Gold pop back and settle above the green 1980-1922 support zone, price as noted now 1984, the week’s high en route being 1996 (i.e. just 93 points below the 07 August 2020 All-Time High of 2089).  To Gold’s weekly bars from one year ago-to-date we go, the blue-dotted parabolic Long trend firmly in place with a lot of underlying safe space:

Moreover, we see by Gold’s monthly bars a Moneyflow “Buy” signal:  whilst not a formal recommendation, ’tis worth consideration.  The following chart shows a wee chap at lower right extolling said signal.  This is because the green Moneyflow track has crossed above the double-center line.  Across the past 28 calendar years, this up-cross has occurred 11 times.  The average maximum points follow-through is +264, but with this warning:  three of the past four such Long signals have garnered at most +50 points of additional gain … just in case you’re scoring at home.  For at the end of the day as we always say:  “Cash management is everything.”  But worth an awareness view here:

Inflation’s stop:  In concert with October’s retail inflation having come to a halt (the Consumer Price Index registering “unch”) whilst recording wholesale deflation (the Producer Price Index registering -0.5%), our FinMedia friends swiftly declared the Federal Reserve’s interest rate hikes as having come a conclusion, with cuts commencing next year.  And as you regular readers recall, our missive’s wrap two weeks back described the FinMedia’s essentially running the Fed.  So there we go.  Or do we?  

As ’tis our penchant to actually do the math, we came up with the following three-panel graphic of monthly “headline” inflation reports from a year ago-to-date; (note at right the Personal Consumption Expenditures report lags the PPI and CPI by one reporting month).  Our focus for each panel is the directional slope of the respective dashed regression trendlines.  Again:  “hmmm…”  For both the PPI and CPI, their slopes are rising; and their October figures are quite the deviations from the trendlines. This can imply a snap-back to the upside come the November numbers.  Too, the “core” measures (not displayed) for October are:  PPI “unch”, CPI +0.2%, and for September’s so-called “Fed-favoured” PCE +0.3%.  Let’s see with all three panels identically scaled:

Economy’s flop:  The following bit is not for the weak-of-stomach crowd; thus gird one’s loins as necessary.  Our StateSide Economic Barometer this past week got summarily skewered, as tweeted (@deMeadvillePro) Thursday evening.  Now here’s the picture from one year ago-to-date, the S&P (red line) ignoring overvaluation as the “bad news is good news” illogicity continues:

And specific to “good news”, as we’ve noted since COVID, the Econ Baro doesn’t lead the stock market as it did during the prior 22 years from 1998 into 2020.  ‘Course, the monetary injection post-Covid essentially equaled the increase in the market capitalization of the S&P 500, and we’ve thus been awash in liquidity ever since, (hat-tip “The Market Never Goes Down Dept.”)  Why, not even Moody’s — a week ago citing that U.S. credit risk “…may no longer be fully offset by the sovereign’s unique credit strengths…” — can stop the stampeding S&P. 

“But still, mmb, that’s a really big drop in the Baro…” 

‘Tis a most material drop indeed, Squire.  Since the Econ Baro’s inception back in ’98, there have been just nine other drops of this magnitude across a 12-trading day span.  All have led to fairly imminent — however not always overwhelming — price declines in the S&P.  That stated, the most recent such Baro decline occurred just over a year ago as of 22 May 2022;  then come 17 June (just 14 trading days hence), the S&P had fallen -521 points (-12.5%).  Whether that repeats — with FinMedia missives now suggesting a record S&P high is nigh (i.e. above the 4819 level achieved on 04 January 2022) — depends upon the investing whims of news followers vs. math doers.  Neither overlook that the U.S. “riskless” Three-Month T-Bill still yields an annualized 5.233% per Friday’s settle.  On verra…

Either way, at this writing the S&P 500 is “extremely textbook overbought” (based on our concoction of John Bollinger’s Bands, along with standardized Relative Strength and Stochastics) and the S&P 500 futures settled yesterday +229 points above their smooth valuation line (per the website’s Market Values page).  Too is the S&P’s aforementioned “live” P/E of 43.8x.  Recall the P/E as the S&P topped pre-DotComBomb back in March 2000?  43.2x.  Today ’tis one perpetually scary/expensive stock market.  And with Q3 Earnings Season having just ended, in collecting bottom lines for 1,860 companies, only 51% improved year-over-year.  Specific therein to 446 S&P constituents, 64% improved … but given “It’s the S&P”, should not 100% have improved?  What shall the next spin of the wheel reveal?  “Les jeux sont faits; rien ne va plus…”

Meanwhile, the next special graphic of the precious metals is our two-panel view featuring Gold’s daily bars from the last three months ago-to-date on the left and likewise for Silver on the right.  Of note are Gold’s “Baby Blues” of trend consistency having actually gone negative whilst price has risen.  This is because the 21-day red trendline has rotated to negative; we oft quip “follow the blues”, however in this case given the positive pricing track for Gold, we’re not really looking for much downside.  Indeed for Silver, her red trendline has rotated from negative to flat, hence her rightmost baby blue dot sitting on the 0% axis.  Also as penned in the Prescient Commentary this past Thursday:  “…Silver’s daily Parabolics flipped to Long effective today’s open (23.510): the average maximum follow-though of the past 10 such studies (either Long or Short) is 1.695 points…”  Therefore with respect to Gold and Silver, leave any silly Shorting ideas to Smart Alec:

As to the 10-day Market Profiles which denote prices at the most robust levels of volume, both panels below look healthy for Gold at left and Silver at right.  In fact for the white metal, her +6.6% gain for this past week (vs. +2.1% for the yellow metal) served to reduce the Gold/Silver ratio from 87.1x to 83.4x.  Still, the century-to-date ratio is 67.9x, leaving Sister Silver plenty of room to outperform Gold on the upside:

In sum, Gold again has a chance to go for an All-Time High.  The S&P by any and all rights is due for a dive (understatement).  And certainly both “ought be” similarly priced right ’round “3000” … at least if you do the math.  (What a rare concept, eh?) 

We’ll close it here with this logistical note:

Next week’s 732nd consecutive Saturday edition of The Gold Update is planned to be quite brief as we shall be “in motion”:  just straight to the point with a salient graphic or two along with our view.  In any event, don’t be a turkey, given what can ensue…

…rather, keep your eyes (and wealth) on the Golden prize clearly due!

Cheers!

 …m…

www.TheGoldUpdate.com
www.deMeadville.com
and now on Twitter(“X”):  @deMeadvillePro