The Gold Update: No. 743 – (10 February 2024) – “This is Where it All Goes Wrong (Got Gold?)”

The Gold Update by Mark Mead Baillie — 743rd Edition — Monte-Carlo — 10 February 2024 (published each Saturday) — www.deMeadville.com

This is Where it All Goes Wrong (Got Gold?)

As occasionally is our wont, we start with stocks.  And specific to the somewhat sensationalized title of it all going wrong, “This” is applicable not just to now, but realistically since mid-year 2020 upon the S&P 500’s complete recovery from its COVID collapse in returning to an already then excessively overvalued level in the low 3200s. Today, the S&P 500 (aka “Casino 500″) is at 5027, a +50.1% increase since 18 August 2020, the day the S&P reached back to where ’twas brewing prior to COVID’s undoing.

Since then with constituents’ earnings vapidly unsupportive of price — especially with safe money today earning better than 5.2% — “This” is synonymous with “Disaster”.  And yet per our S&P MoneyFlow page, dough is being thrown into the market at amounts unconscionable, two of our measures there “suggesting” the S&P ought be better than +1000 points higher than currently ’tis! You cannot make this stuff up!

In having couched the S&P’s inane overvaluation in so many ways, we’ve even written of having run out of adjectives to describe it, save for perhaps this one:  here in the small Mediterranean fishing village of Monaco, we look at across the deMeadville office table at one another and regularly say the same thing:  “The market is crazy…”

However, the good news (or if you prefer, bad news) now is that other keen analysts (i.e. with a properly functioning brain) are increasingly noting the S&P approaching dire straits.  Indeed, infamous hedgie David M. Einhorn’s comments (hat-tip Barry Ritholtz’s “Masters in Business”) this past Thursday particularly parallel our very own across many a recent missive.  To wit:

  • We’ve said:  “We’re beyond the Investing Age of Stoopid to that of Braindead”;
  • He just said:  “I view the markets as fundamentally broken”.
  • We’ve said:  “Nobody does the math anymore”;
  • He just said:  “They’re going to assume everybody else has done the work.”
  • We’ve said:  “Everybody just parrots what everybody else says”;
  • He just said:  “Passive investors have no opinion about value”.

Nuff said.  Instead, let’s get graphic.  Our best sense says “This” is where we are now with respect to the S&P 500; (for you WestPalmBeachers down there, the red line isn’t the actual S&P, but the overall shape to the top is scarily spot on):

“Uh, mmb, we just got a note from West Palm Beach requesting the actual S&P graph……

Well, why not, Squire?  The similarity is striking.  And as you regular readers recall, the red regression channel suggests the bounds for the S&P today had COVID and the subsequent monetary accommodation never happened:

To even logarithmically chart the above track of the S&P still finds present price overwhelmingly out-of-bounds, (polite understatement).

“Oh, but it’s all about the Fed lowering rates!” they say.  “Oh, but it’s all about the booming Biden economy!” they say.  “Oh, but it’s all about AI!” they say.  

We say:  the Federal Reserve has yet to tip its hand, the media are in high gear to either get the President re-elected or go with Michelle Obama, and as for Artificial Intelligence — based upon what flushes through the sewer lines of Internet — we view it more as Assembled Inaccuracy; (more on that in the wrap).

So with respect to the S&P 500 and its “live” price/earnings ratio of now 49.0x, if you’re having an Elaine Garzarelli moment, ’tis absolutely justified.  (For shame, if you have to look her up).  And the inevitable fear commensurate with the S&P’s next “correction” shall be a one-two punch:

  1. Fear of losing one’s marked-to-market millionaire status, (markets plummet); and
  2. Fear of one’s account being credited with broker IOUs, (markets shutdown).

Moving on to Gold, we find for all intents and purposes ’tis not moving; rather, ’tis yet again sleeping.  In settling yesterday (Friday) at 2039, ’twas Gold’s narrowest weekly range by points (31) since that ending two years ago on 04 February 2022; (by percentage between the high and low, ’twas the least rangy since that ending 23 December 2021).  As we’ve so stated of late, these days ’tis nothing but the Casino 500:  alternative smart investments no longer matter.

As for the chart of Gold’s weekly bars from one year ago-to-date, we see the blue-dotted parabolic Long trend still just barely there:  should 2027 trade in the new week, Gold goes bear.  That’s just 12 points of wiggle room within Gold’s expected weekly trading range of now 59 points.  Thus come Monday, Gold either gets off the schneid to the upside, else the trend flips to Short and the green-bounded structural support zone resumes being tested:

On to the ever-exciting Biden economy.  Breathtaking, non?  Have look below at the Econ Baro’s purple-highlighted uptrend streaks!  Well, maybe not … for by typical duration, this last may have run out of gas.  We’ll have a better idea in the ensuing week with 17 metrics due for the Economic Barometer, including on Tuesday retail inflation for January, the “consensus” reading for the Core CPI expected to come in at an annualized +3.6% pace.  Remember this from our opening missive in 2024?  “…might renewed inflation be taking first prize?  In other words:  what if the Fed instead tightens … surprise!”  From this side of the Pond, the European Central Bank just voiced concern over disinflation not dissipating as deftly as desired, whereas farther ’round the globe the People’s Bank of China is staring at died-in-the-wool deflation.

Adding to all that confusion came our favourite headline of the week (last Monday), courtesy of Bloomy:  “Treasuries Fall on Powell” … Ouch!  That had to have bruised, but we trust he’s ok.  Either way, here’s the Baro for now along with the goofball (technical expression) Casino 500:

In gliding toward this week’s wrap let’s briefly review sleepy Gold per the two panel graphic of daily bars from three months ago-to-date on the left and 10-day Market Profile on the right.  Gold’s “Baby Blues” of trend consistency look to be running out of upside puff, whilst per the Profile, 2052 is now the trading-volume price line in the sand:

Silver’s snapshot of same appears a bit weaker, her “Baby Blues” (at left) struggling for direction, with Profile trading support and resistance as labeled (at right):

And so to wrap with a little AI (again that’s Assembled Inaccuracy”) fun in three parts.

First and obviously not proper use of AI per se, we simply “Googled” the following question:  What is the trading profit for the past 10 swings of the S&P 500 emini futures by parabolics on three-point range candles?”  The reply was merely a slew of adverts for commodity trading firms.

Second we went to a proper AI site and identically queried:  What is the trading profit for the past 10 swings of the S&P 500 emini futures by parabolics on three-point range candles?”  The amount of verbage returned was practically endless, but finally came the reply:  Therefore, the trading profit for the past 10 swings of the S&P 500 Emini futures by parabolics on three-point range candles is $3175.”  Which is comprehensively wrong.  The correct answer is $938.

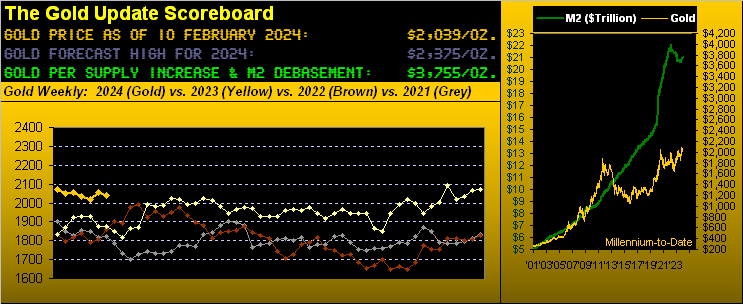
Third we thus thought:  let’s try something a little easier.  Ready? In we typed “What is the price of gold?” The reply?  As of today, the price of gold is $1,775.45 per troy ounce.”  Which again is comprehensively wrong.  The correct answer is $2024.40 (spot) or $2038.70 (futures).  Oh my, AI.

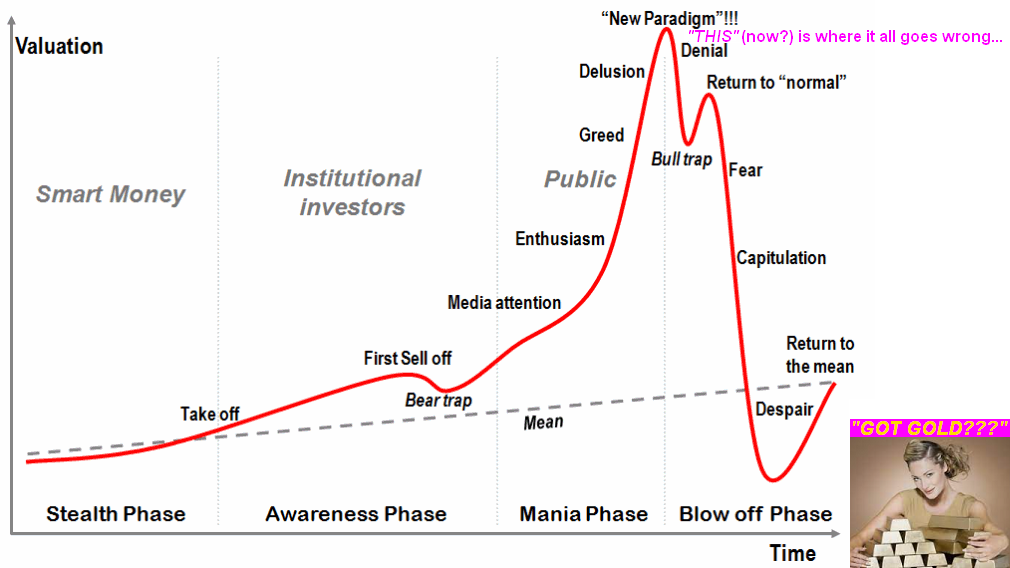
And AI is purportedly bringing us to Dow 100,000?  Talk about “This” being is where it all goes wrong!  

We therefore think for now:  “Forget about it!”

Rather:  Just get some GoldThat’s Actual Intelligence!

“Smart boy…”

Cheers!

 …m…

www.TheGoldUpdate.com
www.deMeadville.com
and now on “X”:  @deMeadvillePro