The Gold Update: No. 729 – (04 November 2023) – “Gold’s Post-Geopolitical Pullback”

The Gold Update by Mark Mead Baillie — 729th Edition — Monte-Carlo — 04 November 2023 (published each Saturday) — www.deMeadville.com

Gold’s Post-Geopolitical Pullback

From our purview, Gold appears on the perch of a downside lurch:  a classic post-geopolitical pullback.

“Unless like you’ve said that maybe ‘it is different this time’, right mmb?” 

Indeed, Squire, ‘twould be wonderful if Gold of late has been on the march as the world awakens to its real wealth trait versus that of worthless currencies.  But obviously Gold’s +10.7% climb from 06 October (low 1824) to 27 October (high 2020) was overwhelmingly induced by the Mid-East mayhem.

‘Tis terrible such tragedy has brought focus to Gold.  Yet within that conversation we hope arises a wider awareness of just how inexpensive Gold remains vis-à-vis currency debasement.  We need only glance at the above Gold Scoreboard reflecting price having settled the week yesterday (Friday) at 2000 … however by Dollar debasement (even in accounting for Gold’s own supply increase) the yellow metal’s value today is +85% higher at 3707.

That said, as we’ve previously articulated in detail, Gold has a penchant to reverse course downward following geopolitical price spikes, the most recently notable before the Mid-East mayhem being the early stages of the RUS/UKR war in 2022:  from that year’s 23 February settle price of 1911, Gold spiked +9% to as high as 2079 on 08 March only to then reverse course by -9% to 1895 come 16 March, i.e. below where ’twas at war’s outbreak; hence the heartless Gold Short then cynically saying “Nothing to see here…” 

And whilst now we’re starting to sense some Mid-East geopolitical price reversal is nigh, Gold being so close to its 2089 All-Time High, perhaps renewed wealth awareness then drives the yellow metal more properly into the sky.  For as Squire reminds us, maybe ’tis different his time.

By no means does this suggest making light of the Mid-East mayhem.  But acceptance of it as an ongoing event has begun affecting its stance in the news cycle.  Whilst still unquestionably a dire situation, we penned as follows in this past Wednesday’s Prescient Commentary:  “…As Mid-East headlines fall a bit from above the fold, so too falling are the precious metals’ prices…”  Moreover come Thursday in perusing Le Figaro, mention of the Mid-East didn’t appear until the seventh story in their “front page” news stack.

To be sure, fundamentally Gold is far too low; geopolitically ’tis somewhat stretched; and technically at least by BEGOS valuation ’tis presently too high.  (That courtesy of the “Nothing Moves in a Straight Line Dept.”)  To wit, let’s go to our year-over-year graphic of Gold vis-à-vis its smooth valuation line borne of Gold’s movement relative to those of the primary BEGOS Markets (Bond / Euro / Gold / Oil / S&P).

The lower panel’s oscillator (Gold less valuation) tells the “too high” story, price at present better than +100 points above the smooth line.  Historically (century-to-date):  upon price initially exceeding +100 points above valuation, Gold’s average decline within the ensuing 21 trading days (one month) is -5.5%.  Gold most recently exceeded valuation by +100 points in settling at 1993 on 20 October:  solely within that “vacuum” of a -5.5% decline would bring 1890 by 20 November.  Shall it so do?  We think not as Gold shows structural support from 1980 down to 1922; (for you mid-support structure watchers out there, that level is 1951).  Moreover as we’ll later see by Gold’s 10-day Market Profile, trading support at present ranges from 1995-1988.  But here’s the one-year BEGOS valuation chart featuring Mr. Too High extolling the present extreme:


Still, by Gold’s weekly bars and parabolic trends from a year ago-to-date, Gold appears quite safe as there is plenty of room below present price to the rightmost blue dots protecting the fresh Long trend, even given a post-geopolitical downward reversal of course:

Even broadly by Gold’s daily closing price across the past dozen years, this next view exemplifies the push to break up through the otherwise still existing triple-top spanning the past four years.  We thus think any near-term post-geopolitical price decline becomes a springboard to the next All-Time High:

“And don’t overlook that the weakening economic data helped Gold yesterday, mmb…” 

True enough there, Squire. The recently burgeoning Economic Barometer took a bit of a whack this past week, markedly so in the October data provided by the StateSide Bureau of Labor Statistics.  And generally, any hint that the Federal Reserve (its Open Market Committee as anticipated unanimously standing pat on Wednesday) may be done raising rates feeds positively into Gold.

Indeed, October’s Payroll creation was -49% slower than in September, and the Unemployment Rate ticked up whilst both the Average Work Week and Hourly Earnings ticked lower.  “Oh no, say it ain’t slow…”  Still, to be fair, ADP’s Employment pace was +27% over September’s:  so again, ’tis who’s counting whom.  Regardless, other slowings from September into October included the Conference Board’s gauge of Consumer Confidence, the Chicago Purchasing Managers Index, and the Institute for Supply Managment’s Indices for both Manufactuing and Services.  Too, the pace of Construction Spending slowed from August into September.  Yes, all that negativity came to be, even as on Wednesday the Wall $treet Journal headlined with The Economy Is Great…” (albeit Europe and China seemingly are on the skids).  Either way, StateSide put all its math into the Econ Baro, et voilà:

Now beyond the world of reality, the S&P 500 is going giddy!  Or at least those following it are.  On Monday:  “The S&P gained +1.2%!”  Then Tuesday:  “The S&P added another +0.6%!”  Wednesday:  “The S&P is soaring, +1.1%!”  Thursday “The S&P is straight up +1.9%!”  Friday:  “The S&P is all bullish, up yet again +0.9%!”

And thus for the week the S&P garnered growth of +5.9%.  Cue the late, great Howard Cosell:  “Looook at it GO!”

Here’s to where we saw it go:  merely back to now 4358 as ’twas three weeks ago.  Thus predictably, you know the next sentence.  “Change is an illusion whereas price is the truth.”  In other words, (’tis our turn to say):  “Nothing to see here.”

In the midst of it all, ‘natch, is Q3 Earnings Season.  And for the S&P 500, of the 381 constituents having so far reported, 65% have made more dough than in Q3 a year ago.

But shouldn’t they all be making more?  After all, this is the S&P 500, the top-tier, best-of-the-best.  And when it does not all go right, valuation is the plight.  Thus our honestly-calculated “live” price/earnings ratio for the S&P went from 34.0x on Monday to 40.5x come Friday’s settle.  For you WestPalmBeachers down there, that means if you buy the S&P right now, you’re willing to pay $40.50 for something than earns $1.  Further, the cap-weighted dividend yield for the S&P is but 1.625%.  Do not reprise “Bargain–[The Who, ’71].  Worth reprising:  the U.S. three-month T-Bill annualized yield is now 5.253%.

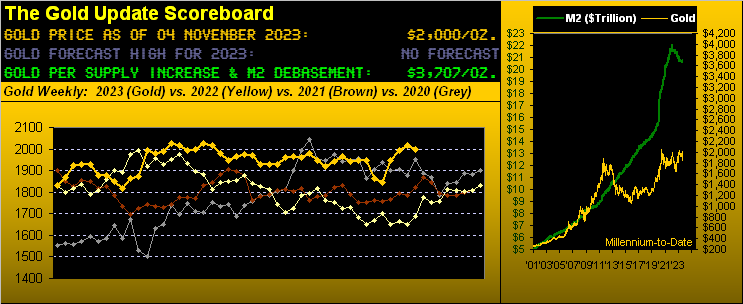
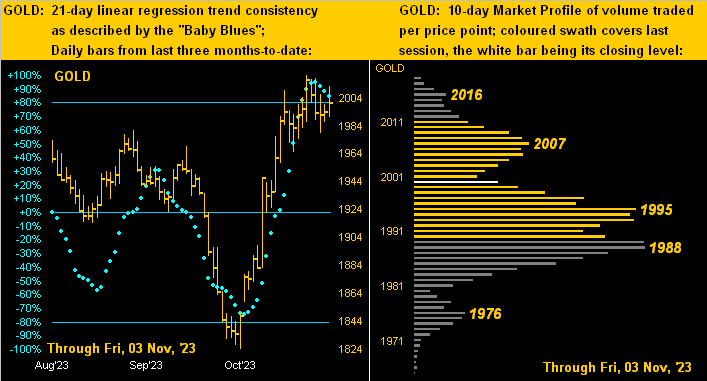
Then there’s Gold, which as aforementioned can rise +85% just to reach its current Dollar debasement value.  (Remember:  given historically such eventually happens, this is not a difficult decision).  And although price may languish near-term in post-geopolitical recoil, we don’t expect it to come well off the boil, (on which is has been for nearly a month).

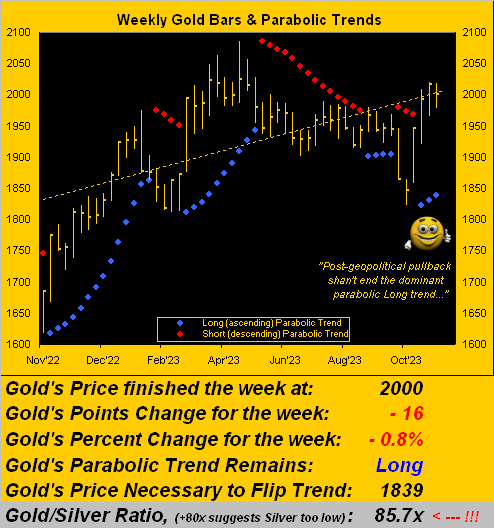
So to Gold’s two-panel graphic we go with the daily bars from three months ago-to-date on the left and 10-day Market Profile on the right.  Especially note the baby blue dots of trend consistency.  Barring price imminently/rapidly rising, those “Baby Blues” shall cross beneath the key +80% axis:  such has occurred twice within the past year resulting in subsequent point drops (within 21 days) of -67 and -20 respectively; and that reasonably aligns with the underlying 1980-1922 support structure noted earlier.  Specific to trading support, by the Profile the 1995-1988 zone may be the first to go toward further below:

Turning to Silver, that which seems inevitable for the yellow metal has already happened for the white metal, her “Baby Blues” (at left) having penetrated below the +80% level, as graphically tweeted (@deMeadvillePro) Wednesday evening, (albeit price has yet to let go in being saved by yesterday’s slowing economic inputs).  Still, as stated in Thursday’s Prescient Commentary, we can see Silver sliding down toward the 22.18 level.  But first by her by her Market Profile (at right), Sister Silver’s last trading bastion of support is 22.95:

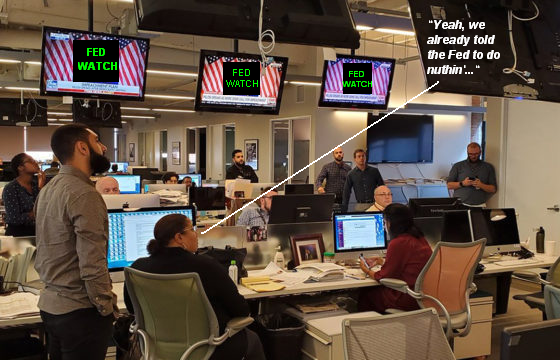
So with our expectations for Gold getting a post-geopolitical pullback — but still more broadly maintain an uptrend — we’ll wrap it up here with this from the “Is the FinMedia Really Running the Fed? Dept.”  To wit:

As you all know, the FOMC per this past Wednesday’s Policy Statement unanimously voted to maintain the Bank’s FedFunds target range as 5.25%-5.50%.  But did they really need to have their traditional two-day meeting?  After all, we were informed the previous Friday (27 October) by Dow Jones Newswires that:

“Inflation Trends Keep Fed Rate Hikes on Pause–Underlying inflation picked up in September, government data showed, keeping the Federal Reserve on track to hold short-term interest rates steady at its next meeting.”

Therefore:  why meet at all?  Even as the recent inflation data we herein recounted a week ago clearly justified the Fed raising rates, the FinMedia already had decided “No no, Jerome” and that was that.  (One wonders if they have to sign non-disclosure agreements.  Just a passing thought…)

Regardless of who’s running the Fed show, pullback or not, don’t pass on Gold!

Cheers!


…m…

www.TheGoldUpdate.com
www.deMeadville.com
and now on Twitter(“X”):  @deMeadvillePro