The Gold Update: No. 730 – (11 November 2023) – “Gold’s Bang-On-Time Dive”

The Gold Update by Mark Mead Baillie — 730th Edition — Monte-Carlo — 11 November 2023 (published each Saturday) — www.deMeadville.com

Gold’s Bang-On-Time Dive

Let’s open with this from the “We Hate It When We’re Right Dept.” reinforced by the age-old axiomatic quip:  “Be careful of that for which you wish as you just might get it.”  And you regular readers definitely get it.  For bang-on-time this past week came Gold’s dive.

Far more broadly in positively waving the Gold flag across the past 14 years — from the first edition of the Gold Update on 14 November 2009 with Gold then 1120 to now our 730th consecutive Saturday edition and price at 1943 — in anticipation of interim price declines we’ve on occasion had to deviate from Gold’s otherwise net ascent of 73%, (during which stint the U.S. Dollar’s M2 supply has increased a net 143%).  And last week’s anticipative missive (“Gold’s Post-Geopolitical Pullback“is a case in point, price in turn recording its second-worst weekly loss year-to-date on both a percentage (-2.9%) and points (-57) basis.  Which for those of you scoring at home begs the question:  “Which has been the worst?”, the answer being the weekly loss ending 29 September of -4.1% or -80 points.  ‘Course after that, Gold low-to-high gained +10.7% or +196 points through the heart of October.

Oh to be sure, over the years we’ve pounded the table that “shorting Gold is a bad idea” even in anticipation of price falling.  But this time ’round the dastardly Shorts got their fill (if you will) were they Short per last week’s drill.  We thus humbly utter the one word by the chap whose car cassette player was sufficiently loud such as to send the Tacoma Narrows Bridge into its destructive suspension swing:  “Sorry…” –[Pioneer, ’94].

To add context to present price, graphically for Gold we’ve placed on our year ago-to-date weekly bars the 1980-1922 green-bounded support structure cited in the prior missive.  And quite thoroughly hoovered it was this past week per the rightmost bar, although the parabolic trend remains Long:

Further should that support structure bust, it can be expanded to 1990-1914 or even 2001-1901 before Gold’s overall price positioning becomes materially affected … be it lower … or higher than ever before.

‘Course if you’ve been highly hyped up by the FinMedia these days, you may be seeking a dose of meclizine given the descriptive extremes of markets’ motions.  “Oh yields are plummeting!” they say.  “Oh the Dollar is tanking!” they say.  “Oh the stock market’s soaring!” they say.  “Oh Gold’s become so passé!” they say.  And from the “What Are They Smoking? Dept.” comes this gem: “Oh the Fed’s done raising!” they say.  To which we say clearly any effort to do math has gone away.  More on that along the way.

But for all the dizzying cries over markets’ careening this way and that, let’s look at the comparative tracks of the five primary BEGOS Markets from one month ago-to-date per the following two-panel display.  First on the left — save for Oil — the Bond, Euro, Gold and S&P 500 are all pretty much where they were on this date a month ago.  Yes, really:

Second on the right we’ve merely isolated the same tracks solely for Gold and the S&P such as to emphasize their once again dancing un pas de deux as we’ve on occasion depicted these many years.  And whilst broadly it shan’t last, at least at this writing the best paired correlation amongst those five primary BEGOS Markets is negative between Gold and the S&P, (which for you WestPalmBeachers down there means when one is going up, the other is going down); thus the mirror-like tracking in the above graphic.

“But what about Oil, mmb?” 

Ours is not to wonder why, Squire, other than to speculate when you’ve a lot of something for which demand is intermittently waning, the requisite price to move supply falls, (hat-tip Macroeconomics 101).  Moreover:  whist many folks are openly befuddled by Oil’s down direction given Mid-East tension, we humbly suggest that one merely mind the website’s Oil and/or Market Trends page such as to follow the “Baby Blues” of trend consistency. Five such Oil signals have therein been produced from one year ago-to-date, the average maximum $/cac follow-through within 21 trading days being $6,386, (ranging from $1,660 to $13,490).  That sure beats your trying to outguess the market; or as we oft quip:  “Follow the Blues instead of the news, else lose yer shoes.”

Also becoming a bit shoeless of late is our Economic Barometer.  Already having been on skids during November, this past week’s muted set of just five incoming metrics was nonetheless net negative for the Baro, notable month-over-month weakenings including September’s Trade Deficit and the backing up of Wholesale Inventories, plus a lurch down in November’s University of Michigan’s “Go Blue!” Sentiment Survey.  Too, as household liquidity lessons, the credit card is coming to the rescue.

But:  at least we’re told the Federal Reverse shan’t further raise rates, right?  Wrong.  Here’s the Baro from one year ago-to-date, featuring the earnings-unsupported S&P 500 in red and a table of the Fed’s 2% inflation target vs. the reported data.  Stagflation?  Stay tuned…

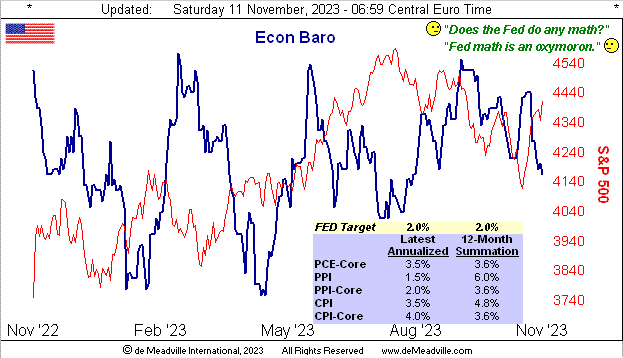
“But mmb, those PPI annualized percents are in line with the Fed’s target…” 

Duly noted, Squire.  If that Producer Price Index is truly leading, then we ought see the other inflation percents stall, if not fall, although the Fed does have a lean toward those Core Personal Consumption Expenditures.  As well, Minneapolis FedPrez Neel “Cash n’ Carry” Kashkari per Dow Jones Newswires “…is not convinced rate hikes are over…”  Or to reprise the great Bonnie Raitt from back in ’88: It’s just too soon to tell…

In the midst of all this, we read the Fed’s interest-rate increases of the past two years being deemed as “historic”.  Again, the Fed’s Effective Funds Rate is presently 5.33% (i.e. the targeted 5.25% + 5.50% ÷ 2).  Hardly is that “historic”.  Anyone remember the Prime Rate at 22% back in 1980?  We do. (What would be today’s FinMedia adjective for that?  “Steroidic”?)

Specific to the precious metals this past week, a more apt adjective would be “atrophic” as next we’ve the two-panel display of Gold’s daily bars for the past three months-to-date at left and same for Silver at right.  As aforementioned for Oil, here we’ve the “Baby Blues” signaling “Sell” in both metals’ current cases upon the dots having slipped below their respective +80% axes.  Again we commend “The trend is your friend” even if it must descend:

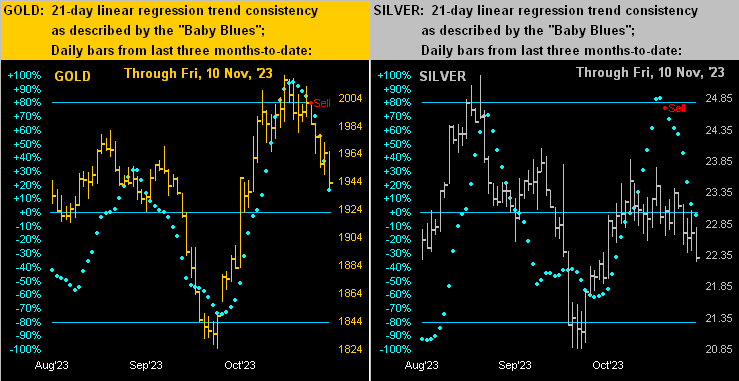
Indeed with respect to Gold, we tweeted (@deMeadvillePro) this graphic last Monday, reflective of the “Baby Blues” heading south:

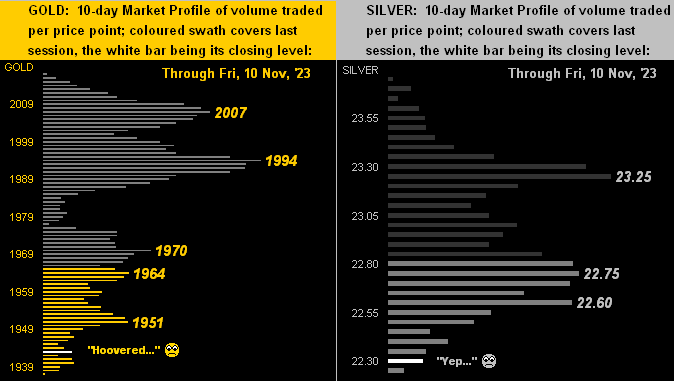
And so in turn we go to the 10-day Market Profiles for Gold (below left) and Silver (below right).  Simply stated from high-to-low, the word “hoovered” is apropos, with all labeled lines now overhead trading resistance.  As for their two-week percentage changes, Gold’s from top-to-bottom is -4.0% whilst that for Silver is -6.3%.  Is it any wonder the Gold/Silver ratio — now 87.1% — is at its second-highest level since last March?  No ’tisn’t.  Reprise:  Do not forget Sister Silver!

Toward the wrap, here’s the stack.

The Gold Stack
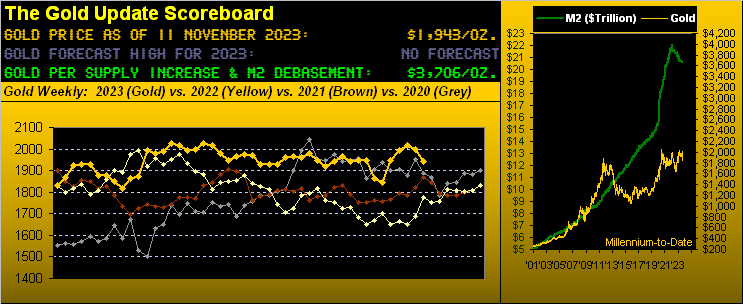
Gold’s Value per Dollar Debasement, (from our opening “Scoreboard”): 3706
Gold’s All-Time Intra-Day High: 2089 (07 August 2020)
The 2000’s Triple-Top: 2089 (07 Aug ’20); 2079 (08 Mar ’22); 2085 (04 May ’23)
2023’s High: 2085 (04 May)
Gold’s All-Time Closing High: 2075 (06 August 2020)
10-Session “volume-weighted” average price magnet: 1985
Trading Resistance: 1951 / 1964 / 1970 / 1994 / 2007
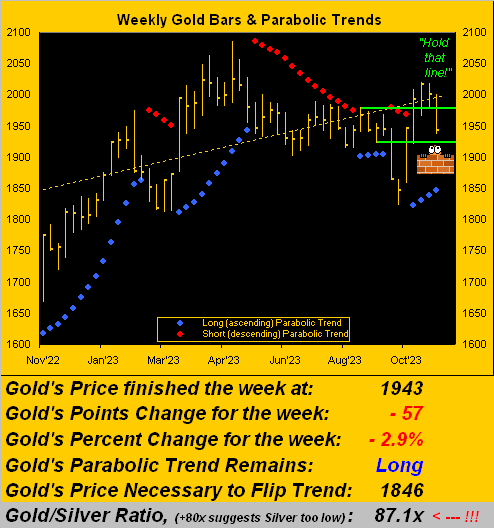
Gold Currently: 1943, (expected daily trading range [“EDTR”]: 24 points)
Trading Support: none by the Profile
10-Session directional range: down to 1922 (from 1980) = -81 points or -4.0%
The Gateway to 2000: 1900+
The 300-Day Moving Average: 1883 and rising
The Weekly Parabolic Price to flip Short: 1846
2023’s Low: 1811 (28 February)
The Final Frontier: 1800-1900
The Northern Front: 1800-1750
On Maneuvers: 1750-1579
The Floor: 1579-1466
Le Sous-sol: Sub-1466
The Support Shelf: 1454-1434
Base Camp: 1377
The 1360s Double-Top: 1369 in Apr ’18 preceded by 1362 in Sep ’17
Neverland: The Whiny 1290s
The Box: 1280-1240

In sum, Gold is definitely getting the anticipated post-geopolitical pullback.  Does it continue?  Per the website’s Gold and/or Market Values page, recall that price a mere week ago was +120 points above its smooth valuation line; that deviation has since been reduced to now +39 points.  Yet even as Gold’s “Baby Blues” are accelerating lower, again note the cited structural support bases:  1922, 1914 and 1901, the notion thus being that Gold is “safe” above the 1800s.

‘Course, given Gold’s
valuation by Dollar debasement is now 3706, ’tis clearly requisite toward maintaining one’s bridge to wealth security.

Thus:  don’t be that guy…

rather consider that Gold today is THE bang-on attractive Buy!

Cheers!

 …m…

www.TheGoldUpdate.com
www.deMeadville.com
and now on Twitter(“X”):  @deMeadvillePro