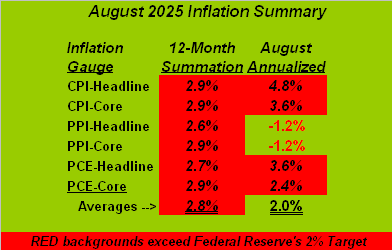
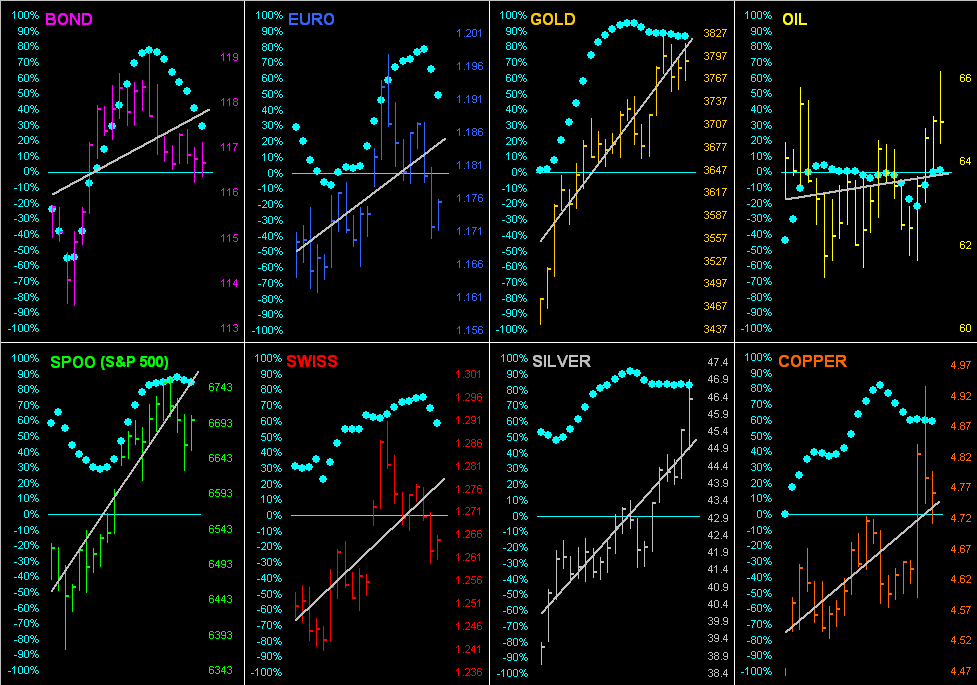
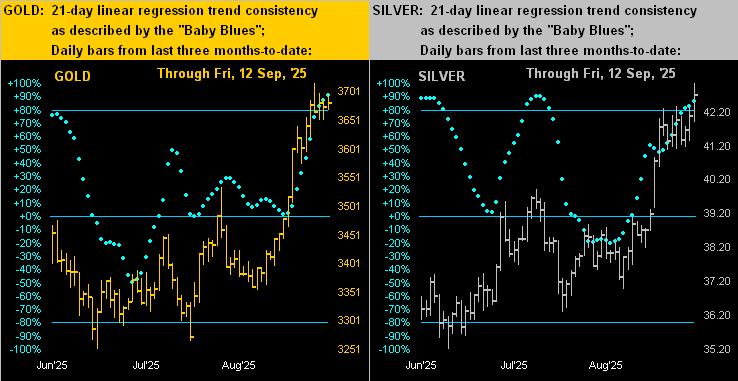
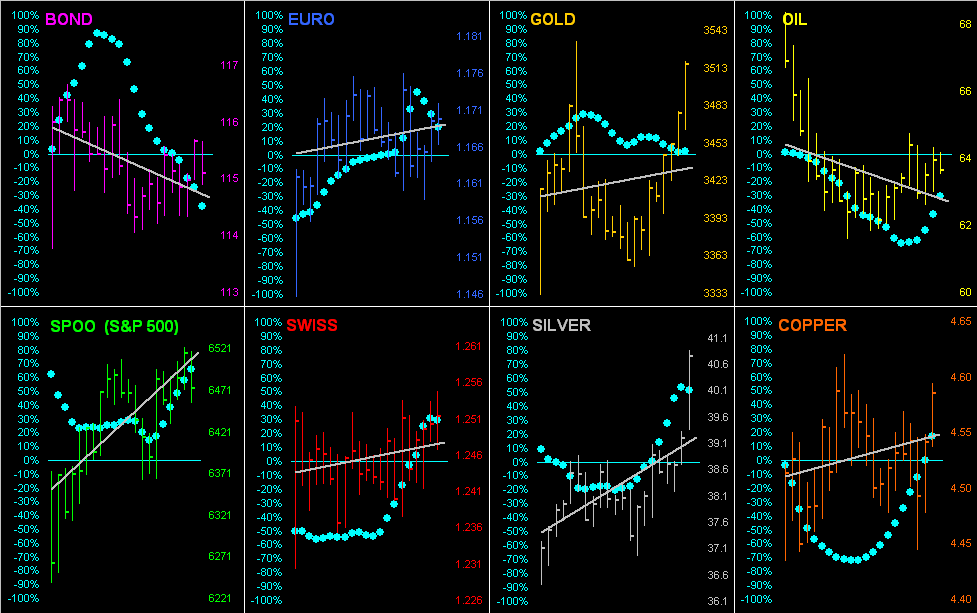
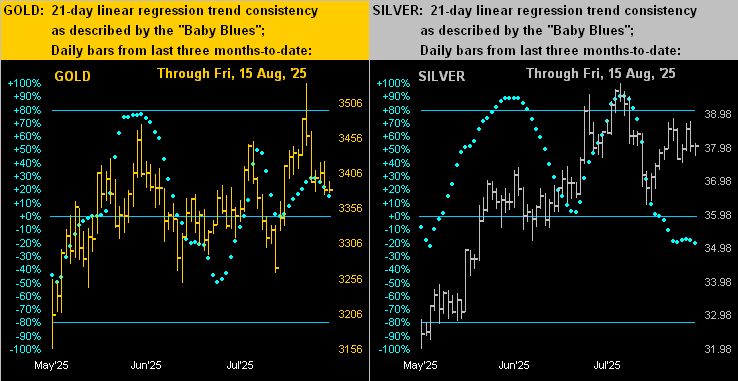
The Bond, Copper and Spoo are presently below today’s Neutral Zones; above same are the Euro and Swiss Franc, and BEGOS Markets’ session volatility is moderate. Gold has again set an All-Time High at 3904, and Silver has reached up to 47.83 so far this session. The Spoo’s “Baby Blues” (see Market Trends) have dropped (in real-time) to their key +80% axis: a settle below that border regularly dictates lower prices near-term; the S&P 500 itself saw its P/E settle yesterday at 49.0x, albeit with the Spoo trading lower this morning, the “live” futs-adj’d P/E at the moment is 48.7x; the S&P is now 16 consecutive sessions “textbook overbought” and the yield a wee 1.164%, (that for “risk-free” three-month annualized T-Bill yield is 3.845%). The Econ Baro looks to September’s ADP Employment data and ISM(Mfg) Index, plus August’s Construction Spending (not reported due to U.S. government shutdown).
 Mark
Mark
30 September 2025 – 08:28 Central Euro Time
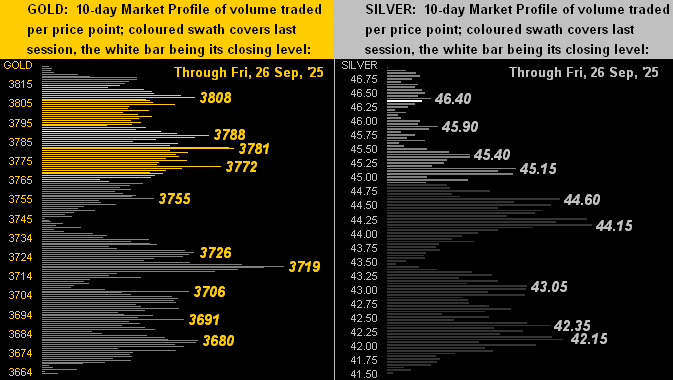
Gold at 00:05 GMT this morning reached its Dollar debasement value of 3865, moving further up to (thus far) as high as 3899; this is the first time since 2011 that price has (as graphically portrayed each Saturday in The Gold Update’s Scoreboard) exceeded its Dollar debasement value; the yellow metal is at present the only BEGOS Market outside (above, obviously) its Neutral Zone for today, and volatility for the BEGOS Markets otherwise is light. In real-time, Gold (3892) by Market Values is +314 points above its smooth valuation line; by its Market Profile, Gold’s nearest volume-dominant support price area is 3856-3854. Go Gold! albeit as we’ve written of late, price is very extended to the upside, and now certainly so in exceeding its Dollar debasement value; to be sure, geopolitical sensitivity is for the moment supporting price. For the Econ Baro today we’ve September’s Chi PMI and Consumer Confidence.
29 September 2025 – 08:38 Central Euro Time
The week begins finding Gold trading ever closer (its high thus far today 3849) to its Dollar debasement value (3865). At present, every BEGOS Market is higher, with seven of the eight (save for Oil) above their respective Neutral Zones for today; session volatility is moderate-to-robust. The Gold Update notably finds Silver leading the BEGOS Markets Standings, price +58.3% year-to-date, and even more so as of today by the white metal having moved up into the 47s; (Silver’s all-time high was back on 25 April 2011 at 49.82); too, we’re a bit concerned over Gold becoming excessively stretched to the upside, in real-time now +281 points above its smooth valuation line (see Market Values). The Spoo is higher such that were the S&P 500 to open at this instant, ‘twould so do +0.4%. 13 Econ Baro metrics are due this week, starting today with August’s Pending Home Sales.
The Gold Update: No. 828 – (27 September 2025) – “Gold Furthers Record Ticks; Silver Snags 46!”

We started with Silver; let’s close with same. The last time the Gold/Silver ratio was below its century-to-date average was well into the midst of COVID on 18 May 2021, (the white metal then priced at 28.29). If anyone cares to comb back through the 227 missives penned since then to count how many times we’ve written “Don’t forget the Silver!”, do drop us a line. In the meantime…

…keep towing the precious metals line!
Cheers!
…m…
www.TheGoldUpdate.com
www.deMeadville.com
and now on “X”: @deMeadvillePro
26 September 2025 – 08:32 Central Euro Time
Silver presently is the only BEGOS Market outside (below) its Neutral Zone for today; session volatility is again light with August’s “Fed-favoured” PCE inflation gauge in the balance. Silver traded yesterday to as high as 45.50, a better than 14-year high: the white metal now easily leads the BEGOS components year-to-date standings as we’ll present in tomorrow’s 828th consecutive Saturday edition of The Gold Update. Stocks took a bit of a jolt yesterday on an unusually strong revision to finalize Q2’s GDP — perhaps putting into question another Fed rate cut — the S&P 500 nonetheless coming well off its intraday low (6569) in settling at 6605. Looking at correlations for our five primary BEGOS components, the best currently is positive between the Bond and the Euro. In addition to the PCE, other Econ Baro metrics today of course include August’s Personal Income/Spending.
25 September 2025 – 08:32 Central Euro Time
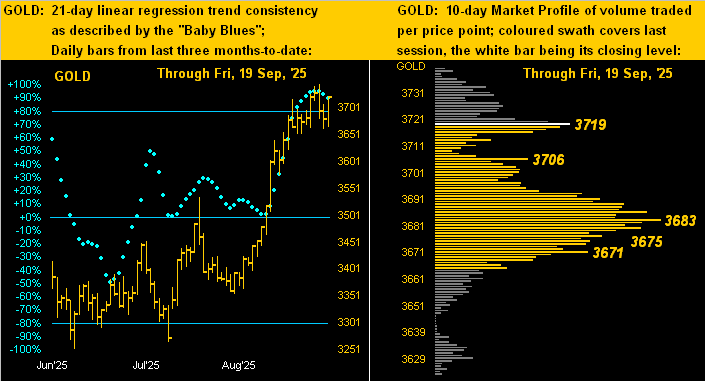
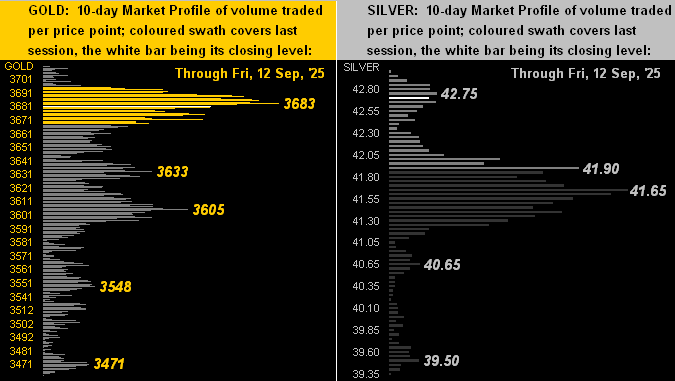
Copper, for which yesterday’s +4.0% net gain ranked fourth-best year-to-date, is higher again this morning and is the only BEGOS Market presently outside of its Neutral Zone; overall session volatility is again light. The pricing for the Spoo may be quite contained from now to tomorrow’s “Fed-favoured” PCE data for August; nonetheless, the S&P 500 itself remains “textbook overbought” and the futs-adj’d P/E 48.6x. Both Precious Metals have cooled a bit from their highs of Tuesday; still, Gold notably in real-time is +244 points above its smooth valuation line (see Market Values); and by its Market Profile, Gold shows its most dominant volume support at 3719. Incoming metrics for the Econ Baro include August’s Durable Orders and Existing Home Sales, along with the final read for Q2 GDP.
24 September 2025 – 08:26 Central Euro Time
Our two EuroCurrencies are the only BEGOS Markets presently outside (both below) today’s Neutral Zones; session volatility continues light, and by Market Ranges, save for the two precious metals, EDTRs remain relatively subdued. Our Top Three Market Rhythms for pure swing consistency are on a 10-test basis the Euro’s 1hr Moneyflow, the Spoo’s 4hr Parabolics, and the Swiss Franc’s 2hr MACD; on a 24-test basis they are Silver’s 4hr MACD, the Swiss Franc’s 1hr Parabolics, and Gold’s 2hr Moneyflow. The Swiss Franc (1.2739) is by its Market Profile in real-time on its most volume-dominant price of the past fortnight: overhead resistance by same is 1.2840 and support 1.2700. Despite yesterday’s -0.6% S&P 500 pullback, the breadth was positive (55%/44%), indicative of the largest mkt cap constituents driving the downside bus. The Econ Baro awaits August’s New Home Sales.
23 September 2025 – 08:50 Central Euro Time
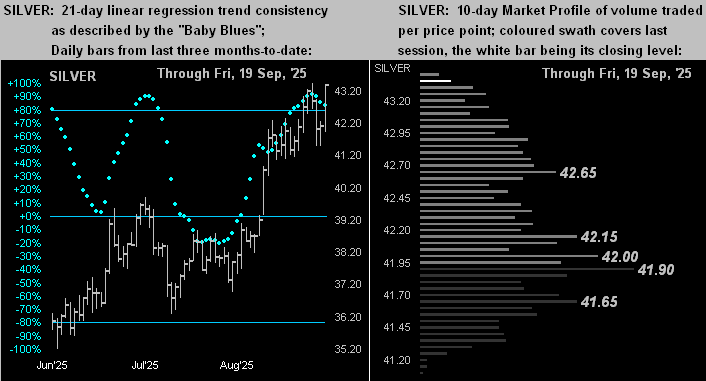
New highs continue to be recorded for both Gold (3795 thus far today) and the S&P 500 (6699 yesterday). At present, Copper is the sole BEGOS Market outside (below) its Neutral Zone for today, and session volatility to this hour is again light. Silver has today reached thus far up to 44.42, a level last traded on 03 May 2011; yet, the white metal still remains attractive vis-à-vis the level of the yellow metal given the Gold/Silver ratio of 85.8x bein well above its century-to-date average of 69.3x; Silver’s volume-dominant Market Profile support ranges from 42.65 down to 41.65; but by its Market Magnet, Silver’s settle last evening (44.32) finds it quite stretched at +1.85 points above that metric (see our Silver page). The Econ Baro starts its week today with Q2’s Current Account Deficit.
22 September 2025 – 08:42 Central Euro Time
Gold, Silver and Oil all are presently above today’s Neutral Zones; the other BEGOS Markets are within same, and session volatility is light. The Gold Update highlights both the yellow metal and S&P 500 making record highs, albeit prices are quite stretched near-term for Gold and broadly so for the S&P; the P/E of the latter in real-time (adjusted for the futs) is 48.6x. At Market Trends, only Oil is in negative linreg; however the “Baby Blues for the seven other BEGOS components are rolling over to the downside, (save barely those for the Spoo, but look poised to so do). Regardless, Gold just printed a fresh All-Time High as we type at 3748, (the previous being 3744 this past Wednesday). Nothing is due today for the Econ Baro ahead of a moderate load of incoming metrics as the week unfolds, the highlight being Friday’s release for August of the “Fed-favoured” PCE data.
The Gold Update: No. 827 – (20 September 2025) – “Gold n’ S&P Highs for All to See!”
For a month which through the last dozen years hardly has been happy for Gold — and certainly century-to-date dreadful for the S&P 500 — let’s hear it here in this September of 2025 for All-Time Highs all ’round! Whee-Heee!
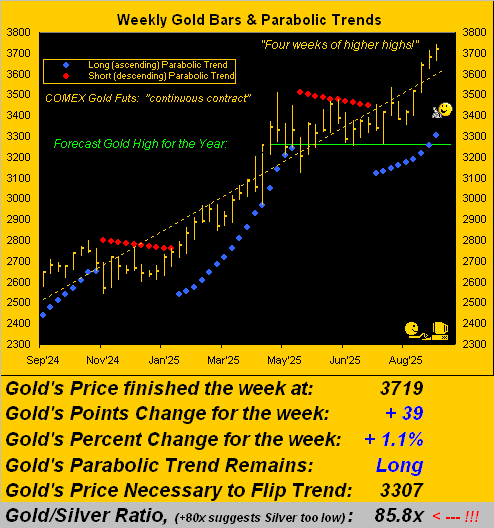
Through the 14 trading days of this September-to-date, Gold has posted record highs in eight, toward settling yesterday (Friday) at an All-Time Weekly Closing High of 3719, the year-to-date gain now +40.9%. Too for the S&P, albeit not always on the same day, there’ve also been eight days of record highs, the mighty Index settling the week at 6664, both a record daily and weekly close, the year-to-date performance now +13.3%.
Reprise from The Great Depression “The Dance of the Dollars” as crooned by the inimitable Ginger Rogers: ![]() “We’re in the money, We’re in the money…”
“We’re in the money, We’re in the money…”![]() –[Warner Bros., “Gold Diggers of 1933”].
–[Warner Bros., “Gold Diggers of 1933”].
Or as we’ve in more recent years occasionally quipped: “Marked to market, everybody’s a millionaire; marked to reality, nobody’s worth squat.”
“So mmb, obviously the S&P hasn’t crashed yet, right?”
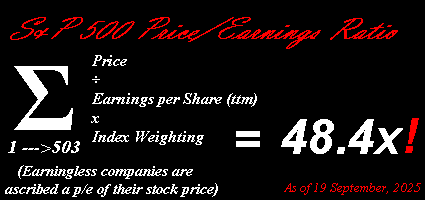
Rather, it has what we call “up-crashed”. Squire is referring of course to last Saturday’s edition of The Gold Update per its title “Gold Gets the Cash (Ahead of S&P Crash?)“ For in spirit with the Federal Open Market Committee having voted nearly unanimously this past Wednesday to lower The Bank’s Funds Rate by our anticipated -0.25% — (an event “priced-in” a few billion times) — the S&P 500 posted a +1.2% weekly rise, as did Gold gain +1.1%. But specific to the S&P, how’s that price/earnings ratio of 48.4x workin’ out for ya?
But let’s instead turn the tables on Squire and ask him a question:
You have today $100,000 to invest for one year, and (excluding Gold), which of the following two options’ results would you select?
- Option 1: in a year’s time your $100,000 investment shall additionally have garnered $3,610 in yield such that you’ll then have $103,610;
- Option 2: in a year’s time your $100,000 investment shall additionally have garnered $1,171 in yield such that you’ll then have something in the range of $83,000 to $119,000. Squire?
“Option 1, mmb, which is the one-year T-bill, ’cause Option 2 is the too much crazily-overvalued S&P.”
Smart boy is our Squire. (For those of you scoring at home, Option 2’s $83k – $119k range includes the wee yield and is one standard deviation both above and below the S&P’s annual average percentage change through this century’s 24 completed years).
‘Course, given the perilously overvalued S&P today — similar to that just preceding the DotComBomb — a like fall of more than -50% in the S&P would instead place the low end of Option 2’s range just under $50k.
Further into a deep numerical dive, you may have seen last evening’s release by the Commodity Futures Trading Commission of the Commitments Of Traders for the S&P 500 futures: ’tis net Short -225,100 positions, the most since that which preceded last year’s S&P demise from March into April. Either way, have a nice day.
But to get on with good old Gold, century-to-date ’tis now +1,259%. ‘Course the nattering nabobs of Gold negativism are always quick to point out that Gold has no yield. We simply let them instead be happy with their S&P 500’s approximately +550% gain including yield across the same stint.
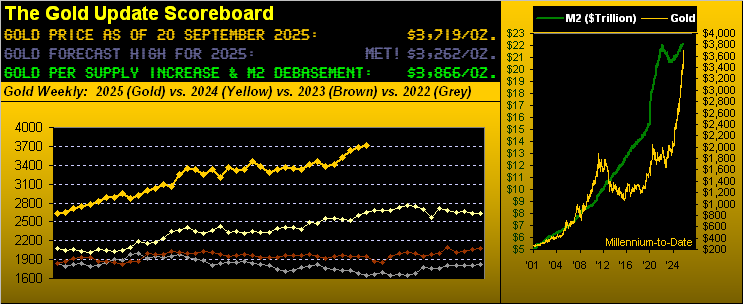
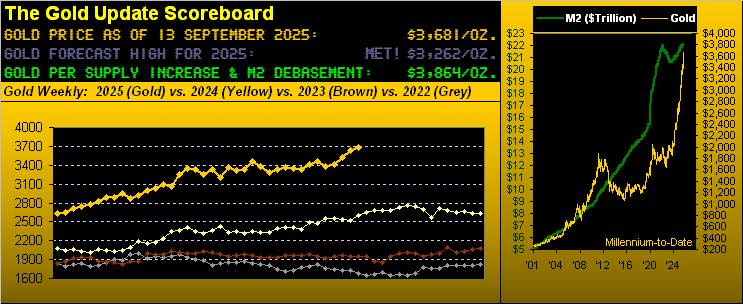
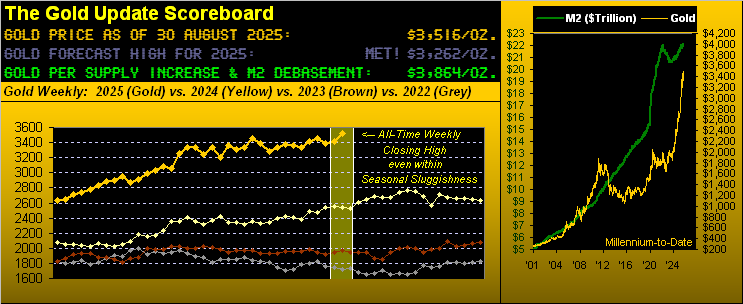
Now with respect to our opening Gold Scoreboard, price (3719) has been racing up toward the Dollar debasement value of 3866. However, per the aforementioned FedFunds interest rate cut, that ought raise the debasement bar higher still as dough more affordably flows out through the Fed window. Indeed this past week, the StateSide “M2” money supply reached its own all-time high of $22.207T. That of course “supports” (not) the current S&P 500 market capitalization of $58.800T. (Have we made mention in the past of the “Look Ma! No Money!” crash?)
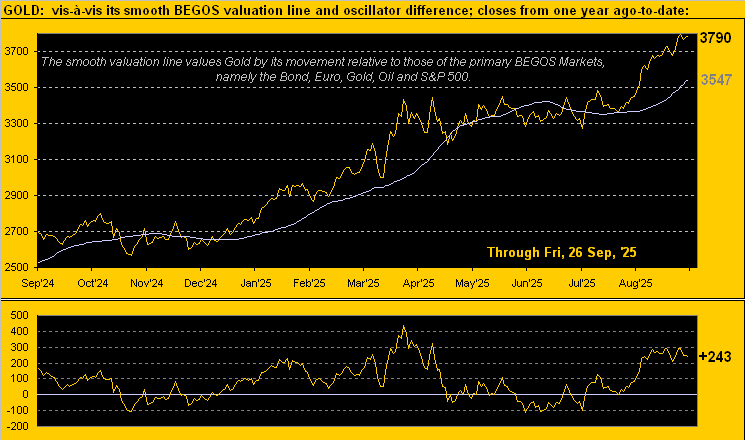
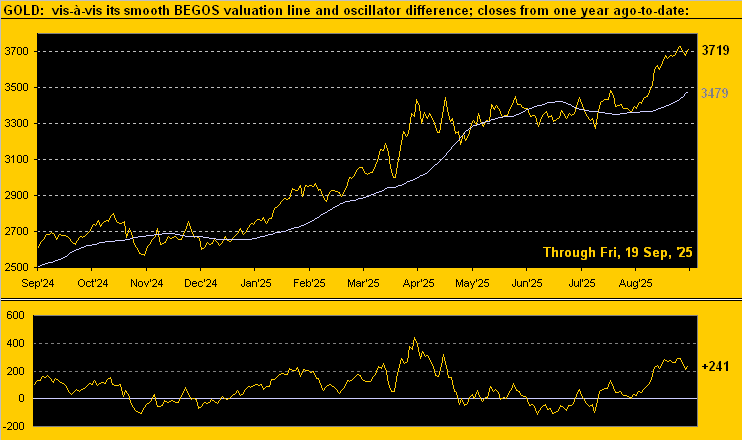
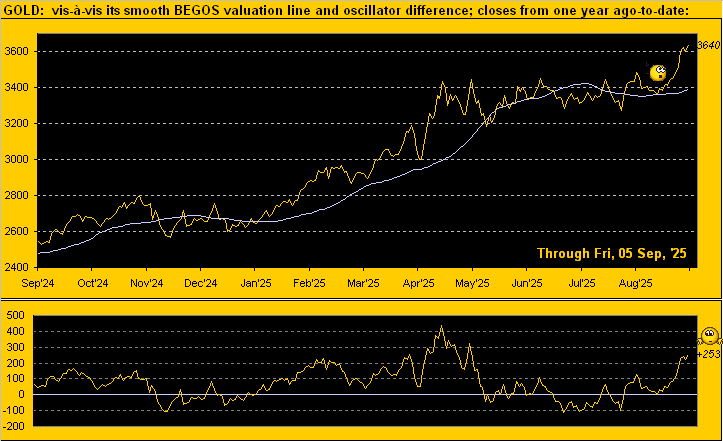
Still, as glorious as has been Gold’s recent run, might it be (only temporarily) done? Per the following website graphic of Gold’s value vis-à-vis its movement relative to those of the primary BEGOS Markets (Bond / Euro / Gold / Oil / S&P 500), price today at 3719 is +241 points “high” above its smooth valuation line at 3479, (levels rounded to nearest whole number). Across the graphic (excluding this most recent excursion), when price’s deviation has been at least this “high” by the lower panel’s oscillator, Gold within 21 trading days (one month) has declined by an average -6.1% (which from here would be -227 points into revisiting the upper 3400s). All that courtesy of the “Markets Don’t Move in a Straight Line Dept.”:
Monday at 18:19 GMT brings 2025’s autumnal equinox, (which for you WestPalmBeachers down there you call “the first day of fall”). Query: Shall “fall” arrive as a double entendre at Broad and Wall? For the S&P has gone far beyond any dutiful call…

But you can stay secure with Gold through it all!
Cheers!
…m…
www.TheGoldUpdate.com
www.deMeadville.com
and now on “X”: @deMeadvillePro
19 September 2025 – 08:39 Central Euro Time
The S&P 500 is at an all-time closing high (6632) following yesterday’s all-time intraday high (6657). The Spoo however is weaker this morning (6687) and presently below its Neutral Zone for today, as are the Bond, Swiss Franc and Oil; above same is Silver, and session volatility for the BEGOS Markets is moderate. Amongst the five primary BEGOS components, the best current correlation is positive between Gold and Oil. Gold, after reaching another All-Time High this past Wednesday (3744) is by its daily technicals showing the earliest signs of perhaps some price pullback: more on that in tomorrow’s 827th consecutive Saturday edition of The Gold Update. And Copper’s “Baby Blues” (see Market Trends) just confirmed a sell signal last evening, the level of the Blues having settled below the key +80% level. The Econ Baro is quiet today following a rather choppy week of 14 incoming metrics.
18 September 2025 – 08:41 Central Euro Time
Moving on from the Fed’s “non-event” -25bp Funds rate reduction, we’ve at present both the Bond and Spoo above today’s Neutral Zones, whilst all six of the other BEGOS Markets are below same; session volatility is firmly moderate. Specific to the positioning of the five primary BEGOS components vis-à-vis their Market Values in real-time: the Bond is 1^15 points “high” above its smooth valuation line, the Euro basically in sync with its valuation line, Gold +208 points “high”, Oil -1.17 points “low, and the Spoo +165 points “high”. Yesterday the S&P 500 posted a second consecutive down day for just the second time across the past 18 trading sessions, the “live” futs-adj’d P/E now 47.5x. And the Econ Baro concludes its week today with metrics that include September’s Philly Fed index and August’s Leading (i.e. “lagging”) Indicators.
17 September 2025 – 08:37 Central Euro Time
The Swiss Franc and all three elements of the Metals Triumvirate are presently below today’s Neutral Zones; the rest of the BEGOS Markets are within same, and volatility is mostly light. Looking at Market Rhythms for pure swing consistency, on a 10-test basis the Top Three are all for the Spoo as follows: 4hr Parabolics, 30mn Moneyflow, and 15mn Parabolics; for the 24-test basis we’ve again the Spoo’s 30mn Moneyflow, the non-BEGOS Yen’s 30mn MACD, and Silver’s 4hr MACD. Gold yesterday registered another All-Time High at 3740, but as noted, the metals are coming off so far today. The S&P 500 remains “textbook overbought”. The Econ Baro awaits August’s Housing Starts/Permits. Then at 18:00 GMT we’ve the Policy Statement from the FOMC incorporating a -25bp reduction in the Funds rate.
16 September 2025 – 08:43 Central Euro Time
The EuroCurrencies and the Spoo are presently above their respective Neutral Zones for today, whilst below same is Copper; volatility is light-to-moderate. To be sure, the Spoo’s “Baby Blues” (see Market Trends) are now in a fifth trading day of ascent after having declined (as herein written) the six prior sessions which (save for 02 September) essentially found price on the rise: ’tis unusual, that, which is why our deMeadville analytics ought always be judged in context with one’s own financial assessments of trend, etc.; indeed the 21-day linreg trend of the Spoo has been positive from 29 April-to-date. The S&P 500 itself now sports a “live” (futs-adj’d) P/E of 47.3x, the Index as well characterized as “extremely textbook overbought”. Oil’s cac volume is rolling from October into that for both November and December. And ’tis a busy day for the Econ Baro with September’s NAHB Housing Index, August’s Retail Sales, Ex/Im Prices, and IndProd/CapUtil, plus July’s Business Inventories.
15 September 2025 – 08:42 Central Euro Time
The Bond begins the week at present below its Neutral Zone for today; Oil is above same, and BEGOS Markets’ volatility is light. The Gold Update details the yellow metal having achieved a run in less than one year of ten +100-point milestones, the most recent of course being 3700 this past Tuesday; too is stressed the massive overvaluation of the S&P 500 and the notion of it perhaps nearing a crash as Gold gets the cash. That stated, the S&P 500’s MoneyFlow (per our page) is very supportive of the Index’s ascent, even as the “live” (futs-adj’d) P/E in real-time is 46.7x. Cac volume for the Spoo is rolling from September into December. ‘Tis a busy week for the Econ Baro with 14 incoming metrics scheduled, beginning today with September’s NY State Empire Index. Wednesday is the week’s centerpiece of the FOMC vote to reduce the Funds rate by -25bp, an event which already has been “priced-in” to the S&P time and again.
The Gold Update: No. 826 – (13 September 2025) – “Gold Gets the Cash (Ahead of S&P Crash?)”
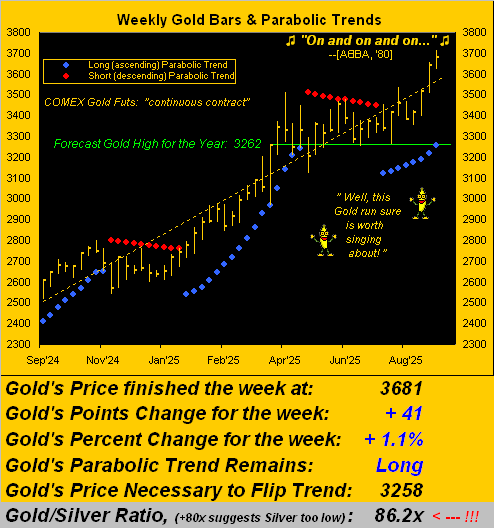
Yes, Gold this past Tuesday by its “continuous contract” (for which the “front month” is December) touched 3700 — trading even further to a fresh All-Time High at 3715.
No, Gold wasn’t long-lived above 3700; however for 38 glorious Golden minutes ’twas a beautiful thAng. Price then proceeded through the balance of the week to settle per the above Gold Scoreboard at 3681, now just -183 points beneath the Dollar debasement value of 3864. And as detailed in last week’s missive, upon next eclipsing such key measure — regardless of when that may be — we’ll again judiciously reiterate (after 14 years) that Gold has “gotten ahead of itself”. Do mind the above right-hand panel. And whilst it has not yet happened, ’tis nonetheless fabulous to see Gold having almost caught all the way up to where it ought be brought, (so hopefully you’ve long ago bought).
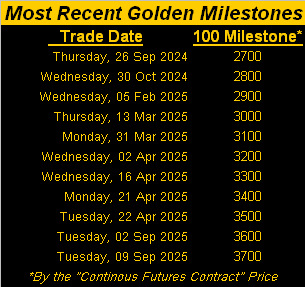
More striking however is that across the past 242 trading days from last 26 September-to-date, Gold has achieved TEN +100-level milestones from 2700 to now 3700, (which for those of you scoring at home is a +37% increase in less than one year). By comparison, remember when it took 2,251 consecutive trading days (basically nine years) for Gold to just get from 1900 on 22 August 2011 those +100 points higher to 2000 on 21 July 2020? 2,251 trading days just to gain +100 points! But this most recent milestone run has averaged +100 points every 24 trading days! Here’s the table:
“Although, mmb, the percentage increase from one to the next is always decreasing…”
Squire remains one of the few modern-day market mavens who does math. And to be sure, from Gold 1900 to 2000 was a +5.3% increase, whereas this most recent 3600 to 3700 was just a +2.8% increase.
But let’s view it from the futures contract perspective, whereby with a $20k commodity account you can trade one Gold contract, and thus control 100 ounces of Gold; (as opposed to $20k covering only five physical ounces; which for you WestPalmBeachers down there is — by the futures — called “leverage”).
So: Gold back then from 1900 to 2000 was a +100-point gain x $100/point = $10k profit, (your $20k account thus becoming $30k, or +50%) … but again, that took those noted nine years. Now, in just less than one year, Gold has gone from 2700 to 3700, a +1,000-point gain x $100/point = $100k profit, (your $20k account instead becoming $120k, or +500%).
Therefore to Squire’s point, yes each successive +100-point milestone is a smaller percentage gain … but they’ve been coming far more rapidly, indeed perhaps too rapidly. Here we update from the website our Market Value measure for Gold, price (3681) now showing as +260 points “high” above its smooth valuation line (3421) defined by the movement of our primary BEGOS Markets (Bond / Euro / Gold / Oil / S&P 500). And as we always say, price inevitably reverts to valuation:

Thus into Fed week we go, the Open Market Committee expected to release their Policy Statement incorporating a rate cut (we see -25bp) come Wednesday at 18:00 GMT; the pop in August retail inflation is too much to warrant a “jumbo” rate cut of -50bp. So does that in turn send the S&P 500 on a selling spree? J.P. Morgan opines there may so be. For the S&P now being “priced to perfection”, ’tis all indeed “priced-in”, you see?

Pssst: “Got Gold?”
Cheers!
…m…
www.TheGoldUpdate.com
www.deMeadville.com
and now on “X”: @deMeadvillePro
12 September 2025 – 08:43 Central Euro Time
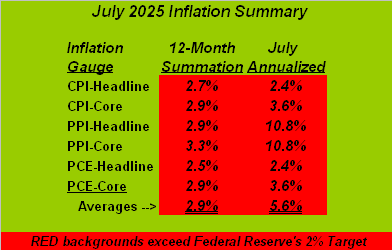
Record highs were recorded yesterday for both the Spoo (6600) and the S&P 500 itself (6593), even as retail inflation via headline CPI doubled its pace from from July’s +0.2% to now +0.4% for August; the month’s core pace was maintained at +0.3%, still ahead of the Fed’s desired 2% annualized target. Although September is notoriously known for being the year’s poorest S&P month, through its eight trading days-to-date ’tis +2.0%. This morning presently finds all three elements of the Metals Triumvirate above today’s respective Neutral Zones, whilst below same is Oil; session volatility for the BEGOS Markets is mostly moderate. Amongst the five primary BEGOS components, our best correlation currently is negative between the Euro and Oil. Currencies’ cac volume is rolling today from September into that for December. The Econ Baro finishes its somewhat negative week with September’s UofM Sentiment Survey. And tomorrow’s 826th consecutive Saturday edition of The Gold Update shall of course feature price having tapped the 3700 level.
11 September 2025 – 08:45 Central Euro Time
The Bond is at present the only BEGOS Market outside (below) its Neutral Zone for today; session volatility is again light. Yesterday’s +0.3% gain in the S&P 500 was (by moneyflow regressed into S&P points) solely due to one stock, ORCL, which gained 36%; otherwise, the S&P’s breadth was negative (201 up, 301 down, 1 unch). Came too a deflationary PPI read for August (-0.1%) albeit as volatile as is that series, a better read ought be by today’s CPI report. Market Values’ excesses of note include (in real-time) the Bond as +2 points “high” above its smooth valuation line, Gold as +259 points “high” and the Spoo as +104 points “high”; obviously by our “textbook technicals”, the S&P is “overbought”. In addition to retail inflation for the Econ Baro, included late in the session is August’s Treasury Budget.
10 September 2025 – 08:45 Central Euro Time
Gold, after achieving yet another All-Time High yesterday (3715) is at present (3681) above its Neutral Zone for today, as is Oil; the balance of the BEGOS Markets are within same, and volatility is light with key inflation data pending these next two days. The S&P 500, whilst not exceeding its all-time intraday high (6533 last Friday), settled yesterday at an all-time closing high of 6513. For the Spoo, its “Baby Blues” (see Market Trends) having in real-time stopped their descent; however that doesn’t preclude significant market downside it being September and the S&P “priced to perfection” incorporating a Fed rate cut. Still as noted, the final two pieces in the Fed’s inflation puzzle come today via August’s PPI which spiked in July, and tomorrow for the CPI which may well be upwardly affected by the July PPI as it leads the CPI by a month. Mind the Econ Baro.
09 September 2025 – 08:51 Central Euro Time
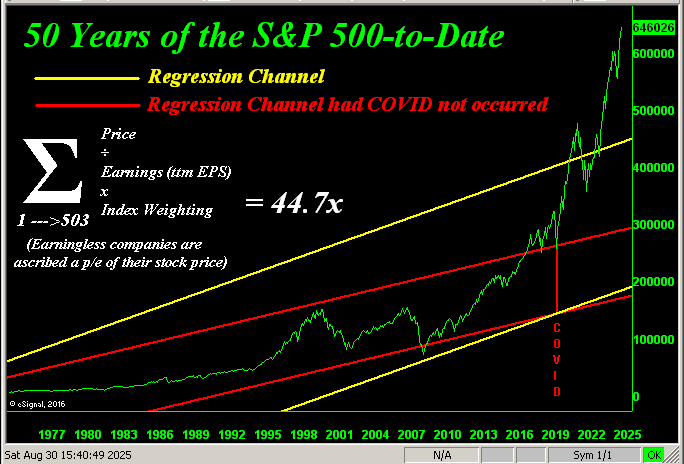
Oil is at present the only BEGOS Market outside (above) its Neutral Zone for today; session volatility is light. Gold’s run of All-Time Highs is furthering itself, trading thus far up to 3699; Silver is lagging in price, albeit is still north of 40 having reached 42.07 in this session, (Monday’s high having been 42.36). At Market Trends, with the exception of Oil for which its 21-day linreg trend is flat, all other seven BEGOS components are in uptrends; however specific to the Spoo, its “Baby Blues” of trend consistency are (in real-time) falling for a sixth consecutive trading day as such uptrend becomes less positive; too by Market Values, the Spoo (in real-time) is +101 points “high” above its smooth valuation line. Specific to the S&P 500 itself, its futs-adj’d P/E is 44.7x and the yield 1.190%; the “risk-free” annualized 3-month T-Bill’s yield compared at 3.928%. Nothing is due today for the Econ Baro.
08 September 2025 – 08:42 Central Euro Time
Presently, both Copper and Oil are above today’s Neutral Zones; none of the other BEGOS Markets are below same, and volatility is moderate. The Gold Update notes yet another All-Time High for the yellow metal (3656) from Friday, price having modestly come off a bit today (3634); however by Market Values, Gold (in real-time) is +241 points “high” above its smooth valuation line; still per Market Trends, Gold’s “Baby Blues” (as too are those for Silver) of linreg consistency continue to climb. The Economic highlights of an otherwise fairly quiet week for the Econ Baro are Wednesday’s PPI for August and CPI on Thursday: we’ll see if July’s PPI inflation spike leads into a higher CPI for August. Else, the poor employment data as detailed in The Gold Update certainly secures a Fed rate cut come 17 September. Late in today’s session we’ve July’s Consumer Credit.
The Gold Update: No. 825 – (06 September 2025) – “Is Gold (Again) Getting Ahead of Itself?”

Today is 06 September 2025. Do you recall up to where Gold traded on this very date 14 years ago?
“On this day in 2011 price reached an all-time high of 1923, right mmb?”
Precisely so, Squire, yet then for nearly nine years ’twas never higher. Rather, from that landmark day’s All-Time High of 1923, Gold embarked on an almost -46% correction to as low as 1045 on 03 December 2015, before fully recovering through the ensuing four and one-half years to reach 1942 on 27 July 2020 whilst COVID cloaked the globe.
And long-time readers may recall ’twas shortly after 06 September 2011 — indeed on 01 October 2011 in the 98th Edition of The Gold Update — we wrote that Gold had gotten “ahead of itself”. As above shown in the righthand panel of the Gold Scoreboard, the price of Gold as graphed was exceeding the track of the green “M2” money supply line.
Now fast forward to today’s title, we query same: “Is Gold (Again) Getting Ahead of Itself?” The answer is (a little drumroll please…): 
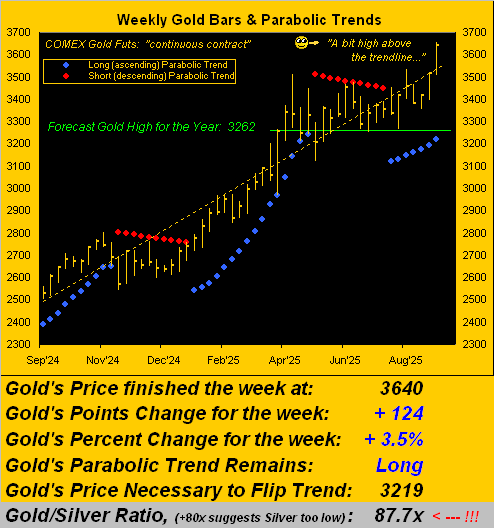
No. But: ’tis not far from so doing! Again per the Scoreboard, Gold settled its week yesterday (Friday) at 3640, an All-Time Closing High, recording en route an All-Time Intraday High of 3656. And the current Dollar debasement value for Gold — even in duly adjusting for its own supply increase — is 3864. That’s just +224 points (+6.2%) higher than here. So given that Gold’s current EWTR (“expected weekly trading range”) is presently 124 points, come September’s end, Gold truly may have again gotten ahead of itself. ‘Tis not a prediction, but well worth minding.
Too, by our Market Value graphic for Gold (wherein price’s movement is measured vis-à-vis those of the other primary markets which comprise BEGOS (Bond / Euro / Gold / Oil / S&P 500), the yellow metal shows as currently +253 points “high” above valuation to which it always reverts (be it up or down) … just in case you’re scoring at home:
“But mmb, are you getting bearish then on Gold?”
Oh heavens no, dear Squire. We’re merely sensitive to the fact that markets don’t move in a straight line, (save, ‘twould seem, for the ever-higher S&P 500). As noted and per the above oscillator, price always reverts to the BEGOS valuation, which itself too (albeit more ponderously) rises and falls.
Meanwhile making the rounds in the midst of it all is a Goldman Sachs call (should the Fed fall) for Gold 5000. We read the FinTimes piece of GS’ warning over “Trump political this” and “lost confidence that”. But despite the mention of inflation, hardly was the key driver of Gold’s value directly stated: again, (for you WestPalmBeachers down there) ’tis Dollar debasement.
So typically as is our wont, we did the math. And to the nearest trillion, were the Federal Reserve to add another $6T to the StateSide money supply, ‘twould “equate” to valuing Gold at 5000. Albeit, you’ll recall the $7T accommodation for COVID instead benefitted the S&P 500 rather than Gold. Which is why the S&P to this day remains so dangerously overvalued: “How’s that 45.3x price/earnings ratio workin’ out for ya?” Cue Nat King Cole in parody from ’51: ![]() “Unsustainable…”
“Unsustainable…”![]() .
.
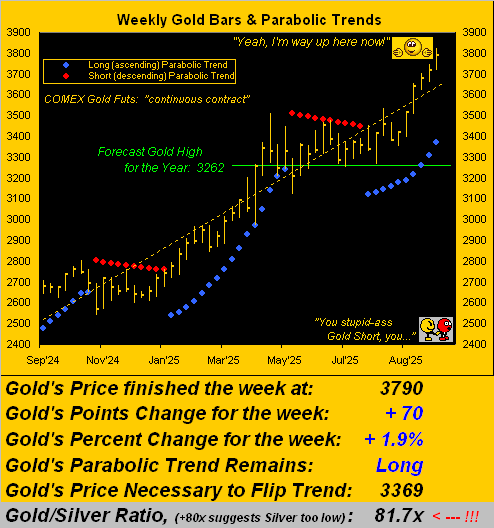
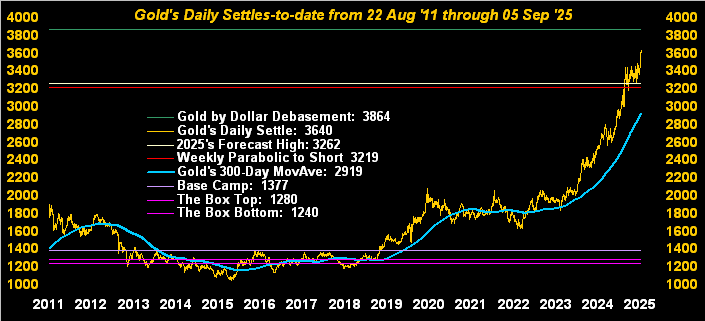
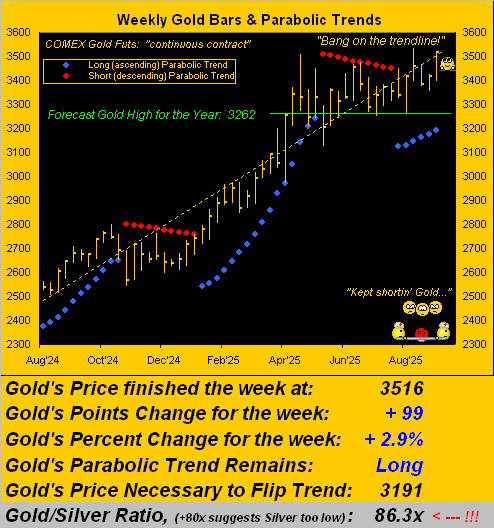
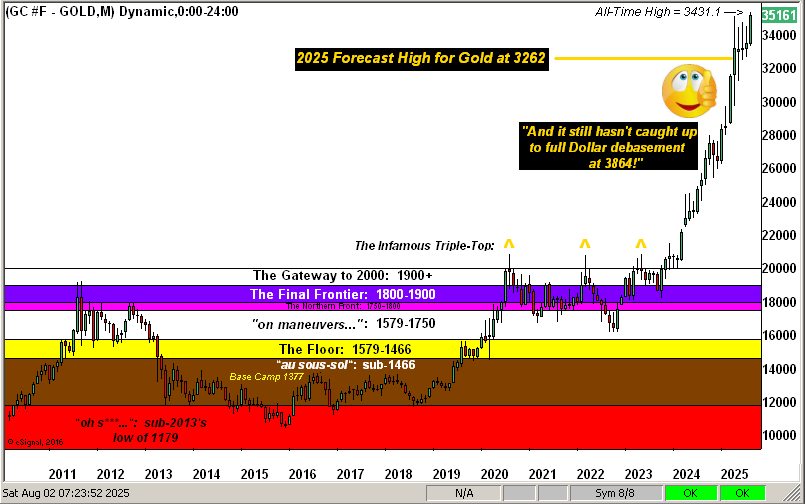
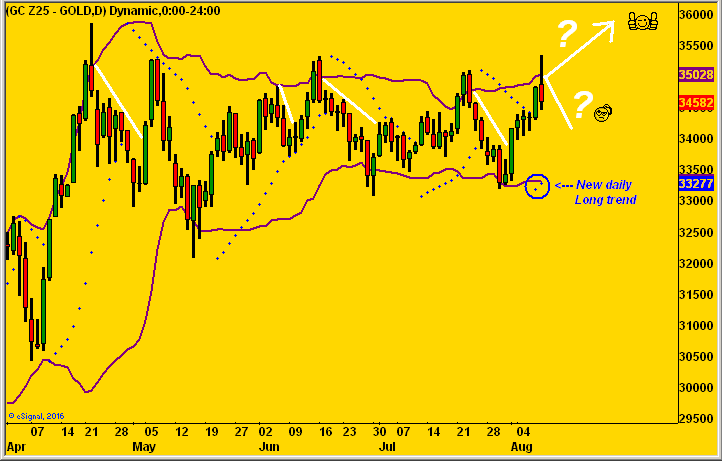
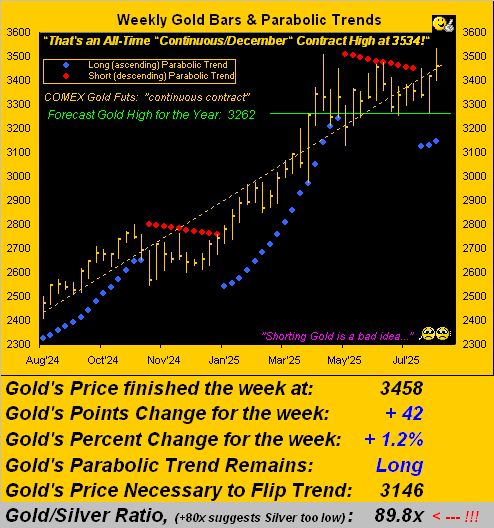
Certainly sustaining its weekly Long trends is Gold as we turn to those bars from one year ago-to-date. Our wee friend therein points toward present price being high above the dashed linear trendline; however the blue-dotted parabolic Long trend now seven weeks in duration offers 421 points of safe space between here (3640) and there (3219). Note too how our forecast high for this year (3262) is providing support at its green line. All-in-all, quite the bullish picture to this point:
So to close for you, how stormy is becoming the September view?

Even if ahead of itself, ‘tis best to keep Gold in your investment queue!
Cheers!
…m…
www.TheGoldUpdate.com
www.deMeadville.com
and now on “X”: @deMeadvillePro
05 September 2025 – 08:25 Central Euro Time
Basis the Spoo (6527) adjusted for fair value, the S&P 500 would open at an all-time high come 13:30 GMT, given yesterday’s poor ADP data “ensuring” a Fed rate cute (17 Sep). At present, the Spoo is above its Neutral Zone for today, as the other BEGOS Markets, save for the Swiss Franc and Oil being within same; session volatility is light-to-moderate. Going ’round the Market Values horn in real-time for the five primary BEGOS components: the Bond is +0^28 “high” above its smooth valuation line, the Euro essentially in sync with its valuation line, Gold +225 points “high”, Oil -2.30 points “low” and the Spoo +137 points “high”. Is Gold again getting ahead of itself? More on that in tomorrow’s 825th consecutive Saturday edition of The Gold Update. In the interim, the Econ Baro awaits August’s payrolls data, wherein we’ll see if bad continues to be good for the S&P.
04 September 2025 – 08:25 Central Euro Time
Each element of the Metals Triumvirate is presently below today’s Neutral Zones; the other BEGOS Markets are within same, and volatility is moderate, noting that Gold — after having traded yesterday up to another All-Time High at 3640 — has today already traced 106% of its EDTR (see Market Ranges). Currently 3592, Gold is (in real-time)+210 points above its smooth valuation line (see Market Values). At Market Trends, the Spoo’s “Baby Blues” of linreg consistency are in real-time falling for a third consecutive session. Looking at Market Rhythms for pure swing consistency, on a 10-test basis our current leaders are the Spoo’s 60mn Price Oscillator, and both Copper’s 2hr Moneyflow and 15mn Parabolics; for the 24-test basis they are the Euro’s 1hr MACD, plus Silver’s Parabolics on both the 4hr and 6hr timeframes. Today’s incoming Econ Baro metrics include (ahead of tomorrow’s key Labor report) August’s ADP Employment data and ISM(Svc) Index, July’s Trade Deficit, and the revision to Q2’s Productivity and Unit Labor Costs.
03 September 2025 – 08:20 Central Euro Time
We’ve presently the Bond, Copper and Spoo all below their respective Neutral Zones for today; none of the other BEGOS Markets are above same, and volatility is light-to-moderate; watch over the ensuing days our Market Ranges page for EDTRs to expand. The Spoo yesterday recovered the bulk of its intra-session loss; however by Market Trends, the Spoo’s “Baby Blues” of linreg consistency dropped as they are further so doing in real-time today: this is indicatively leading of the uptrend beginning a rotation from positive to negative perhaps during the course of next week; see our post yesterday on “X” ( @deMeadvillePro ) as to how low the S&P looks to go. Gold continues its run of All-Time Highs, thus far today reaching 3617, albeit today Silver has not been participating with Copper as noted being down. For the Econ Baro we’ve July’s Factory Orders; then late in the session comes the Fed’s Tan Tome.
02 September 2025 – 08:32 Central Euro Time
The BEGOS Markets’ two-day session continues, Gold having furthered its All-Time High to 3578 and Silver having traded up to one pip below 42.000 at 41.995; also above its Neutral Zone is Oil and the Bond is below same; volatility for the combined two days is largely robust, albeit the Spoo has been the least rangy of the bunch in tracing only 53% of its EDTR (see Market Ranges) given the absence of the S&P 500 not trading yesterday. As stocks commence their historically-worst month, the “live” futs-adj’d P/E of the S&P is 44.7x and by Market Values the Spoo is (in real-time) +101 points above its smooth valuation line. The Econ Baro begins its week with August’s ISM(Mfg) Index and July’s Construction Spending.
01 September 2025 – 08:41 Central Euro Time
Gold starts September with a fresh All-Time High up to 3554; The Gold Update emphasizes Silver’s recent run, price this morning up to as high as 41.64. Both precious metals along with Copper, the Euro and Swiss Franc are at present all above today’s Neutral Zones; the Bond is below same, and BEGOS Markets’ volatility is moderate-to-robust into what is a two-day session given the StateSide holiday. Amongst the five primary BEGOS components, our best correlation remains positive between the Euro and Gold. Staggered holiday halts (save for the EuroCurrencies) begin from 17:00 GMT, the all-in Tuesday session resuming across the board at 22:00 GMT.
The Gold Update: No. 824 – (30 August 2025) – “Gold Lookin’ Sporty; Silver Lovin’ Forty!”

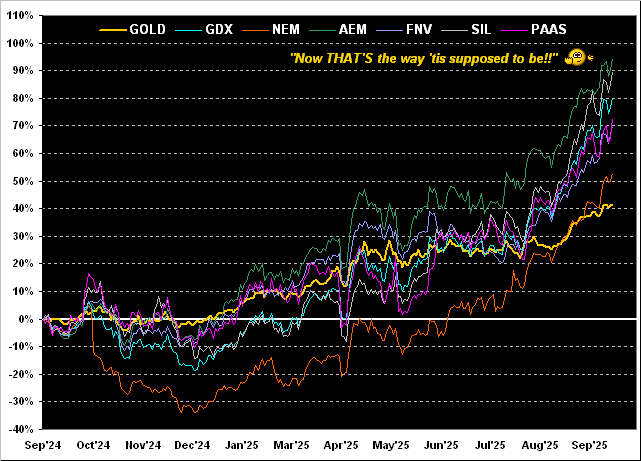
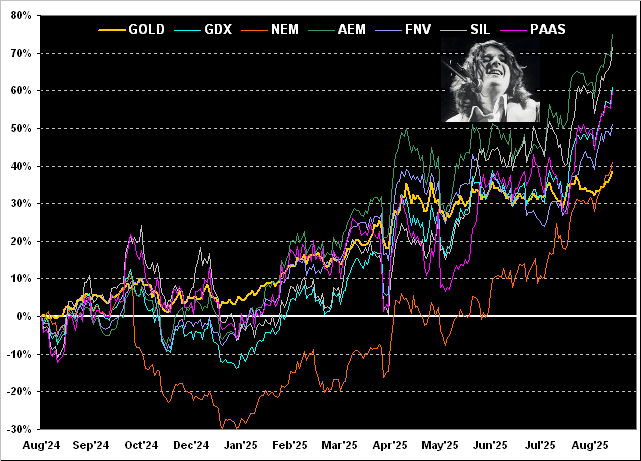
However on a happier note, let’s go to Gold’s percentage track from one year ago-to-date along with our usual top-tier precious metals equities. And from “worst-to-first” — the leverage of the equities over Gold really now standing out — they rank as: Gold itself +38%, Newmont (NEM) +41%, Franco-Nevada (FNV) +51%, Pan American Silver (PAAS) +60%, the VanEck Vectors Gold Miners exchange-traded fund (GDX) +61%, the Global X Silver Miners exchange-traded fund (SIL) +72%, and Agnico Eagle Mines (AEM) +75%. Cue Steve Miller from back in ’76: ![]() “Fly Like an Eagle”
“Fly Like an Eagle”![]() :
:
Thus into September we go with this friendly graphic reminder:
Reprised query: “Do you know where your stops are?”
Here’s to Gold and Super Stellar Silver!
Cheers!
…m…
www.TheGoldUpdate.com
www.deMeadville.com
and now on “X”: @deMeadvillePro
29 August 2025 – 08:45 Central Euro Time
At present we’ve Copper above its Neutral Zone for today; all the other BEGOS Markets are within same, and session volatility is expectedly light ahead of July’s PCE data which shall be a key determinant (12:30 GMT) as to the FOMC’s 17 September rate decision. A reduced “core” reading of +0.2% ought spike the Spoo to still further record levels, whereas a +0.4% would initiate selling; consensus calls for +0.3%. The S&P 500 yesterday settled above 6500 (6501.86) for its first time, albeit the MoneyFlow for the session actually was negative, (see S&P MoneyFlow); the futs-adj’d “live” P/E is now 46.0x. Silver seems to be making a bid to trade at $40/oz., a level not seen since 21 September 2022: indeed, Silver’s “high if an up day” for this session is 40.26; either way, more on Silver in tomorrow’s 824th consecutive Saturday edition of The Gold Update. In addition to the PCE, the Econ Baro also awaits July’s Personal Income/Spending, plus August’s Chi PMI and revised UofM Sentiment Survey.
28 August 2025 – 08:38 Central Euro Time
Both the Bond and Silver are presently above today’s Neutral Zones; Oil is below same, and BEGOS Markets’ volatility is again light. In looking at Market Rhythms for pure swing consistency, our Top Three on a 10-best basis all pertain to the Swiss Franc: its 15mn MACD, 15mn Moneyflow and 30mn Parabolics; on a 24-test basis the leaders are currently again the Swiss Franc’s 15mn Moneyflow, plus the Bond’s 30mn MACD and Gold’s 6hr parabolics. The shorter time frames of these leading Rhythms reflect the narrowing EDTRs (see Market Ranges) of late as the “Dog Days of August” wind down before what we see as a chaotic September in the offing, especially with respect to extreme equities’ overvaluation and a return to reality. Amongst today’s incoming Econ Baro metrics are July’s Pending Home Sales and the first revision to Q2 GDP.
27 August 2025 – 08:42 Central Euro Time
The Euro, Swiss Franc, Gold and Copper are all at present below their respective Neutral Zones for today; none the the other BEGOS Markets are above same, and volatility is light. Yesterday’s 27-point gain in the S&P 500 was almost all NVDA (in regressing its moneyflow contribution into S&P points): in other words had the stock been “unch”, too would have been the S&P; NVDA is currently 7.791% of the S&P with a market cap 52x its balance sheet net worth; whilst we’re really not stocks-specific, ’tis well known the company’s earnings are released post-session today, just as Friday shall have all eyes on the “Fed-favoured” PCE for July. The “live” (futs-adj’d) P/E of the S&P is 45.8x and the yield 1.197%. Nothing is due today for the Econ Baro.
26 August 2025 – 08:40 Central Euro Time
The Bond at present is the sole BEGOS Market outside (below) today’s Neutral Zone; session volatility is moderate, with Gold notably active having already traced 94% of its EDTR (see Market Ranges) before having now returned to its Neutral Zone. The Bond’s 21-day linreg trend (see Market Trends) has provisionally rotated from positive to negative, in line with increasing inflation concerns such that there is no guarantee of a 17 September FedFunds rate cut, (between now and then there being the PCE, PPI and CPI). At Market Values for the five primary BEGOS components, we’ve no extreme deviations. Copper’s cac volume has rolled from September into that for December; following suit over the next day or two shall be Silver and the Bond. The Econ Baro awaits August’s Consumer Confidence and July’s Durable Orders.
25 August 2025 – 08:17 Central Euro Time
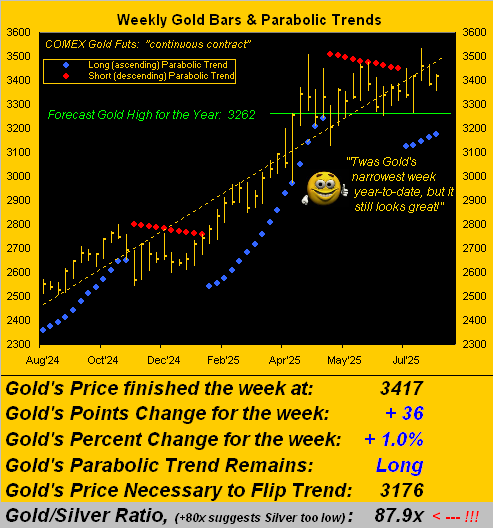
In commencing the week we’ve at present both the Bond and Swiss Franc below today’s Neutral Zones; the rest of the BEGOS Markets are within same, and session volatility is light. The Gold Update cites the yellow metal having just recorded its narrowest trading week of the year-to-date, even in the euphoria of an “assumed” FedFunds cut come 17 September, our stance to which is far more skeptical as inflation seemingly is increasing: next Friday’s PCE report for July may instill discouragement for the S&P which rallied last week to within two points (6479) of the all-time high (6481). ‘Tis a fairly busy week for the Econ Baro, beginning today with July’s New Home Sales.
The Gold Update: No. 823 – (23 August 2025) – “Gold Gains a Little; Dollar Drools Spittle; Powell Non-Committal”

To wrap, ’tis the Stack.
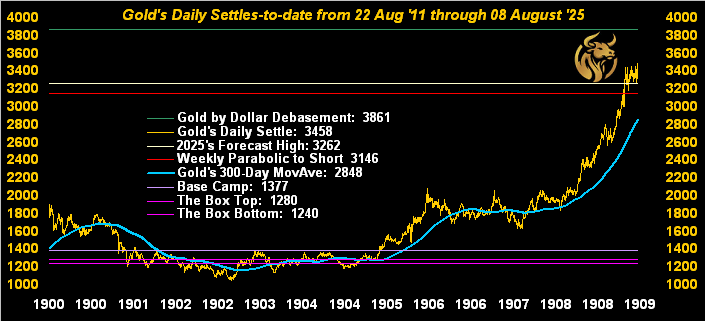
The Gold Stack (continuous contract pricing):
Gold’s Value per Dollar Debasement, (from our opening “Scoreboard”): 3864
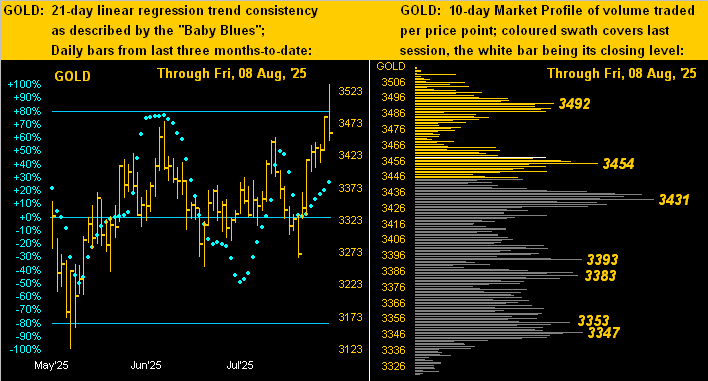
Gold’s All-Time Intra-Day High: 3534 (08 August 2025)
2025’s High: 3534 (08 August 2025)
Gold’s All-Time Closing High: 3483 (07 August 2025)
Trading Resistance: by the Profile, none of note
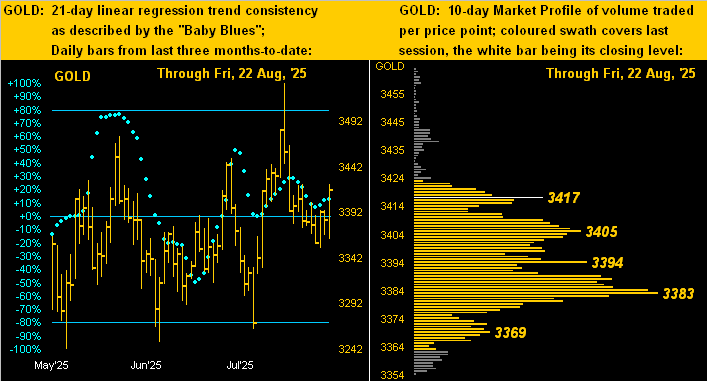
Gold Currently: 3417, (expected daily trading range [“EDTR”]: 44 points)
Trading Support: by the Profile 3417 / 3405 / 3394 / 3383 / 3369
10-Session “volume-weighted” average price magnet: 3394
10-Session directional range: down to to 3354 (from 3465) = -111 points or -3.2%
The Weekly Parabolic Price to flip Short: 3176
The 300-Day Moving Average: 2883 and rising
2025’s Low: 2625 (06 January)
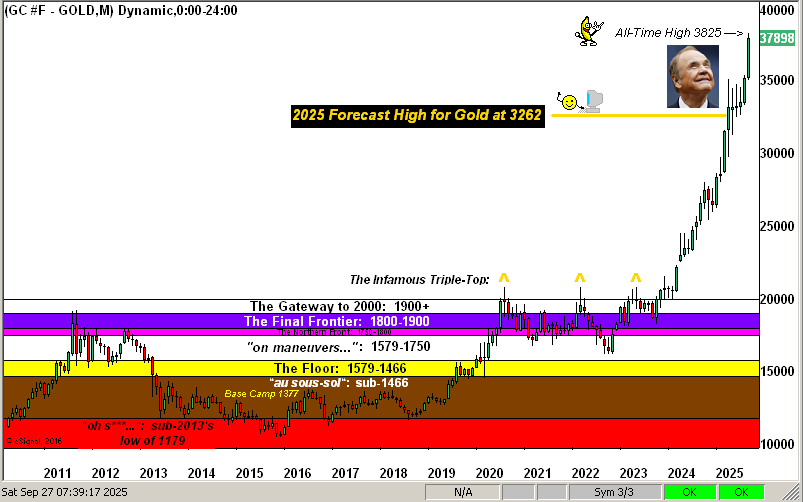
The 2000’s Triple-Top: 2089 (07 Aug ’20); 2079 (08 Mar’22); 2085 (04 May ’23)
The Gateway to 2000: 1900+
The Final Frontier: 1800-1900
The Northern Front: 1800-1750
On Maneuvers: 1750-1579
The Floor: 1579-1466
Le Sous-sol: Sub-1466
The Support Shelf: 1454-1434
Base Camp: 1377
The 1360s Double-Top: 1369 in Apr ’18 preceded by 1362 in Sep ’17
Neverland: The Whiny 1290s
The Box: 1280-1240
Next we’ve Summer’s final snoozer week for August … but for the Econ Baro robust? Or a just a bust? 12 incoming metrics are scheduled including as aforementioned on Friday “The Big One”: July’s PCE. What shall it be? One can wait and see…

Or garner more Gold if you please!
Cheers!
…m…
www.TheGoldUpdate.com
www.deMeadville.com
and now on “X”: @deMeadvillePro
22 August 2025 – 08:28 Central Euro Time
Presently we find the Euro along with Gold below their respective Neutral Zones for today, the Dollar continuing to get a bid throughout the week; the rest of the BEGOS Markets are within their Neutral Zones, and volatility — not surprisingly ahead of the FedChair’s address (14:00 ET) — is quite light. Equities may not take kindly to lack of affirmation for a FedFunds rate cut; clearly July’s PPI spike is an inflationary concern upon which we’ll again address in tomorrow’s 823rd consecutive Saturday edition of The Gold Update. Should the S&P 500 “let go” over the ensuing trading days, there is a structural support “island” spanning from 6059 down to 5767, the mid-point of which is 5913; instead should the FedChair put a rate cut on the table, we’d expect the S&P to resume rallying. The Econ Baro concluded its week yesterday, as posted on its page.
21 August 2025 – 08:33 Central Euro Time
Both the Swiss Franc and Gold are presently below today’s Neutral Zones; the other BEGOS Markets are within same, and volatility is very light. Despite the S&P 500 having made “lower lows” for three days in a row, the Index nonetheless remains technically “textbook overbought”, and obviously by any fundamental yardstick, dangerously overvalued, the fut’s-adj “live” P/E now 44.8x. Do mind an eye on the S&P MoneyFlow page: the outflow in recent days has been notably larger than the decline in the Index itself, the cumulative regressed differential for the past five sessions being -282 more flow points than actual S&P points lost; again, this is a valued leading indicator for lower levels ahead. Our best correlation amongst the five primary BEGOS components is currently positive between the Euro and Gold. And the Econ Baro concludes its own week today with metrics including August’s Philly Fed Index, plus July’s Existing Home Sales and Leading (i.e. “lagging”) Indicators.
20 August 2025 – 08:07 Central Euro Time
Presently, only the Spoo is outside (below) its Neutral Range for today; volatility for the BEGOS Markets to this time of day remains lights. Ahead of the “Friday Fed”, the S&P 500 is seemingly a bit worried of a rate cut not being soon on the table, unless July’s PPI spike was a “one-off”; the Spoo (6417) has found its Market Profile support area ’round 6414 basically holding; should 6400 break, the next volume-supportive area is 6372-6368. By our Market Rhythms for pure swing consistency, the best on a 10-test basis are currently the Bond’s 30mn Parabolics, the Swiss Franc’s daily Price Oscillator and Silver’s 4hr MACD, whilst on a 24-test basis we’ve Silver’s 1hr Price Oscillator, the Bond’s 15mn MACD and Oil’s 8hr MACD. Nothing is due for the Econ Baro; then late in the session we’ve the FOMC’s Minutes from its 29-30 July meeting.
19 August 2025 – 08:30 Central Euro Time
Silver is presently the sole BEGOS Market outside (below) its Neutral Zone for today; session volatility is again light, as has become the overall state of the BEGOS components throughout the trading day: first they’ve been on hold for UKR at White House, then for UKR allies at White House, and next at week’s-end for FedChair at Jackson Hole; thus again, the Dog Days of August are in full swing. For the Spoo (currently 6459) by its Market Profile, the volume-dominant overhead resistor is 6468, whereas it appears as “nothing but air” from here down to 6414, were some selling to ensue, albeit we don’t see much directional impetus either way until the Friday’s Fed is out of the way. Still, the S&P 500 remains beyond extremely overvalued, the “live” (fut’s adj’d) P/E 46.2x at this moment. July’s Housing Starts/Permits come due for the Econ Baro.
18 August 2025 – 08:31 Central Euro Time
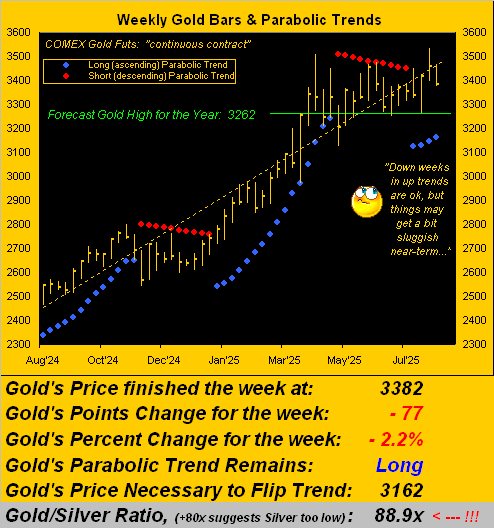
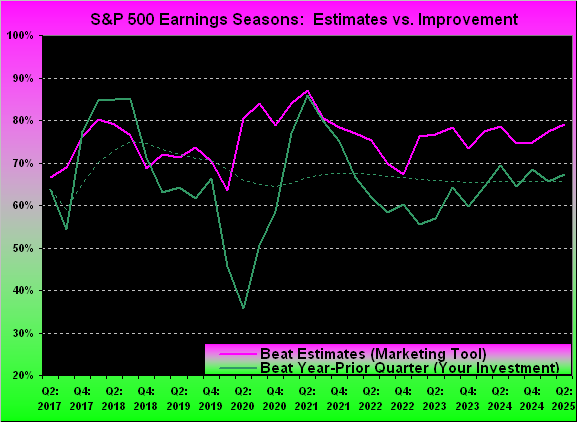
The week begins with, at present, all eight BEGOS Markets inside their respective Neutral Zones for today; session volatility is light. The Gold Update speaks to its typical “seasonal sluggishness” as we now laze through the Dog Days of August; both the weekly and daily parabolic trends for Gold remain Long, however the latter has little downside room with which to work: currently 3393, the daily “flip-to-Short” price for today is 3365, well within range given’s Gold’s EDTR (see Market Ranges) of 48 points. Q2 Earnings Seasons has concluded: for the S&P 500, whilst 79% of the constituents beat estimates, 67% actually improved from Q2 a year ago; that’s a pip above the average of 66% generally improving from 2017-to-date. For the Econ Baro ’tis a fairly muted week, starting today with August’s NAHB Housing Index.
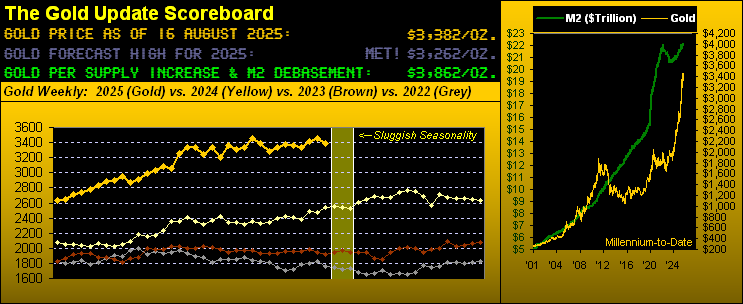
The Gold Update: No. 822 – (16 August 2025) – “Gold Sensing Seasonal Sluggishness”

To wrap, we’ve already reviewed inflation’s “Whopper of the Week“. Let us thus close with our favourite “Headline of the Week“, courtesy of Bloomy just last evening. Ready?
- “Wall Street Wrestles With Hedging Conundrum as Valuations Swell”.
Cue a pet quip of ours: “They’re just figuring this out now?” ‘Tis to laugh, but let’s try to help those floundering in Manhattan’s financial canyons. The S&P 500 settled yesterday at a near-record high 6450 with the aforementioned p/e ratio of 46.3x and paltry yield of 1.201%. What that means for you WestPalmBeachers down there is in purchasing the S&P right now, you are paying $46.30 for something that earns $1, (plus some dividend change for your usage of gas station toilets), along with the thrill of your $46.30 being halved upon the next -50% market “correction”; (recall we’ve already had two such “corrections” thus far this century). Instead, one can opt for the U.S. Treasury’s 3-month Bill currently yielding an annualized 4.112% and return of the Bill’s face value. So what’s the conundrum, eh?
“Well, you’d have to trust the U.S. Treasury’s solvency, mmb…”
Good point, Squire. So alternatively…
Got yours?
Cheers!
…m…
www.TheGoldUpdate.com
www.deMeadville.com
and now on “X”: @deMeadvillePro
15 August 2025 – 08:20 Central Euro Time
Both the Euro and Spoo are at present above today’s Neutral Zones; none of the other BEGOS Markets are below same, and volatility is again light. The Spoo has made another all-time high this morning such that should the current area hold, ‘twould pull the S&P 500 up to a record high at its open. The Bond’s “Baby Blues” (see Market Trends) of linreg consistency confirmed closing below their key +80% axis: we thus sense a run from here (114^31) down at least into the very low 114s if not the mid-113s: July’s very inflationary PPI ought make it clear for no rate cut perhaps through the balance of this year. By correlations amongst the five primary BEGOS components, the best currently is negative between the Euro and Oil, the latter for which cac volume is rolling from September into that for October. 9 metrics come into the Econ Baro today, notably including August’s NY State Empire Index and the UofM Sentiment Survey, July’s Retail Sales, Ex/Im Prices and IndProd/CapUtil, plus June’s Business Inventories. Too, ’tis the final day of Q2 Earnings Season.
14 August 2025 – 08:24 Central Euro Time
At present, all eight BEGOS Markets are within their respective Neutral Zones for today, and session volatility is light. Yesterday, further all-time highs were recorded by both the Spoo (6503) and S&P 500 (6480). By Market Rhythms (10-test basis) our top five for pure swing consistency currently Silver’s 4hr MACD, 4hr Parabolics and 1hr Price Oscillator, plus the Euro’s 2hr Price Oscillator and 30mn Parabolics. Following Gold’s Swiss tariff “Spike n’ Plunge” last Friday-Monday, trade of the yellow metal has been extremely subdued in terms of daily range: Gold’s EDTR (see Market ranges) for today is 51 points; however, Tuesday’s actual range was only 32 points and yesterday’s just 30 points. Incoming metrics for the Econ Baro today include wholesale inflation for July via the PPI.
13 August 2025 – 08:08 Central Euro Time
All-time highs have been recorded for both the Spoo (6475) and S&P 500 (6447), the latter’s “live” futs-adj’d P/E now 47.1x. Presently we’ve the same BEGOS Markets’ status as was the case ’round this time yesterday: Silver is above today’s Neutral Zone, whilst the other seven components are within same, and volatility again is quite light, (again with Silver posting the largest EDTR [see Market Ranges] tracing of 52% to this point, the average for the whole bunch being but 27%). Looking at Market Values for the five primary BEGOS entities in real-time: the Bond is +1^07 points “high” above its smooth valuation line, the Euro basically in sync with same, Gold +47 points “high” despite its recent pullback (both the daily and weekly parabolic trends still being Long), Oil +4.30 points “low” and the Spoo +159 points “high”. Nothing is due today for the Econ Baro ahead of 12 incoming metrics Thursday through Friday; and three days remain in Q2 Earnings Season.
12 August 2025 – 08:17 Central Euro Time
Silver is the sole BEGOS Market presently outside (above) its Neutral Zone for today; session volatility is quite light: the largest EDTR (see Market Ranges) tracing to this point indeed being that for Silver at 58%, the average for all the BEGOS components thus far just 29%. At Market Trends, the Bond’s “Baby Blues” have in real-time just kinked lower, albeit are still above the key +80% axis: a break below that level would likely bring still lower prices; too, the Spoo’s “Baby Blues” continue to weaken despite the on balance positive price track since last week’s low (6240); by Market Values, the Spoo in real-time at 6402 is +103 points above its smooth valuation line. And today the Econ Baro gets its own week underway with July’s retail inflation via the CPI, plus late in the session comes the Treasury Budget, (which for June was a surplus, but is expected for July to have returned to deficit status).
11 August 2025 – 08:18 Central Euro Time
At present we’ve both the Euro and Swiss Franc above today’s Neutral Zones, whilst below same are both Gold and Silver; BEGOS Markets’ volatility is light. The Gold Update highlights the weekly parabolic Long trend having now been joined by the daily parabolic Long trend; however Friday’s Swiss tariff price spike pierced Gold’s upper BollBand, such that some natural price retraction (as already we’ve seen) is natural prior to price moving on toward its next All-Time High, which by the December contract would be above 3586; and by Market Trends, Gold’s “Baby Blues” of linreg trend consistency are higher still in real-time. The Econ Baro, although quiet today, awaits 15 metrics as the week unfolds. And Q2 Earnings Season moves into its final week.
The Gold Update: No. 821 – (09 August 2025) – “Double Shot of that Golden Love”

Back in ’63, Dick Holler & the Holidays crooned a tune (penned by Don Smith and Cyril Vetter) entitled ![]() “Double Shot (Of My Baby’s Love)”
“Double Shot (Of My Baby’s Love)”![]() . The catchy piece has since been covered ‘twould seem some 5,000 times, similar to Gold’s being recognized as real money for some 5,000 years. Be that exaggerative or otherwise, we’ve just been gifted a
. The catchy piece has since been covered ‘twould seem some 5,000 times, similar to Gold’s being recognized as real money for some 5,000 years. Be that exaggerative or otherwise, we’ve just been gifted a ![]() “Double Shot of that Golden Love”
“Double Shot of that Golden Love”![]() as follows:
as follows:
- Shot One: as you regular readers already know, just back on 25 July, Gold’s weekly parabolic trend formally flipped from Short-to-Long;
- Shot Two: price’s settle this past Thursday (3483) in turn confirmed Gold’s daily parabolic trend also flipping to Long.
“I’m feelin’ the love there, mmb!”
As well we ought, Squire. Toward settling yesterday (Friday) at 3458, Gold’s “continuous contract” en route made an All-Time High at 3534, albeit that needs a bit of qualification, by which again we bullet-point three types:
- Spot Gold: is the de facto hard-money resource, the official All-Time High for which is 3500 as traded this past 22 April;
- Continuous Gold: is the chaining together of futures contracts (Gold’s most liquid trading form) such as to present (per our weekly bars graphic) a continuous history of the futures price, its new All-Time High just achieved as noted yesterday at 3534;
- December Gold: is the current so-called “front-month” futures contract, its All-Time High too achieved back on 22 April at 3586 (when June was then the “front-month”, with its 3510 high).
Regardless of which All-Time High you prefer to apply, what we now see as key is December’s 3586 being relatively short-lived (no pun) given the timing of this fresh “Double Shot of that Golden Love”, should price evolve similarly as it has by both the various weekly and daily parabolic Long trends across the past 10 years.
Recall from two missives ago our historical table of Gold’s prior 10 weekly parabolic Long trends having produced average upside price follow-through of +10%, which applied to this stint would find Gold well up into the 3600s. And per our Market Rhythms’ analyses, Gold’s best study for pure swing consistency is its daily parabolics, presently ranked (on a 24-test basis) at No.1 of the 405 rhythms tested nightly.
All of which in an encapsulated Golden nugget means we anticipate still higher highs through these ensuing weeks.
That stated, even the best markets’ analyses are no holy grail, provably as signals can — and do — fail. To wit, beware of John Bollinger and his Band(s). The following graphic depicts December Gold by the day from this past April-to-date. The two encircled rightmost wee blues dots are, of course, the commencement of this new daily parabolic Long trend for Gold. However, we’ve also applied the two violet Bollinger Bands, the upper through which — at Friday’s open — price penetrated (thank you StateSide tariff on Swiss Gold … see our close). Therein, note price’s imminent decline per the white lines after such prior upside penetrations:
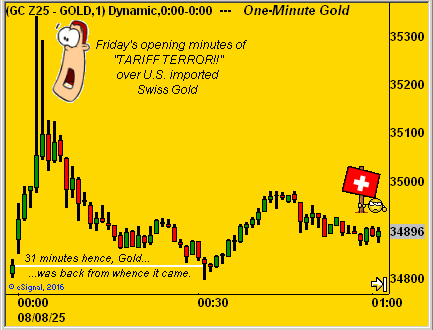
As teased, let’s close with the high-drama event of the week: the evoking of “Tariff Terror!” on Gold bars of both one kilogram and 100 ounces imported from Switzerland into the U.S. And with the utmost respect for our beloved Swiss family to the north of us, we had to chuckle. We don’t know how many folks StateSide regularly engage in buying 1kg bars of Swiss Gold (currently $122k/bar + 39% tariff = $170k/bar), let alone nearly triple that for a 100/oz. bar. Regardless, our mobile phone here lit up with chaotic panic over the 39% imposition, (for which ’tis now said may be misinterpreted).
‘Course, unlike today’s FinMedia, the late great Paul Harvey would have additionally reported to us “the rest of the story”. To be sure, after having settled Thursday at 3482, four minutes into Friday’s session found Gold having spiked +1.5% to the aforementioned new “continuous contract” All-Time High of 3534. But “left out of the story” was that 31 minutes into the session, Gold was back down to where it had ended Thursday. Further, the Swiss Franc was completely docile over it all, trading just 54% of its EDTR (“expected daily trading range”) on Friday. As for Gold, here is Friday’s first hour of trading by the minute, courtesy of the “If You Blinked, You Missed It Dept.”:
Either way, our double-shot bottom line is: do not miss out in owning Gold, and Silver too with $40/oz. in view!
Cheers!
…m…
www.TheGoldUpdate.com
www.deMeadville.com
and now on “X”: @deMeadvillePro
08 August 2025 – 08:25 Central Euro Time
As expected, Gold confirmed its daily Parabolics flipping to Long per yesterday’s close, following which at this morning’s open price briefly swiftly spiked from 3488 to 3534, which by the “continuous contract” is a new All-Time High; more of course in tomorrow’s 821st consecutive Saturday edition of The Gold Update. For the present, Gold is above its Neutral Zone for today, whilst below same is the Euro; session volatility for the BEGOS Markets is pushing toward moderate, aided by Gold having already traced 111% of its EDTR (see Market Ranges). Yesterday’s MoneyFlow into the S&P 500 was +1.5% vs. the actual Index’s change of just +0.1%: this has been a hallmark of Q2 Earnings Season wherein “estimates” quite regularly are being beaten, even as actual earnings improvement has been but average; there remains one more week to run for Q2 results. As noted yesterday, the Econ Baro already has concluded its week., which on balance was negative.
07 August 2025 – 08:28 Central Euro Time
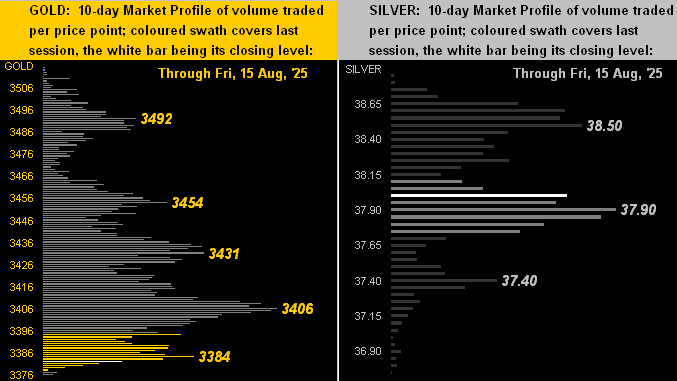
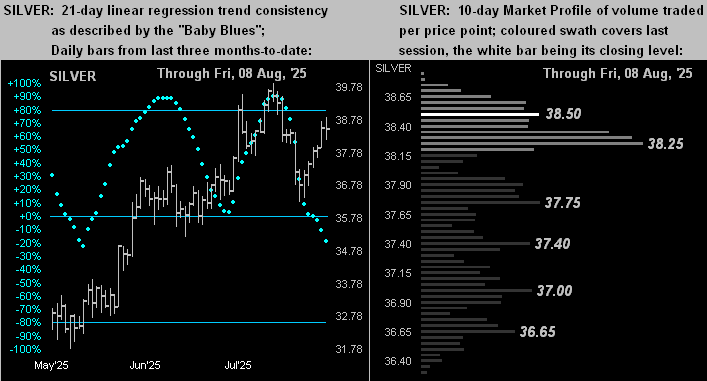
Gold, Silver and Oil all are at present above today’s Neutral Zones; none of the other BEGOS Markets are below same, and session volatility is light. For the Precious Metals, Gold (3449) is above its most volume-dominant Market Profile supporter (3431), whilst Silver (38.25) is just below its most volume-dominant Market Profile resistor (38.30); on a broad-term basis, the white metal remains attractively priced vis-à-vis the yellow metal give the Gold/Silver ratio now 90.1x; on a 10-test basis for pure Market Rhythm swing consistency the best for Gold currently is its 15mn Price Oscillator, whereas for Silver ’tis her 4hr MACD. Our best overall Market Rhythm on a 10-test basis is the Swiss Franc’s 6hr Moneyflow, and on a 24-test basis ’tis Gold’s daily Parabolics which likely confirm a flip from Short-to-Long at tonight’s settle. The Econ Baro concludes its week today (Thursday) with five incoming metrics, notably including Q2’s Productivity and Unit Labor Costs along with Wholesale Inventories for June; then late in the session comes that month’s Consumer Credit.
06 August 2025 – 08:28 Central Euro Time
We’ve presently both Oil and the Spoo above today’s Neutral Zones; the rest of the BEGOS Markets are within same, and volatility is very light, the average EDTR (see Market Ranges) tracing to this point just 26%. At Market Trends, 3 of the 8 BEGOS Components are in 21-day linreg up trends: the Bond and Gold with reinforcement as their “Baby Blues” of trend consistency too are rising, along with the Spoo, albeit there the “Baby Blues” continue to drop; the other five markets are thus in downtrends. As to the Bond’s rally of late, by both Market Values and Market Magnets, price is better than 1.5 points above those measures, although that is not what we’d consider an “extreme” deviation; but the Bond has been getting the bid given its far better yield over the S&P 500 which price-wise we consider to view as close to the edge. Nothing is due today for the Econ Baro; and this “average” (by improvement) Q2 Earnings Season has another 8 trading days to run.
05 August 2025 – 08:18 Central Euro Time
Both the Euro and Swiss Franc are presently below their respective Neutral Zones for today; the balance of the BEGOS Markets are within same, and volatility is light. EDTR (see Market Ranges) tracings to this moment range from 47% for the Swiss Franc down to just 10% for Copper. Amongst the five primary BEGOS components, the best correlation currently is positive between the Bond and Gold: per their Market Rhythms on a 10-test basis, the Bond’s best for pure swing consistency is presently the 12hr MACD, whilst for Gold ’tis the 30mn MACD; and by Market Values, both the Bond and Gold are above their smooth valuation lines. The Econ Baro looks to July’s ISM(Svc) Index, plus June’s Trade Deficit.