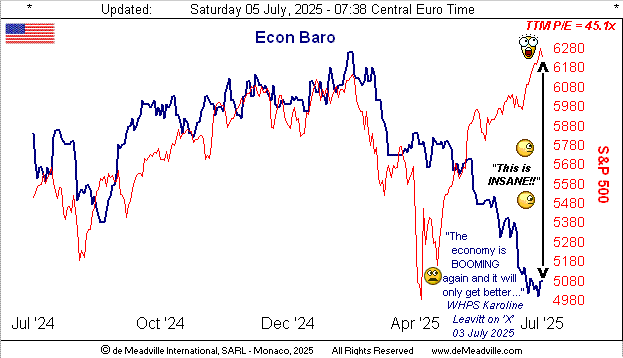
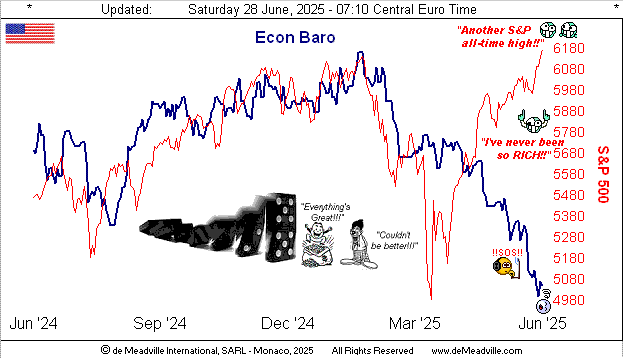
The Bond, Euro and Swiss Franc are presently below today’s Neutral Zones, whilst above same is the Spoo; session volatility for the BEGOS Markets is moderate. The Gold Update reviews the recent turbulence within The Metals Triumvirate, plus assesses if the S&P 500 has at long last reached a significant turning point to substantively lower levels, albeit as noted the Spoo is rising thus far today even as its “Baby Blues” of trend consistency are in full plunge (see Market Trends); currently 6291, the Spoo’s Market Profile support is 6264 with major overhead volume-dominant resistors at 6345, 6371 and 6406. Two weeks remain in Q2 Earnings Season with year-over-year quarterly improvement just a tad below average. And ’tis a relatively quiet week for the Econ Baro, beginning today with June’s Factory Orders.
 Mark
Mark
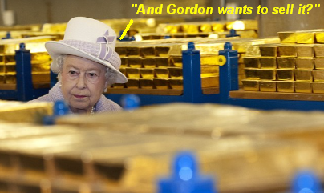
The Gold Update: No. 820 – (02 August 2025) – “Turbulence in The Metals Triumvirate”


Naturally it being month-end, plus one trading day, here is the monthly Gold Structure for the past 15 years. The rightmost green bar is merely Friday (yesterday) alone, it having been 01 August. ‘Tis been quite the run for Gold across this time frame, ‘specially after only just two-to-four years ago when Gold’s infamous Triple-Top pricing was ![]() “Dancing on the ceiling…”
“Dancing on the ceiling…”![]() , –[Lionel Richie, ’86]:
, –[Lionel Richie, ’86]:

Metals turbulence notwithstanding, next week is a bit more benign for the Econ Baro with just eight metrics due, including improved (purportedly) Productivity for Q2. Are you productively maintaining a sound supply of Gold?
Cheers!
…m…
www.TheGoldUpdate.com
www.deMeadville.com
and now on “X”: @deMeadvillePro
01 August 2025 – 08:22 Central Euro Time
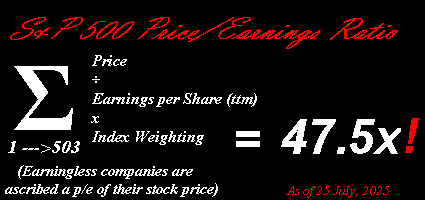
The Swiss Franc is the sole BEGOS Market at present outside (below) its Neutral Zone for today; session volatility is light. Although the S&P 500 recorded a third consecutive modest down day yesterday, per our page of the Index’s MoneyFlow, such measure remains positively robust, despite our overwhelming sense of a significant correction being nigh. In real-time at Market Trends, the Spoo’s “Baby Blues” have again broken below the key +80% axis: recall their last so doing (18-22 July) was an unusual “failed signal” for this otherwise reliable leading indicator of near-term market direction. As for correlation within the five primary BEGOS components, our best at present is negative between the Euro and Oil. The Econ Baro concludes its busy week with July’s Payrolls data, ISM Index and revised UofM Sentiment Survey, plus June’s Construction Spending. And with essentially two weeks remaining in Q2 Earnings Season, S&P 500 year-over-year quarterly improvement is now up to 66%, which is an average rate, the fly in the ointment of course being the harrowingly-high “live” P/E at a futs-adj’d 47.5x.
31 July 2025 – 08:26 Central Euro Time
Copper is further falling this morning: netting a loss yesterday of -18.3% following tariff implications, the red metal is now down an additional -5.1%, obviously below its Neutral Zone for today, as is Oil; above same are the Bond, Euro, Swiss Franc, Gold and the Spoo; BEGOS Markets’ volatility is moderate. Going ’round the Market Values horn of the five primary BEGOS components in real-time: we’ve the Bond basically in sync with its smooth valuation line, the Euro as -0.026 points “low”, Gold as -13 points “low”, Oil as +1.84 points “high”, and the Spoo as +258 points “high”; the S&P 500 itself is now 26 consecutive days “textbook overbought” and the futs-adj’d P/E now a whopping 48.0x. ‘Tis a key inflation day for the Econ Baro featuring for June “Fed-Favoured” PCE data, plus Personal Income/Spending; too due is July’s Chi PMI and Q2’s Employment Cost Index.
30 July 2025 – 08:29 Central Euro Time
As was the case ’round this hour yesterday, all eight BEGOS Markets are presently within today’s Neutral Zones; volatility is light. By Market Trends, yesterday both Silver and Copper confirmed their “Baby Blues” of trend consistency having fallen below the key +80% such that we anticipate lower prices near-term. Per Market Rhythms for pure swing consistency, our best on a 10-test basis currently is the Swiss Franc’s 6hr Moneyflow, whilst on a 24-test basis ’tis Gold’s daily Parabolics. The S&P 500 despite yesterday’s mild down session nonetheless recorded a fourth consecutive day as being “extremely textbook overbought”: with so much on the table through the balance of this week, we expect the Index to crack at any time. And today, the Econ Baro looks to July’s ADP Employment data, June’s Pending Home Sales, plus the first peek at Q2 GDP, which — give the steep decline in the Baro notably for April and May data — shan’t be up to the +2.5% consensus expectation. Then come 18:00 GMT is the FOMC’s Policy Statement within which there shan’t be a FedFunds’ rate change.
29 July 2025 – 08:27 Central Euro Time
All eight BEGOS Markets are at present within their respective Neutral Zones for today, and session volatility is very light with 18 Econ Baro metrics plus the FOMC in the balance of the week. Gold’s cac volume is rolling from August into that for December with +57 points of fresh premium. The S&P 500 is now “textbook overbought” through its last 24 sessions, indeed “extremely” so for the past 3: we sense the Index is very close to a significant correction, especially with all that’s on the able as noted over these next four days; the futs-adj’d “live” P/E of the S&P is currently 47.7x and the yield 1.204% vs. the 3-month T-Bill’s annualized 4.235%. The Econ Baro gets its data parade rolling today with July’s Consumer Confidence.
28 July 2025 – 08:41 Central Euro Time
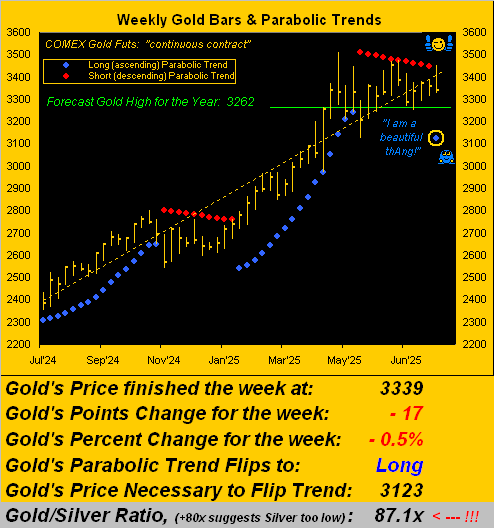
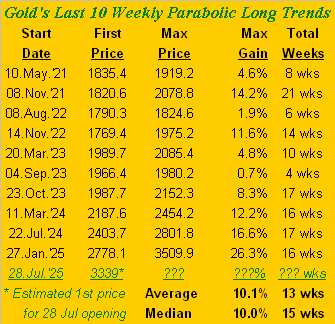
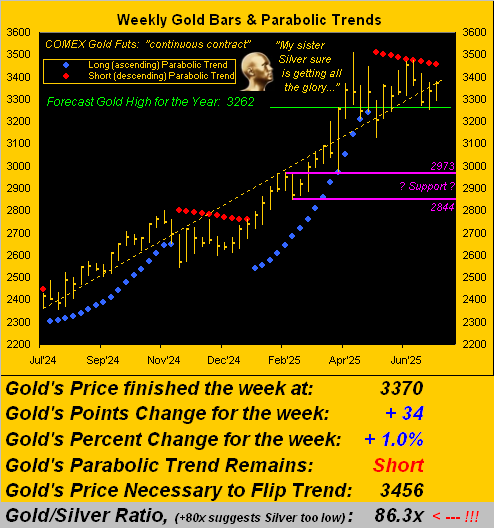
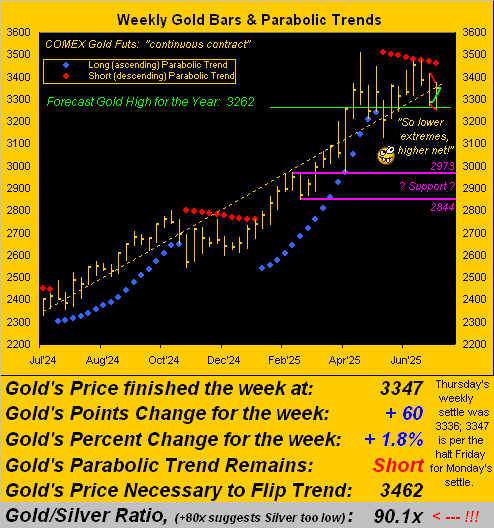
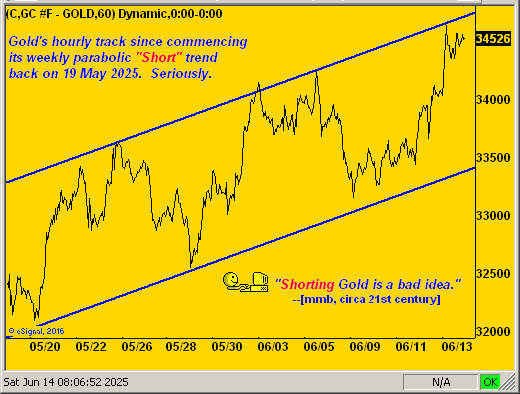
Presently the Euro and Swiss Franc are below today’s Neural Zones, whilst above same are both Oil and the Spoo; session volatility for the BEGOS Markets is firmly moderate. The Spoo gapped up some +21 points at the open on tariff resolution: that puts the “live” futs-adj’d P/E at of the S&P at now 47.7x. The Gold Update confirms price’s weekly parabolic trend as having flipped from Short-to-Long, the opening price of the new stint effective this morning’s opening trade at 3321; acknowledged therein is Gold’s negative MACD stance also on the weekly timeframe, but that its performance has been a net failure per the last five signals, whereas the last five parabolic Long trends have been a net success. ‘Tis a very busy week for the Econ Baro with 18 metrics due, however none for this session.
The Gold Update: No. 819 – (26 July 2025) – “Gold Ends Its Short Spell; But Then Falls Pell-Mell”


And to be sure, there’s a lot on the mid-summer table to affect the price of Gold. Most imminently, next Wednesday (30 July) brings The Big Double-Whammy of StateSide Q2 Gross Domestic Product followed by the Federal Open Market Committee’s Policy Statement. Then two days hence brings 01 August and the introduction of more “Trump Tariffs!”
Too, there’s this from the “Oh By The Way Dept.” ‘Tis time for the U.S. Treasury to spritely come up with $7T to pay its noble holders of maturing Bills, Notes and Bonds. According to “AI” (“Assembled Inaccuracy”), as of this year’s Q1, operating cash amounted to about $406B, which combined with other monetary assets totaled a tad over $1T for 2024. Thus by your six-year-old’s first grade arithmetic, the Treasury is about -$6T short of its looming funding requirements.
So who or what is going to buy all this requisite new debt? Here’s a thought: remember that (as we herein mathematically constructed) “all” $7T of the COVID monetary “creation” essentially found its way into the S&P 500. So, why not have the Treasury thus promote a “group sell” of $7T in stocks with the proceeds moving into debt at its currently attractive rates? ‘Tis so easy, a WestPalmBeacher can do it.
“But mmb, that might crash the stock market…”
The stock market, Squire, is so overdue for a harrowing crash, be it driven fundamentally, technically and/or quantitatively, a “group sell” to save the U.S. Treasury would be the perfect crash catalyst.
But with respect to Gold (and barring such selling of stocks), should the ensuing Treasury auctions be feeble, ‘twould fall to the Fed being forced to make that next BIG accounting entry to buy up the difference. And Gold, in turn, would go upside gonzo nuts (again, a technical term).
Speaking of stocks, we’ve run out of ways to indeed express (purposeful repeat) how we’ve run out of ways to describe the LooneyTunes overvaluation of the S&P 500. During recent years, we’ve herein detailed in-depth (using what is today an unknown science called “math”) sensible scenarios for the “Look Ma! No Earnings!” crash and the “Look Ma! No Money!” crash. Now let’s add to those the “That’s All, Folks!” crash, wherein upon it all going wrong, the market doesn’t so much crash as instead ’tis just closed, (rather akin to the “Look Ma! No Money!” crash). Then again the Fed can create the difference and ’tis more upside gonzo nuts for Gold.
As to the current state of the S&P, ’tis now 23 consecutive trading days “textbook overbought”, as well as having arrived at our “extremely overbought” classification with a sub-par Q2 Earnings Season in process. Oh yes, we saw the CNBC[S] end-of-week headline last evening: “S&P 500 posts fifth straight record close this week, powered by solid earnings”. Hardly are earnings “solid”. To wit:
In this era of dumbing-down earnings estimates to dirt, ’tis super easy to beat ’em: so far for Q2, we’ve 149 S&P 500 constituents having reported, of which 79% have exceeded expectations! Why typically, only 76% so do! Sadly however, here’s where the “solid” earnings hocus-pocus loses focus. In an average Earnings Season, 66% of the constituents improve their bottom lines over the like quarter of a year earlier. To this point for Q2, such rate has slowed to 63%. ‘Course that shan’t be on CNBS, Bloomy nor FoxyB. But ’tis why the following multiple has gone beyond stoopid:
Again, don’t argue nor ask “AI“; just do the math. And per last week’s piece, yes, we still sense “The Sell” shall be ever-intense.
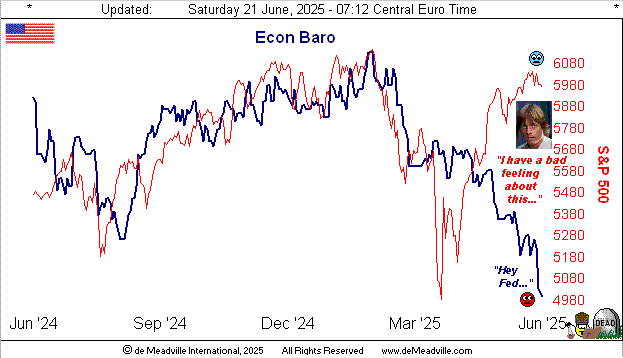
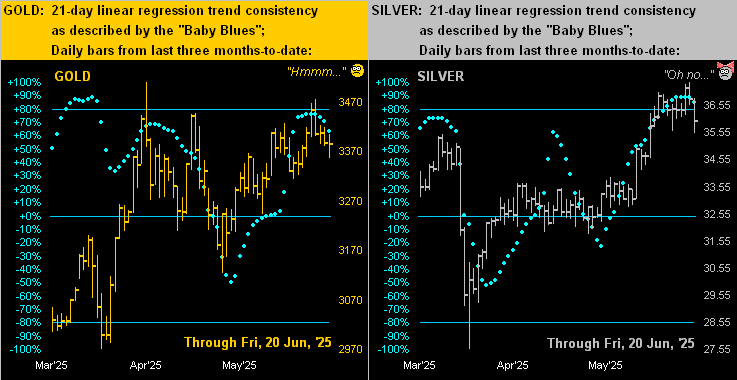
As to the math that makes up the Economic Barometer, as anticipated, ’twas well ahead of last Monday’s lagging indicator known as the Conference Board’s “Leading Indicators”. So severe had been June’s Econ Baro plunge, we knew the consensii for just -0.1% shrinkage in the June reading was too timid: rather, it came in (no surprise) at -0.3%. Too, the month’s Existing Home Sales slowed and Durable Orders shrank. But bailing the Baro out by just the wee-est of bits was growth in June’s New Home Sales, plus a reduction in the prior week’s Initial Jobless Claims. So below, we’ve the whole picture from one year ago-to-date. Duly therein note the insert of the S&P 500 futures chart for the past month (21 trading days): we made such a song-n’-dance a week ago about the baby blue dots of trend consistency being finally in decline … but they’ve suddenly lurched back up (per the three red dots). “Perfect timing ain’t easy…”:
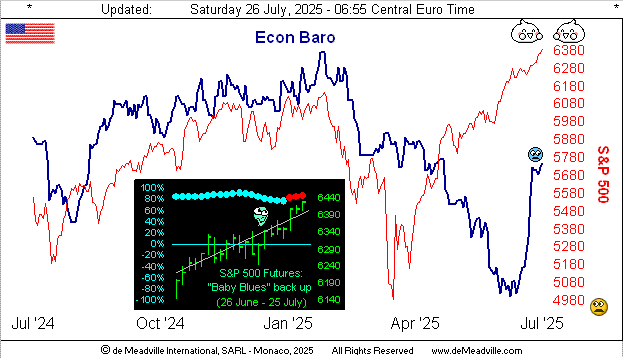
We see next week as pivotal for both Gold and the S&P. Inclusive of the GDP, the FOMC and the renewed tariffs spree come 18 metrics for the Econ Baro’s scrutiny. As well, Gold’s contract volume rolls from that for August into that for December with better than +50 points of fresh premium, merci! Where might your money be?

Cheers!
…m…
www.TheGoldUpdate.com
www.deMeadville.com
and now on “X”: @deMeadvillePro
25 July 2025 – 08:39 Central Euro Time
Gold is presently below its Neutral Zone for today; the other BEGOS Markets are within same, and again volatility is light. The Spoo continues to make all-time highs, today (to this point) having reached 6421; currently at 6414, accounting for Fair Value (+36) would pull the S&P 500 higher still at its opening to 6378, just short of its all-time high yesterday of 6381. The S&P is now “extremely textbook overbought” meaning that each of its BollBands, RSI and Stochastics are stretched as such; this last occurred just on 03 July, the following trading day (07 July) then finding a intraday -78-point drop in the S&P. Tomorrow’s 819th consecutive Saturday edition of The Gold Update shall cite the weekly parabolic trend as having flipped from Short-to-Long despite price intraweek having dropped nearly -100 points high-to-low. And the Econ Baro closes out its mild week with June’s Durable Orders.
24 July 2025 – 08:39 Central Euro Time
Both Gold and Silver are presently below today’s Neutral Zones, whilst above same are both Copper and Oil; BEGOS Markets’ volatility is light. Currently our best correlation amongst the five primary BEGOS components is positive between the Bond and Gold. We continue to monitor Market Trends’ “Baby Blues” for the Spoo which have popped back above the key +80% axis: but by Market Values, the Spoo is (in real-time) +269 points above its smooth valuation line, whilst the S&P 500 itself is now “textbook overbought” through its last 21 days; the futs-adj’d “live” P/E is 47.0x even as Q2 Earnings are thus far underperforming their average year-over-year pace of improvement. Today’s Econ Baro incoming metrics include June’s New Home Sales.
23 July 2025 – 08:33 Central Euro Time
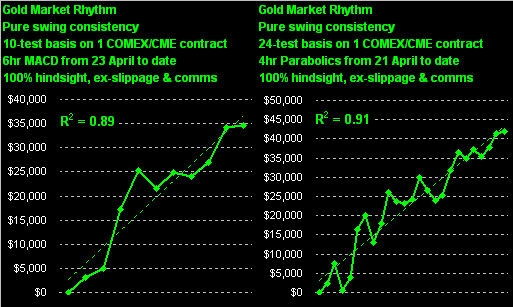
Gold’s weekly parabolic Short trend has — after 10 weeks — provisionally flipped to Long as 3449 traded early on at 00:21 GMT; confirmation comes at Friday’s settle, (barring 3123 unlikely trading in the interim). Presently, we’ve the Bond, Euro and Swiss Franc all below their respective Neutral Zones for today; the other BEGOS Markets are within same, and volatility is pushing toward moderate. For the S&P 500, not recognizable in yesterday’s +0.1% gain was a cap-weighted -$62B drain alone from NVDA: mind our S&P Moneyflow page. At Market Trends, the Spoo’s “Baby Blues” of linreg consistency have exceptionally in real-time lurched from +76% to +81%: however, they soon ought well sink sub-80% toward price selling off. Looking at Market Rhythms, on a 10-test basis our leader in the non-BEGOS Yen’s 2hr Parabolics, whilst on a 24-test basis we additionally note the Spoo’s 15mn Parabolics and Gold’s 6hr MACD. June’s Existing Home Sales come due for the Econ Baro.
22 July 2025 – 08:32 Central Euro Time
Apologies as there was a delay in getting yesterday’s commentary posted; ’tis been resolved and is there now. On to today, our key thought is ’tis amazing that 34 of the past 39 monthly Leading Indicators reports have been negative, the pace of earnings improvement weakening, and yet the S&P 500 is making all-time highs: fairly startling stuff. At present this Tuesday, Gold is the only BEGOS Market outside (below) today’s Neutral Zone; session volatility is light. The Spoo’s “Baby Blues” (see Market Trends) of linreg consistency continue to slip, however slightly, the real-time reading now +76%: as regular followers know, having gone beneath the +80% axis generally leads to lower prices near-term. Nothing is due today for the Econ Baro. And as to the noted weakening Q2 Earnings Pace, for the 47 S&P constituents having thus far reported, just 62% have bettered their bottom lines from the like quarter a year ago; such improvement through the years averages 66%. We sense the S&P is quite near “The Sell”.
21 July 2025 – 08:47 Central Euro Time
Into a light economic data week we go with at present the Bond, Gold and Copper above today’s Neutral Zones; none of the other BEGOS Markets are below same, and volatility is pushing toward moderate. The Gold Update describes price as being in a shell these many weeks, the weekly parabolic flip from Short-to-Long now at 3449; too, we emphasize the Spoo’s “Baby Blues” (see Market Trends) as having fallen below the key +80% level: they are lower still today thus far in real-time, such that lower prices ought well appear near-term; the Spoo is currently +246 points above its smooth valuation line (see Market Values). The Econ Baro awaits June’s Leading (i.e. “lagging”) Indicators, which not surprisingly are expected to remain negative, albeit the Baro had a record-setting boost in the past two weeks (as cited in The Gold Update).
The Gold Update: No. 818 – (19 July 2025) – “Gold Stuck in Its Shell; Here Comes the S&P’s Sell”

With Gold’s weekly parabolic trend still Short — uncannily so given there’s not been a wit of substantive price decline throughout — we open with British band Ace from back in ’75: ![]() “How lonnng… has this been goin’ onnn…”
“How lonnng… has this been goin’ onnn…”![]() , such pop hit reaching Billboard’s Hot 100 No. 3 slot on Saturday, 05 April of that year, with Gold having settled the day before at 174.
, such pop hit reaching Billboard’s Hot 100 No. 3 slot on Saturday, 05 April of that year, with Gold having settled the day before at 174.
Fast forward to Gold having settled yesterday (Friday) at 3356 and ’tis a 50-year price increase of +1,829% … just in case you’re scoring at home.
‘Course, compared to the 1¢ cost in 1975 for one piece of Bazooka Bubble Gum, such piece today is bulk-marketed for 24¢, an increase of +2,300%: thus Gold is lagging bubble gum inflation.
“And mmb, by the money supply, it’s about that too, eh?”
Similarly so, Squire. The StateSide “M2” money supply for April 1975 was $935B. From then to today at $22T, ’tis +2,253%. So by either measure, “Got Gold?”
But as to our query via Ace for the duration of Gold’s current weekly parabolic Short trend, note a 10th rightmost red dot having now appeared on the weekly bars from a year ago-to-date. Indeed, Gold appears ever so stuck it its shell of late:


So with Gold still stuck in its shell but the S&P poised for a sell, let’s look at the Stack, for ’tis just swell:
The Gold Stack
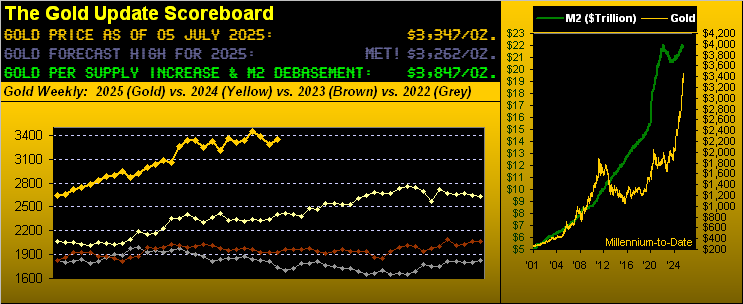
Gold’s Value per Dollar Debasement, (from our opening “Scoreboard”): 3853
Gold’s All-Time Intra-Day High: 3510 (22 April 2025)
2025’s High: 3510 (22 April 2025)
Gold’s All-Time Closing High: 3453 (13 June 2025)
The Weekly Parabolic Price to flip Long: 3449
10-Session directional range: up to to 3389 (from 3291) = +98 points or +3.0%
Trading Resistance: by the Profile 3359 / 3370 / 3381
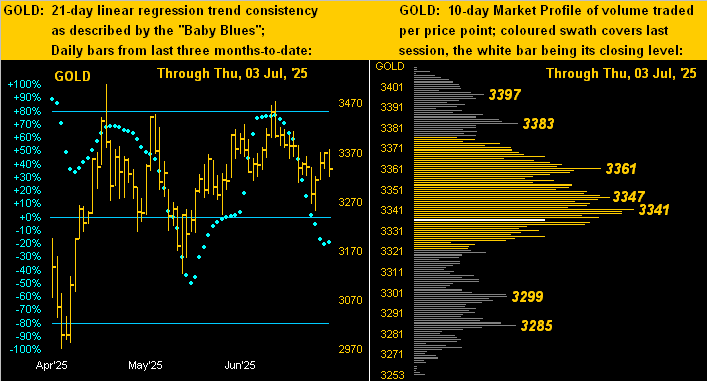
Gold Currently: 3356, (expected daily trading range [“EDTR”]: 46 points)
Trading Support: by the Profile 3345 / 3334 / 3320 / 3311
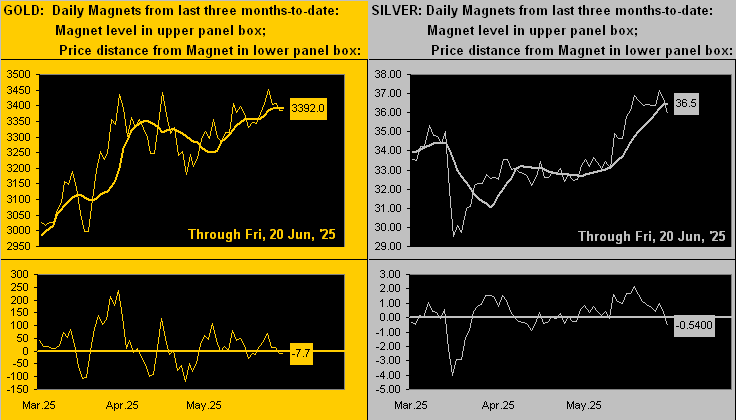
10-Session “volume-weighted” average price magnet: 3342
The 300-Day Moving Average: 2798 and rising
2025’s Low: 2625 (06 January)
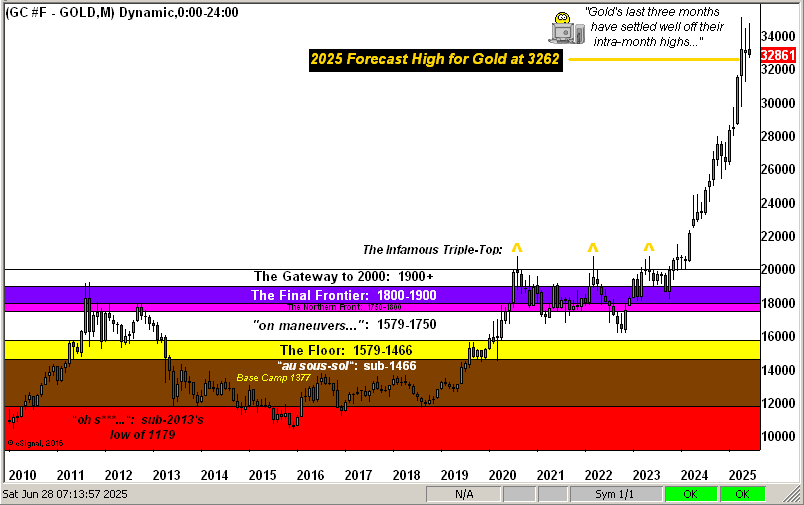
The 2000’s Triple-Top: 2089 (07 Aug ’20); 2079 (08 Mar’22); 2085 (04 May ’23)
The Gateway to 2000: 1900+
The Final Frontier: 1800-1900
The Northern Front: 1800-1750
On Maneuvers: 1750-1579
The Floor: 1579-1466
Le Sous-sol: Sub-1466
The Support Shelf: 1454-1434
Base Camp: 1377
The 1360s Double-Top: 1369 in Apr ’18 preceded by 1362 in Sep ’17
Neverland: The Whiny 1290s
The Box: 1280-1240
Into the new week can the Econ Baro seek a further peak? Probably not, although neither should it succumb much, if at all: just five metrics come due, Monday most notably bringing for June the Conference Board’s lagging indicator known as “Leading Indicators”. Expectations are for the reading to remain negative as ’twas for May: no argument here.
As for our anticipated S&P 500 correction, here are a few P/E nuggets to bear in mind:
- The day before the Garzarelli Crash of ’87 the P/E was 20.3x;
- The day before commencement of the DotComBomb of ’00-’02 the P/E was 29.3x;
- The day before the start of the FinCrisis of ’07-’09, the P/E was 18.7x.
As aforementioned, ’tis now 46.9x, the S&P yielding less than one-third that of the “riskless” U.S. T-Bill.
Note: math-challenged “AI” (“Assembled Inaccuracy”) puts the S&P’s P/E at 25.9x … wrong. (Just wait until “AI” gets its hands on your discretionary portfolio. Reprise: Whoopsie!)
So to wrap:
Query One: “Do you know where your stocks’ stops are?”
Query Two (again): “Got Gold?“
Cheers!
…m…
www.TheGoldUpdate.com
www.deMeadville.com
and now on “X”: @deMeadvillePro
18 July 2025 – 09:21 Central Euro Time
The Euro, Silver and Copper are at present above today’s Neutral Zones; the other BEGOS Markets are within same, and volatility is mostly light. The Spoo’s “Baby Blues” (see Market Trends) are basically on their key +80% axis: an up day likely keeps the Short signal at bay through today; both the Spoo and S&P 500 itself yesterday recorded all-time highs both intra-day as well as for settles; the S&P is 17 days “textbook overbought” through yesterday, and the futs-adj’d P/E is presently 46.9x; per usual, the “Baby Blues” shall alert us to the next downside move. Whilst there’s quite a bit of jubilation early on in Q2 Earnings Season over companies having beaten estimates (85% thus far for S&P 500 constituents), only 64% (a below average pace) have actually bettered their bottom lines from the like quarter a year ago. The Econ Baro wraps its robust upside week with July’s UofM Sentiment Survey, plus June’s Housing Starts/Permits.
17 July 2025 – 08:43 Central Euro Time
Presently, the Euro, Swiss Franc and Gold all are below today’s Neutral Zones; none of the other BEGOS Markets are above same, and session volatility is pushing toward moderate. Amongst the five primary BEGOS components, the best correlation currently is positive between the Bond and Euro. Per yesterday’s comment, the Spoo’s “Baby Blues” (see Market Trends) are in real-time down to the +80% axis: confirmation of breaking below that level reasonably suggests a near-term run into the lower 6100s, (current price 6310); of note, the “live” P/E of the S&P 500 (futs-adj’d) is 46.5x. And ’tis a very busy day for the Econ Baro with eight metrics due, including July’s Philly Fed and NAHB Housing Indices, June’s Retail Sales and Ex/Im Prices, plus May’s Business Inventories.
16 July 2025 – 08:21 Central Euro Time
Gold is the sole BEGOS Market at present outside (above) today’s Neutral Zone; session volatility is very light. Per Market Rhythms, our current leaders for pure swing consistency are (on a 10-test basis) Gold’s 6hr Parabolics, and (on a 24-test basis) Oil’s 15mn MACD, Gold’s 6hr MACD, and the non-BEGOS Yen’s 2hr Parabolics. Although both the S&P 500 and Spoo yesterday reached intra-day all-time highs, the Spoo’s “Baby Blues” (see Market Trends) are slipping in real-time to the +83% level: should they settle below the key +80% axis level come tomorrow or Friday, ‘twould be an outright sell signal; too, the anticipated price declines as herein noted are in progress given recent like signals for the Bond, Euro and Swiss Franc. Oil’s cac volume is rolling from August into that for September. The Econ Baro awaits June’s PPI and IndProd/CapUtil. And late in the session is the release of the Fed’s Tan Tome.
15 July 2025 – 08:25 Central Euro Time
The Euro, Gold and the Spoo are at present above their respective Neutral Zones for today; the balance of the BEGOS Markets are within same, and session volatility is mostly light, save for Gold having traced 52% of its EDTR (see Market Ranges). The Spoo is teasing an all-time high toward 6336: the “live” (futs-adj’d) P/E of the S&P 500 is 46.2x with a yield of 1.228%; that for the 3mo. U.S. T-Bill annualized is 4.228%. The Spoo by Market Values in real-time is +216 points above its smooth valuation line and the S&P itself is now “textbook overbought” through the last 14 trading days. The Econ Baro gets its busy week underway with July’s NY State Empire Index, plus June’s CPI which is expected to have heated up.
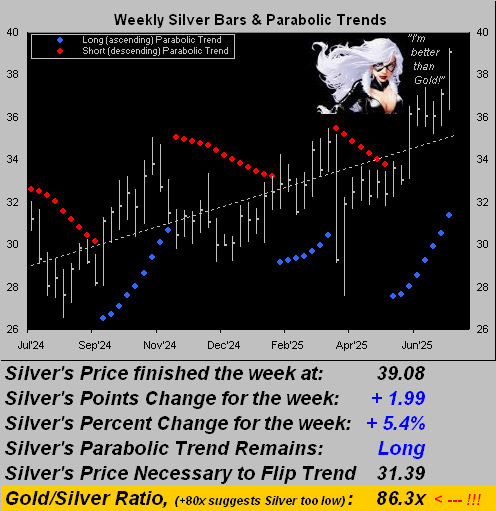
14 July 2025 – 08:40 Central Euro Time
The week is off and running with at present the Euro and Spoo below today’s Neutral Zones, whilst above same is Silver, the star of The Gold Update; BEGOS Markets’ volatility is light-to-moderate. As anticipated, the Swiss Franc’s “Baby Blues” (see Market Trends) of linreg consistency confirmed on Friday having fallen beneath their key +80% axis, as had those for the Euro a day earlier; should the Franc get some downside momentum, we’d initially target 1.25050, (current price being 1.26285); too for the Euro (currently 1.17065) we’re seeking at least 1.16855, (the signal having originated from 1.17510). The Econ Baro is quiet today with 18 incoming metrics then due in the week’s balance. And Q2 Earnings Season picks up its reporting pace as the week unfolds: ’twill be interesting to see how year-over-year profitability has fared given the marked decline in the Econ Baro through Q2.
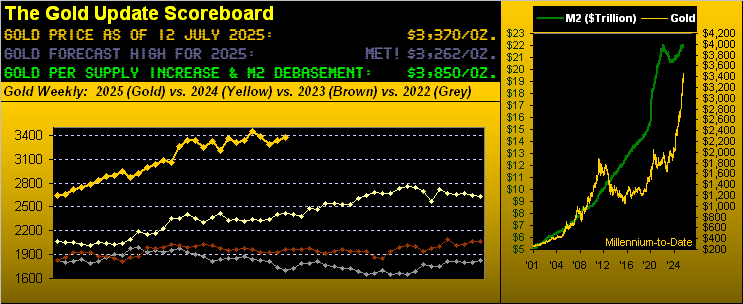
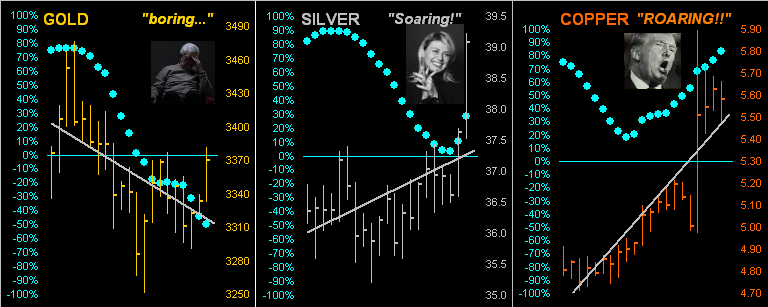
The Gold Update: No. 817 – (12 July 2025) – “Gold May Be Boring, but Silver is Soaring!”

And so we close with this from the “Hype of the Week Dept.” featuring Nvidia (NVDA). (Even as we “don’t do stocks”, this was too good to avoid the curiosity of doing the math). Ready?
The mighty video card maker turned “AI” chipster now tops the S&P 500 market capitalization at just over $4T. Thus for these last couple of days we’ve been hearing time and again that “Wow! Nvidia’s worth over $4T!!” … except such use of the vernacular is incorrect. ‘Tis worth nowhere near $4T.
Rather, by the company’s balance sheet as recorded at the end of this past Q1, the net worth is $84B. In other words, the amount of money invested in Nvidia as marked-to-market today is 48x what the company actually is worth; (that shan’t be on Bloomy, nor FoxyB, nor CNBS, neque alii). Such stat is actually quite similar to that for Apple (AAPL)’s 47x; however, far more conservative is Microsoft (MSFT)’s 12x, even as its net worth is some four times greater than that of Nvidia.
Still, for those of you scoring at home with a marked-to-market investment at present of, say, $10,000 in Nvidia, were the company to instantly (in theory) liquidate, you’d receive (if lucky after the bondholders) about $200, i.e. only 2% of “what you thought you had”. Have a nice day.
‘Course the lesson for you WestPalmBeachers down there is: when you buy shares in a publicly-traded company, it doesn’t get the money; it goes to the seller. So try not to get carried away…

And congrats if not having forgotten Soaring Sister Silver!
Cheers!
…m…
www.TheGoldUpdate.com
www.deMeadville.com
and now on “X”: @deMeadvillePro
11 July 2025 – 08:38 Central Euro Time
Both Gold and Silver are at present above today’s Neutral Zones, whilst below same are both Copper and the Spoo; volatility is moderate for the BEGOS Markets, save for Oil which has traced but 21% of its EDTR (see Market Ranges). With Friday left in the balance, Gold may be en route to recording its narrowest trading week of the year: more, ‘natch, in tomorrow’s 817th consecutive Saturday edition of The Gold Update. The Euro confirmed its “Baby Blues” (see Market Trends) of linreg consistency have settled below their +80% axis; the Swiss Franc appears to do same come today’s close. Too, the Euro is now paired with Gold for the best current correlation — in this case negative — amongst the five primary BEGOS components, (reminding us once again that Gold plays no currency favourites). The Econ Baro finishes its muted week late in the session with June’s Treasury Budget.
10 July 2025 – 09:22 Central Euro Time
At present all three elements of the Metals Triumvirate are above their respective Neutral Zones for today, whilst below same is the Spoo; BEGOS Markets’ volatility is pushing toward moderate. Given the recent hem-n-haw of late, we’ve no outstanding Market Rhythms for pure swing consistency; however from the “fade” (i.e. “anti-rhythm”) category, the best 10-test “fade” has been the non-BEGOS Yen’s 4hr EMA; for the 24-hour basis, the best “fade” has been Oil’s daily MACD. By Market Profiles, Gold’s most volume-dominant overhead resistor is 3347, whereas for Silver, her best volume-dominant underlying supporter is 36.65. For the EuroCurrencies, the “Baby Blues” (see Market Trends) of both the Euro and Swiss Franc continue to curl over to the downside such that by week’s end, one if not both shall confirm sell signals (upon the Blues falling below the +80% axis). The only metric due today in this quiet stint for the Econ Baro is last week’s Initial Jobless Claims.
09 July 2025 – 08:44 Central Euro Time
Copper yesterday recorded its largest percentage gain from prior close-to-high (+17.8%) so far this century, the day’s net gain (+10.1%) ranking third-most. This morning, the red metal is at present +3.3% and ’tis the only BEGOS Market above its Neutral Zone; below same is Gold, and session volatility is mostly light, save for Copper having thus far traced 148% of its EDTR (see Market Ranges). Going ’round the Market Values horn for the five primary BEGOS components in real-time: the Bond shows as -2^01 points “low” vis-à-vis its smooth valuation line, the Euro as +0.0098 points “high”, Gold as -120 points “low”, Oil as +1.14 points “high”, and the Spoo as +164 points “high”. Q2 Earnings Season is underway. The Econ Baro looks to May’s Wholesale Inventories. And late in the session come the FOMC’s Minutes from its 17-18 June Meeting.
08 July 2025 – 06:41 Central Euro Time
Very early on this morning as we go into motion, the Euro, Swiss Franc and Spoo all are at present above today’s Neutral Zones; the balance of the BEGOS Markets are within same, and volatility is light, given the hour. As anticipated, Oil’s “Baby Blues” (see Market Trends) of linreg consistency have just slipped below their 0%, indicative of the trend having rotated to negative. Too, those for both the Euro and Swiss Franc are showing the initial signs of rolling very after having been “on the ceiling” of late. Our best Market Rhythm for the Bond (by which a profit target is sought rather than a pure swing) is its daily MACD having confirmed a negative crossing to start the session: better than 3 fully points of gain have followed 7 of the past 10 crossovers. And late in the session for the Econ Baro comes May’s Consumer Credit.
07 July 2025 – 08:47 Central Euro Time
The two-day (04 and 07 July) trading session continues, now finding Gold, Silver, Copper, Oil and the Spoo all below their respective Neutral Zones; the Bond and EuroCurrencies are within same, and volatility for the BEGOS Markets is moderate albeit Silver has traced 111% of its EDTR (see Market Ranges). The Gold Update depicts the last week having recorded both a lower high and a lower low, yet finishing with a net weekly gain, a phenomena not having occurred since last October; regardless, Gold’s weekly parabolic trend remains Short through the past eight weeks; Gold at present is the sole BEGOS component sporting a negative linreg (see Market Trends): however those for both Silver and Oil appear poised to rotate from positive to negative as the week unfolds. Just four metrics are due for the Econ Baro this week, none being on the slate for today.
The Gold Update: No. 816 – (05 July 2025) – “Gold’s ‘Weak’ Up Week … and What We Bespeak”

Thus as the U.S. concludes its third holiday-shortened trading week of the last six (they’re getting a bit like France in that respect), Monday ’tis back to work right up to Labor Day (01 September). But for the Econ Baro, next week brings really encouraging news: just a wee four metrics are due such that the Baro likely doesn’t get bruised. Thus let the complacency keep all enthused as The Investing Age of Stoopid continues! Just don’t lose your shoes…

Dem dogs r’ Gold-Smart!
Cheers!
…m…
www.TheGoldUpdate.com
www.deMeadville.com
and now on “X”: @deMeadvillePro
04 July 2025 – 08:42 Central Euro Time
The BEGOS Markets commence a two-day session for Monday settlement such as to bridge the gap of the StateSide Holiday. And at present we’ve the Euro, Swiss Franc and Gold above their respective Neutral Zones, whilst below same are both Copper and the Spoo; session volatility is pushing toward moderate. Gold looks poised to post an up week, albeit with likely both a lower high and lower low than a week ago; more of course in tomorrow’s 816th consecutive Saturday edition of The Gold Update. The S&P 500 settled its week at yet another all-time high (6279 at close) and with a trailing 12 months’ P/E of 45.1x; the Index is now in an extreme “textbook overbought” condition; and specific to the Spoo (which is trading today until the 17:00 GMT holiday halt) is in real-time +218 points above its smooth valuation line (see Market Values). Happy 4th to those of you across The Pond!
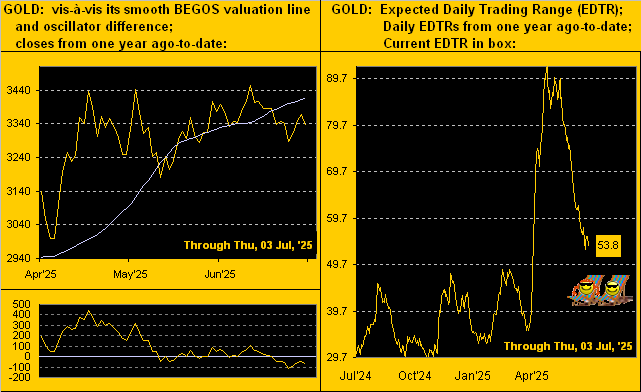
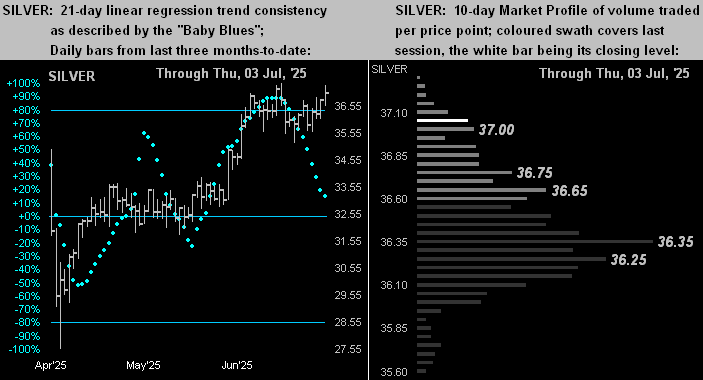
03 July 2025 – 08:43 Central Euro Time
At present we’ve only Silver outside (above) its Neutral Zone for today; BEGOS Markets’ volatility is again light. Looking at correlations amongst the five primary BEGOS components, our best currently is positive between the Euro and Spoo, both of which have firmly been relentlessly up month-over-month; indeed at Market Trends, the “Baby Blues” of linreg consistency for both markets are essentially “crawling across the ceiling”. The “live” P/E of the S&P 500 is (futs adj’d) 44.9x and the yield 1.237% vs. 4.223% annualized on the U.S. 3mo T-Bill; too, the S&P is now seven consecutive trading days “textbook overbought”. Given the StateSide holiday tomorrow, we’ve eight incoming metrics for the Econ Baro, including June’s Payrolls data and ISM(Svc) Index, plus May’s Factory Orders and Trade Deficit. The BEGOS Markets resume trading at their usual time tonight, but with settlement for Monday, (07 July), inclusive of the trading halt late tomorrow.
02 July 2025 – 08:39 Central Euro Time
The Euro is at present below its Neutral Zone for today whilst above same is the Spoo; session volatility for the BEGOS Markets is light. Gold is leading our Market Rhythms for pure swing consistency: on a 10-test basis is the yellow metal’s 6hr MACD; on a 24-test basis are both the 4hr and 8hr Parabolics; Gold had a firm start to the week, however its 21-day linreg trend continues to rotate more negatively, the “Baby Blues” of such trend’s consistency furthering their fall (see Market Trends). Following the ISR/IRN conflict, Oil’s day-to-day range has narrowed considerably, the last five trading sessions having spanned less than two points/day vs. the EDTR (see Market Ranges) of currently 3.44 points. And the Spoo continues its move up into record territory, albeit the S&P’s MoneyFlow yesterday was far more negative than the slight down change in the Index itself. The Econ Baro looks to June’s ADP Employment data.
01 July 2025 – 08:36 Central Euro Time
Both Gold and Copper are at present above today’s Neutral Zones; the balance of the BEGOS Markets are within same, and session volatility is moving toward moderate. At Market Trends, Gold is the sole component in negative linreg, even as price is bouncing a bit; by Market Ranges, Gold’s EDTR is now 56 points, (of which 54% has traded thus far today); Copper already has traded 90% of its EDTR (0.114 points); the red metal is having a solid up run despites its “Baby Blues” of trend consistency weakening some two-to-three weeks ago; Copper’s best Market Rhythm currently for pure swing consistency on our 10-test basis is its 30mn Parabolics. For the Econ Baro we’ve June’s ISM(Mfg) Index and May’s Construction Spending.
30 June 2025 – 08:35 Central Euro Time
This first day of the week and last day of Q2 finds at present Gold, Silver and the Spoo above today’s Neutral Zones; the other BEGOS Markets are within same, and volatility is moderate. The Gold Update takes a near-term bearish view, especially given the highly-visible weekly MACD having confirmed a cross to negative, (and the weekly parabolic Short trend having completed a seventh week); too, Gold’s 21-day linreg trend has rotated to negative; price at present is 3301, however has traded thus far this morning to as low as 3251. The Spoo (6254) is sufficiently up at the moment for the S&P 500 to open above 6200, (“fair value” is +50 points). And the Econ Baro looks to June’s Chi PMI.
The Gold Update: No. 815 – (28 June 2025) – “Gold –> The (Short) Saga Continues…”


To wrap it up, ‘twouldn’t be month-end (less a day) without the BEGOS Markets’ Standings. And through these six months, our Metals Triumvirate has dominated the podium: none of the other markets thus far have fared better than fourth position. For June, swapping the first two spots from May are Gold by Copper, the red metal having just recorded its fourth best week (+4.8%) of the year. Meanwhile the non-earnings supportive S&P 500 miraculously clings to a +5.0% gain, oblivious to its pending pain, (yes ’tis coming with a vengeance by any historical means-reversion measure of earnings multiples, the “live” price/earnings ratio at present 44.6x). Moreover as earlier teased: pity the poor Dollar! The Dollar Index is -10.5% through the first half of this year. That is Dixie’s worst first six months’ percentage drop since coming on line as a futures product 40 years ago! Again cue the late, great “Bullet” Bill King: “Holy Toledo!!”

But barring anything untoward (i.e. renewed geo-political jitters, an equity market collapse, the inevitable loss of confidence in the financial system), we shan’t be surprised to find Gold working lower through here. Yet one can buy Gold’s dip to stay financially fit!
Cheers!
…m…
www.TheGoldUpdate.com
www.deMeadville.com
and now on “X”: @deMeadvillePro
27 June 2025 – 08:48 Central Euro Time
Gold is the sole BEGOS Market at present outside (below) its Neutral Zone for today; session volatility is light. As we look toward tomorrow’s 815th consecutive Saturday edition of The Gold Update, the yellow metal looks to continue its weekly parabolic Short trend, even as price is higher (3299) than when it began (3220); too for Gold, the weekly MACD has provisionally crossed to negative, and price this week has slipped below both its Market Value and Market Magnet; too by Market Trends, Gold’s linreg looks en route to rotating to negative during next week. The event of the day is May’s “Fed-favoured” PCE data, other incoming Econ Baro metrics including the month’s Personal Income/Spending. And should the Spoo be priced above 6198 (currently 6211) upon the commencement of StateSide RTH trading, the S&P 500 would print an all-time high at the open.
26 June 2025 – 08:47 Central Euro Time
As was the case at this time yesterday, all eight BEGOS Markets are within today’s Neutral Zones; session volatility, whilst light, is rangier than ’twas 24 hours ago. Seems “all are waiting” for tomorrow’s “Fed-favoured” inflation data via May’s PCE. At Market Rhythms, we note on the 24-test basis the pure swing consistency of late for the Bond’s 15mn MACD, the median duration of each swing being some 4-to-5 hours. Per Market Trends, all eight components are in positive linreg, however the “Baby Blues” of trend consistency are dropping for Gold, Silver and Oil; those for Copper have curtailed their fall: the red metal’s daily Parabolics appear poised to flip from Short-to-Long in the next few days, barring a sudden price decline. Incoming Econ Baro metrics include May’s Durable Orders and Pending Home Sales, plus the final read on Q1 GDP.
25 June 2025 – 08:44 Central Euro Time
The BEGOS Markets are comparatively quiet across the board given the recent events/ceasefire in the Mid-East: at present, all eight components are within today’s Neutral Ranges and volatility is very light, the average EDTR (see Market Ranges) tracing just 24% to this point. Going ’round the Market Values horn for the five primary components, there are not any overly extreme deviations: in real-time, the Bond shows as -0^30 points “low” beneath its smooth valuation line, the Euro +0.009 points “high”, Gold -45 points “low”, Oil +1.67 points “high”, and the Spoo +121 points “high”, the latter’s EDTR being 82 points. At Market Trends, the “Baby Blues” of linreg consistency for both Gold and Oil confirmed dropping below their key +80% axes, indicative of still lower prices near-term. And the Econ Baro awaits May’s New Home Sales.
24 June 2025 – 08:36 Central Euro Time
Concerns over the Mid-East conflict have basically been absorbed by the BEGOS Markets as a “ceasefire” comes to the fore. The Euro, Swiss Franc and Spoo are at present above their respective Neutral Zones for today, whilst below same are both Gold and Oil; session volatility is firmly moderate. From yesterday’s Oil high of 78.40 to today’s low (thus far) of 64.38 is a -17.9% drop. Copper has been resilient even as its “Baby Blues” (see Market Trends) continue lower still; the red metal’s cac volume is moving from July into that for September as too shall be the case for Silver over the next day or two. The Spoo (on a continuous cac basis) has today tapped 6140, the all-time high being 6167 on 19 February. Today’s incoming Econ Baro metrics are June’s Consumer Confidence and Q1’s Current Account Deficit.
23 June 2025 – 08:21 Central Euro Time
Some five hours following release of The Gold Update came the States’ sortie over IRN; however, to look this morning at the BEGOS Markets, they appear as a fairly normal start to the week, save for volatility being moderate-to-robust; Oil is the only component at present outside (above) its Neutral Zone for today, currently +1.4%; early on, ’twas up as much as +5.9%. Gold presently is -0.4%, The Gold Update suggesting the weekly Short trend becoming “elongated”, notably with the “Baby Blues” (see Market Trends) rolling over to the downside. And the Spoo is -0.2%. The deteriorating Econ Baro has 13 metrics scheduled for this week, commencing with May’s Existing Home Sales.
The Gold Update: No. 814 – (21 June 2025) – “Economy Mis-Read by Fed, but Gold’s Rally Turning Red?”


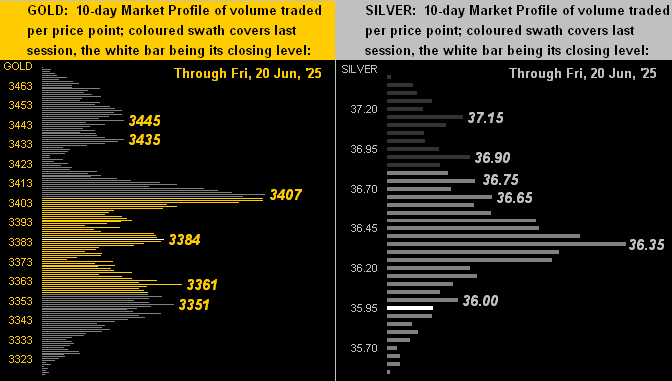
In sum, a bit more pullback in the precious metals ought not be of much concern, (that courtesy of the “Markets Don’t Move in a Straight Line Dept.”) even as we’ve key leading indicators that suggest a bit of a near-term a slip. With 3384 Gold today — a -12% discount to the opening Scoreboard’s Dollar debasement value of 3827 — price’s best days remain well up the Golden Road. Indeed, to eclipse the key 3476 level in the new week — and thus flip the weekly trend from Short back to Long — from here is a distance of +92 points. Gold’s expected weekly trading range? 151 points. Clearly doable, especially should another dose of geo-political jitters ensue. Otherwise, some pullback looks due.
To close, we query: “Do you scare easily?” If you’re invested in equities, the following fearful graphic arguably suggests running for cover. Recall the disconnect with which we opened between the plunging Econ Baro and the flying S&P 500? Scary. More broadly for the S&P, really scary! Such “Casino 500” today at 5968 is some +33% above the top of the yellow regression channel and the “trailing twelve months” price/earnings ratio of 43.5x essentially double any historical norm, (let alone practically triple Jerome B. Cohen’s “…in bull markets the average [price/earnings] level would be about 15 to 18 times earnings…”).
As a fine friend said over coffee this morning “Next year’ll be a disaster for the stock market”, to which we quizzically responded “What about next week?” Scary indeed:
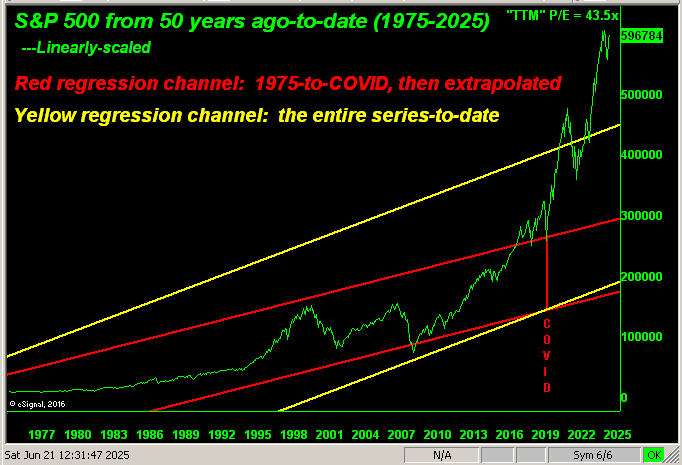
The good news of course is that all such “scariness” is mitigated given economics no longer have meaning, as neither do earnings. Employing math is a thing of the past! Or to reprise what a seasoned investor said to us here back in April: “Nobody at Goldman [today] has ever experienced a down market.” Then to close out the FinMedia week came this yesterday from Dow Jones Newswires: “The Stock Market Has Taken a Lot of Pain for Not Much Gain.” Look at the top of the above graphic. They’ve no concept of what market pain is.
Either way, don’t you get mis-read; get Gold instead!
Cheers!
…m…
www.TheGoldUpdate.com
www.deMeadville.com
and now on “X”: @deMeadvillePro
20 June 2025 – 08:42 Central Euro Time
The two-day session continues, at present finding the Bond, Euro and Swiss Franc above their Neutral Zones and all three elements of the Metals Triumvirate below same; volatility (as is typical in accounting for two days) is mostly robust. The Spoo yesterday traded below its “low if a down day” (5979), price having since rebounded nearly all the way back up. As anticipated, Copper is weaking as its “Baby Blues” (see Market Trends) drop further still; too, those for both Silver and Gold are curling over to the downside: more on it all in tomorrow’s 814th consecutive Saturday edition of The Gold Update. Oil’s recent strength given the Mid-East strife finds price (in real-time) +12.30 points above its smooth valuation line (see Market Values). And the best correlation currently amongst our five primary BEGOS components is positive between the Bond and Gold, albeit the latter has been coming off a bit. The Econ Baro finishes its week with June’s Philly Fed Index and May’s Leading (i.e. given the Baro, “lagging”) Indicators.
19 June 2025 – 08:47 Central Euro Time
Given the StateSide holiday, ’tis a two-day session for the BEGOS Markets with settlement on Friday. At present, we’ve the the two EuroCurrencies, Metals Triumvirate and Spoo all below their respective Neutral Zones for today, whilst above same is Oil; volatility thus far is moderate, the largest EDTR (see Market Ranges) tracer being Gold at 71%; of note, the yellow metal’s weekly Parabolic trend still is Short and would end the week as such, barring a rally from here (3366) of some +114 points (3480 being the flip-to-Long price) by Friday. As for Copper, its “Baby Blues” (see Market Trends) fallout continues without price (as yet) having materially let go to the downside; however today, Copper has marginally slipped below its most dominant volume price supporter (see Market Profiles) at 4.815. The various trading halts for the holiday commence at 17:00 GMT.
18 June 2025 – 08:34 Central Euro Time
At present we’ve the Euro, Silver and Copper above today’s Neutral Zones, whilst below same is Oil; session volatility for the BEGOS Markets is mostly light, the largest EDTR (see Market Ranges) tracing to this point being 50% for both Gold and Copper. Specific to the red metal, Copper’s “Baby Blues” (see Market Trends) continue their fall as the consistency of price’s uptrend breaks down. Looking at Market Magnets, save for Oil (which yesterday settled 8.73 points above its Magnet) the balance of the BEGOS Bunch are basically at their respective Magnet levels. Due to tomorrow’s StateSide holiday, the Econ Baro today (rather than Thursday) receives the prior week’s Initial Jobless Claims; due too are May’s Housing Starts/Permits. And late in today’s session comes the FOMC’s “no change” Policy Statement, although the plunging Econ Baro and benign (by May) inflation ought be substance for an eventual FedFunds rate cut.
17 June 2025 – 08:37 Central Euro Time
As internally texted last evening, the markets appear to have “priced-in” the Mid-East conflict and now are “on hold” ahead of the Fed on Wednesday: at present, seven of the eight BEGOS Markets are within their respective Neutral Zones for today (Silver being just a tad above same), and session volatility is light-to-moderate. At Market Trends, all eight components are in positive linreg, although the consistency of that for Copper is notably weakening. Oil, which as it did yesterday spiked up and then retreated, still finds by Market Values current price (70.46) +9.65 points “high” above its smooth valuation line; too, the Spoo is at present +151 points “high” by the like measure. ‘Tis quite the cavalcade of incoming metrics due today for the Econ Baro, including June’s NAHB Housing Index, May’s Retail Sales, Ex/Im Prices and IndProd/CapUtil, plus April’s Business Inventories.
16 June 2025 – 08:32 Central Euro Time
Despite Mid-East turmoil, the BEGOS Markets by change appear rather disinterested. Both the Bond and Gold are at present below today’s Neutral Zones, whilst above same are both Copper and the Spoo; session volatility however is moderate-to-robust, primarily as Oil spiked higher at the open to 75.50 but since retreated to now 71.78. The Gold Update acknowledges the weekly parabolic Short trend as having survived another week even as price has been rising throughout: the hurdle for the trend to flip to Long in the new week is 3480, the high today already 3476 before price having since pulled back to now 3436. Cac volume for the Spoo is rolling from June into September with +54 points of fresh premium; (as noted on Friday, Oil’s cac volume is moving from July into August). And 14 metrics come due for the Econ Baro this week, including for today June’s NY State Empire Index.
The Gold Update: No. 813 – (14 June 2025) – “Gold’s Short Strut Has Been Anything But”

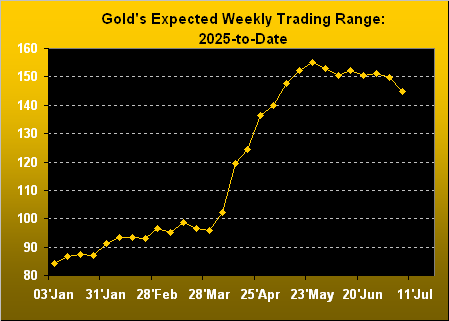
Because this Short trend technically (barely) is still in force, we again acknowledge the 2973-2844 support zone. Nonetheless, the distance to flip the Short trend back Long is a mere +27 points above here at the 3840 level. And given Gold’s expected weekly trading range is 152 points, (the daily alone now 62 points) the flip ought come quickly, even per an opening up gap on Monday should geo-political tensions escalate through this weekend. Thus we’re just about there.
“But as you usually say, mmb, price spikes on geo-politics don’t last very long…”
True enough, Squire. Yet should the trend flip to Long in the new week, reflipping it back to Short wouldn’t initially occur until 3123 trades, some -330 points below present price. More importantly: an imminent flip to Long puts a fresh All-Time High above 3510 squarely on the near-term table for Gold: ’tis just +57 points from here. So much for the Shorts singin’ ![]() “I’m struttin’ my stuff, y’all…”
“I’m struttin’ my stuff, y’all…”![]() –[Elvin Bishop, ’75]. (Albeit we ought not disparage the Shorts as they accommodate taking the other side of the trade).
–[Elvin Bishop, ’75]. (Albeit we ought not disparage the Shorts as they accommodate taking the other side of the trade).
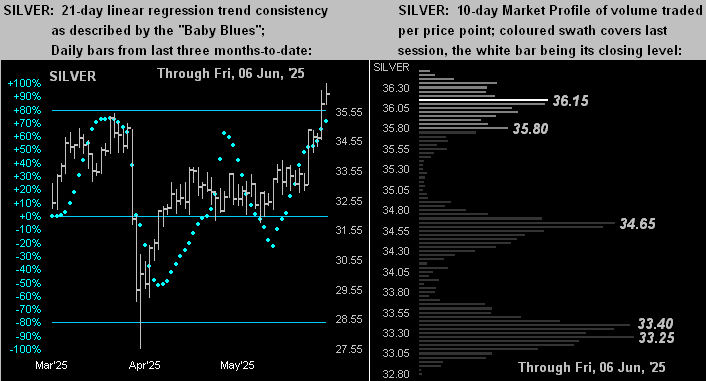
Further for those of you scoring at home, through this year’s 24 trading weeks-to-date, Gold is now +31%, this last week’s gain being third-best by both percentage (+3.7%) and points (+122 points) as depicted in the above graphic. Too, per the website’s “Gold” and “Market Rhythms” pages, Gold’s best Rhythm through its last ten iterations from 03 April-to-date has been the MACD (moving average convergence divergence) on price’s eight-hour series. (But try not to get carried away).
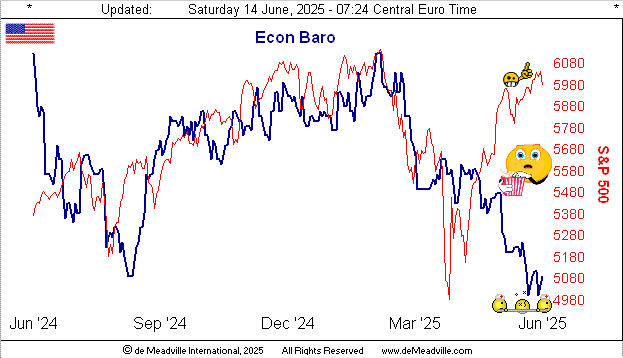
If anything ought be carried away (on a stretcher) ’tis the Economic Barometer. As herein penned a week ago: “…the Econ Baro reached its lowest level in nearly 16 years…”
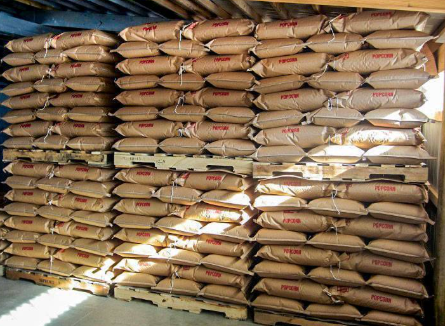
Still, we’ve this from the “Taking the Good with the Bad Dept.”: as the economy by the Baro is slowing — indeed outright shrinking — inflation for May as measured by the Bureau of Labor Statistics cooled; (May’s “Fed-favoured” PCE is not due until 27 June). Thus the “s” word “stagflation” is not (as yet?) being made “officially” apparent, even if ’tis evident by your own personal engagement in commerce. We certainly sense it: the base cost of our triannual purchase of popping corn from the States (as ever so detailed in Gold Update No. 803 from this past 05 April) just increased +10.1% before shipping, tariff and value-added tax. Yet at least The University of Michigan’s “Go Blue!” Sentiment Survey for June reached a three-month high, (but we can’t see why):
And so toward the wrap here’s The Gold Stack: what can be better than that?
The Gold Stack
Gold’s Value per Dollar Debasement, (from our opening “Scoreboard”): 3825
Gold’s All-Time Intra-Day High: 3510 (22 April 2025)
2025’s High: 3510 (22 April 2025)
The Weekly Parabolic Price to flip Long: 3480
10-Session directional range: up to to 3467 (from 3314) = +153 points or +4.6%
Gold’s All-Time Closing High: 3453 (13 June 2025)
Trading Resistance: none per the Profile
Gold Currently: 3453, (expected daily trading range [“EDTR”]: 62 points)
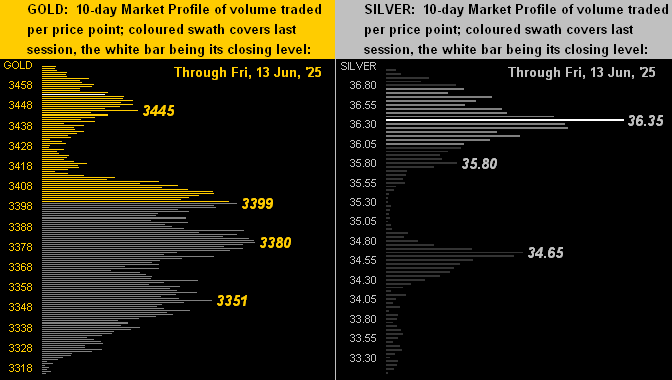
Trading Support: notables by the Profile 3445 / 3399 / 3380 / 3351
10-Session “volume-weighted” average price magnet: 3385
The 300-Day Moving Average: 2721 and rising
2025’s Low: 2625 (06 January)
The 2000’s Triple-Top: 2089 (07 Aug ’20); 2079 (08 Mar’22); 2085 (04 May ’23)
The Gateway to 2000: 1900+
The Final Frontier: 1800-1900
The Northern Front: 1800-1750
On Maneuvers: 1750-1579
The Floor: 1579-1466
Le Sous-sol: Sub-1466
The Support Shelf: 1454-1434
Base Camp: 1377
The 1360s Double-Top: 1369 in Apr ’18 preceded by 1362 in Sep ’17
Neverland: The Whiny 1290s
The Box: 1280-1240
Come this Wednesday (18 June), the Federal Open Market Committee delivers its next Policy Statement. Expectations call for the FOMC voting to continue maintaining the target range for its Funds Rate at 4.25%-to-4.50% regardless of the faltering Econ Baro and Q1 annualized GDP shrinkage of -0.2%. However as you no doubt recall, the bugaboo coupled to that latter figure was the Q1 Chain Deflator of +3.7% … Ouch! May’s inflation may have cooled, but given economic shrinkage, is there still stagflation linkage? Perhaps rather than order popcorn by the pack, we ought do so by the pallet…
…and thus keep more Gold and Silver in the wallet!
Cheers!
…m…
www.TheGoldUpdate.com
www.deMeadville.com
and now on “X”: @deMeadvillePro
13 June 2025 – 08:29 Central Euro Time
The overnight Mid-East offensive has made robust the volatility of the BEGOS Markets: notable movers are Oil having traced 443% of its EDTR (see Market Ranges), the Spoo 156%, the Euro 113% and Gold 109%. Presently above today’s Neutral Zones are the Bond, Gold and Oil, whilst below same are the Euro, Copper and the Spoo. Gold is getting the geo-political bid (sans Silver) in having traded to as high as 3467, which is not enough to flip the weekly parabolic Short trend to Long (were 3487 to trade today); more of course in tomorrow’s 813th consecutive Saturday edition of The Gold Update. The Euro’s “Baby Blues” (see Market Trends) in the new week may move below their key +80% axis which would point to lower price levels near-term; the Dollar is firming today (+0.4%) even as Gold is up (+1.1%). The EuroCurrencies’ cac volumes are rolling from June into those for September; watch same for Oil from July into August toward Monday. And the Econ Baro wraps its week with UofM’s Sentiment Survey for June.
12 June 2025 – 08:33 Central Euro Time
Presently, the Euro and Swiss Franc are above today’s Neutral Zones, whilst below same is Oil; BEGOS Markets’ volatility is mostly moderate. At Market Trends, all eight components are in positive 21-day linreg, which reflects the downturn in the Dollar Index from 100.840 a month ago to now 98.360. However, going ’round the Market Values horn in real-time, we’ve the Bond -2^05 points “low” vis-à-vis its smooth valuation line; for the other primary components, the Euro shows as essentially in synch with such valuation, Gold as +50 points “high”, Oil as +5.99 points “high” and the Spoo as +185 points “high”. Today’s incoming metrics for the Econ Baro include wholesale inflation per May’s PPI.
11 June 2025 – 08:42 Central Euro Time
All eight BEGOS Markets are presently within their respective Neutral Zones for today and session volatility is light. Looking at Market Rhythms on a 10-test basis the current leaders are the Spoo’s 12hr Parabolics and Gold’s 6hr MACD; on a 24-test basis we’ve (yet again) the non-BEGOS Yen’s daily Price Oscillator, plus the Euros 2hr Parabolics and the Swiss Franc’s 1hr MACD. By Market Trends, in real-time the “Baby Blues” for both the Euro and Swiss Franc are kinking lower for the first time in some three weeks, an early indication that their recent rallies are running out of puff; the Spoo’s “Baby Blues” have stalled their descent, but have not reversed back upward. The Econ Baro looks to May’s retail inflation via the CPI; and late in the session come’s the month’s Treasury Budget.
10 June 2025 – 08:42 Central Euro Time
Silver is the sole BEGOS Market at present outside (below) its Neutral Range for today; session volatility is pushing toward moderate, following a fairly narrow day yesterday; indeed by Market Ranges, all eight BEGOS components have seen plunging EDTRs over the last month. At Market Trends, only the Bond is in negative linreg, however ’tis rotating toward positive; and in real-time, the “Baby Blues” of trend consistency are rising across the board including ~barely~ for the Spoo, the latter’s having been in descent for some three weeks without price (as yet) succumbing per se. Regardless, the S&P 500 continues its significant overvaluation, the “live” (futs-adj’d) P/E currently 47.0x and yield a wee 1.282% vs. 4.240% annualized for the 3mo. U.S. T-Bill. Nothing is due today for the Econ Baro ahead of inflation data into the balance of the week.
09 June 2025 – 08:37 Central Euro Time
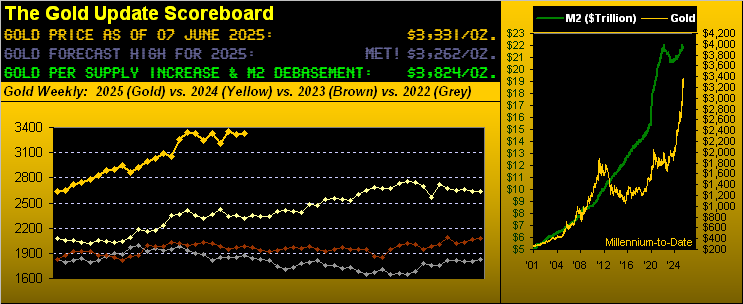
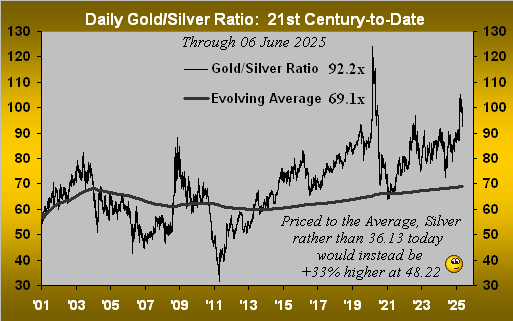
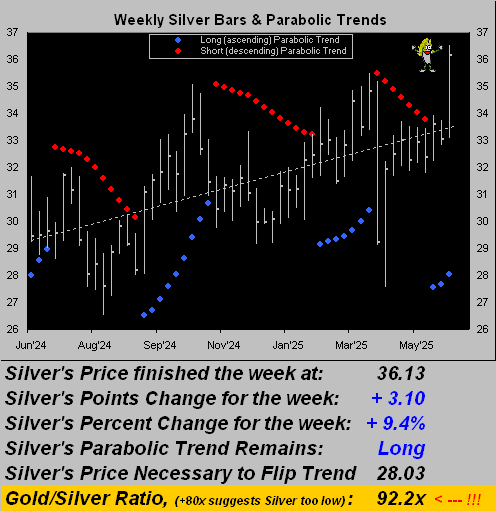
The Euro, Swiss Franc and Silver are all at present above today’s Neutral Zones; none of the other BEGOS Markets are below same, and session volatility is light. The Gold Update highlights Silver’s +9.4% net gain for last week, whereas that for Gold was just +0.5%; and yet with the Gold/Silver ratio now 91.9x, relative to the yellow metal, the white metal nonetheless remains cheap given the century-to-date average ratio of 69.1x. Per Market Values, Gold is essentially on its smooth valuation line; the Spoo however is +258 points above same; and yes, the Spoo’s “Baby Blues” (see Market Trends) are lower yet again without price having materially fallen, albeit such leading indicator suggests the selling is coming. For the Econ Baro — the negative divergence of which from the S&P 500 is stunning — the week begins with April’s Wholesale Inventories.
The Gold Update: No. 812 – (07 June 2025) – “Gold Lies Low Whilst Silver Steals the Show”
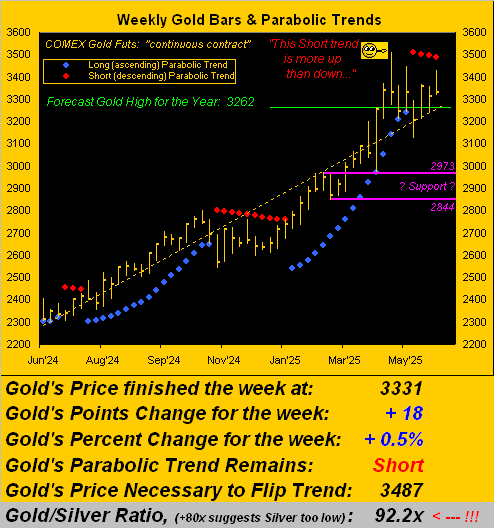
Regardless, Gold intra-week had been up as much as +3.5% before basically ![]() “…giving it all away…”
“…giving it all away…”![]() –[Roger Daltery, ’73]. Thus the Short trend continues from which an ascent up through 3487 in the new week would initiate a new Long streak. Such level is +156 points higher from here, which is not that unrealistic as Gold’s expected weekly trading range is presently 151 points. But should the Short trend stubbornly persist, we remain mindful of the underlying 2973-2844 support zone as maintained on the above graphic. Either way, for these past five days, the spotlight has shown upon Sweet Sister Silver per her cumulative percentage track versus that for Gold:
–[Roger Daltery, ’73]. Thus the Short trend continues from which an ascent up through 3487 in the new week would initiate a new Long streak. Such level is +156 points higher from here, which is not that unrealistic as Gold’s expected weekly trading range is presently 151 points. But should the Short trend stubbornly persist, we remain mindful of the underlying 2973-2844 support zone as maintained on the above graphic. Either way, for these past five days, the spotlight has shown upon Sweet Sister Silver per her cumulative percentage track versus that for Gold:
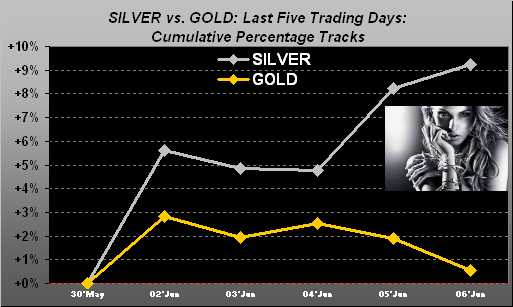

All-in-all, a stunning and well-overdue super week for Silver. And again, relative to Gold, Silver is still a bargain. But the inexorable passage of time marches ever onward, the ensuing week’s StateSide highlights being both retail and wholesale inflation readings for May. Consensii for the Consumer Price Index sense same or an uptick from April’s pace, whilst the Producer Price Index is expected to have swung from DEflationary back to inflationary. We therefore graphically query:

Cheers!
…m…
www.TheGoldUpdate.com
www.deMeadville.com
and now on “X”: @deMeadvillePro