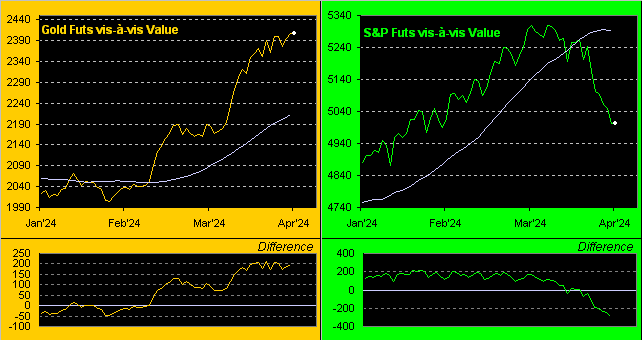
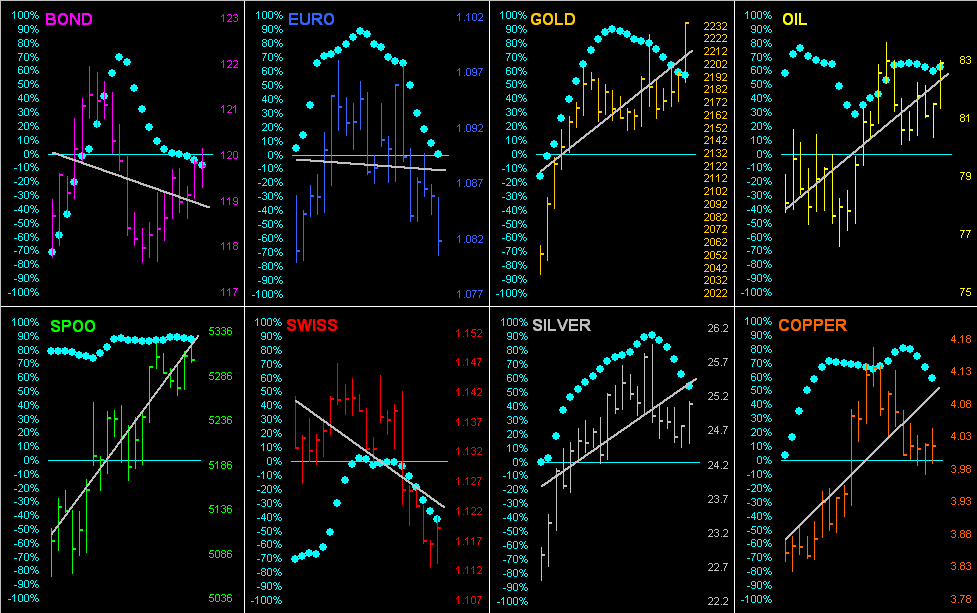
Copper is the sole BEGOS Market at present outside (above) today’s Neutral Zone; the red metal continues to be in play, having already traced 146% of its EDTR (see Market ranges); otherwise, session volatility for the other components is light with a bevy of EconData in the day’s balance. Looking at Market Trends we’ve only two with negative linregs: Gold and Oil; until the former clears at least 2385 (the Golden Ratio retracement cited in the current edition of The Gold Update), the recent near-term correction would technically remain in place; Gold at present is 2362 and its EDTR is 35 points. The Econ Baro’s busy day looks to May’s NY State Empire Index, Business Inventories and NAHB Housing Index, plus April’s reads on retail inflation (CPI) and Retail Sales.
 Mark
Mark
14 May 2024 – 08:25 Central Euro Time
Both Silver and Copper are at present above their respective Neutral Zones for today; the other BEGOS Markets are within same, and volatility pre-StateSide inflation data is very light. Of the 405 Market Rhythms we test nightly, Copper (on a 10-test swing basis) is leading for consistency by its 30mn MACD; second-best is Gold’s 12hr Parabolics; too (on a 24-test swing basis) Copper’s 1hr MACD leads for consistency, followed again by its 30mn MACD. As well, Copper is the only BEGOS Market for which its EDTR (see Market Ranges) widened yesterday both day-over-day and week-over-week: thus vis-à-vis the whole bunch, Copper is most in play. And as noted, today the Econ Baro awaits April’s inflation at the wholesale level (PPI).
13 May 2024 – 08:37 Central Euro Time
The week begins with Gold at present below its Neutral Zone for today; the balance of the BEGOS Markets are within same, and volatility is light. The Gold Update inconclusively questions as to whether or not the yellow metal’s recent correction off its All-Time High (2449 on 12 April) has run its course: Gold’s rally this past week went precisely up to the perfect Golden Ratio fib retracement at 2385 (from the correction’s low [thus far?] of 2285), but has since pulled back (now 2358); too, by Market Values, Gold (in real-time) is +54 points above its smooth valuation line, and by Market Trends, the linreg remains negative. Whilst the Econ Baro is quiet today, a very busy week awaits with 18 metrics due, including those for April’s wholesale (PPI) and retail (CPI) inflation. As well, this is the final week of Q1 Earnings Season, which by year-over-year comparison has been rather mediocre (and thus is why the P/E of the S&P remains treacherously high, the “live” reading 39.2x).
The Gold Update: No. 756 – (11 May 2024) – “Gold Garners a Groovy Golden Ratio Retracement”

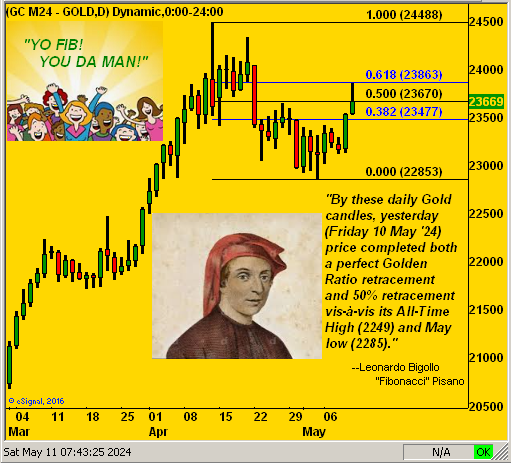
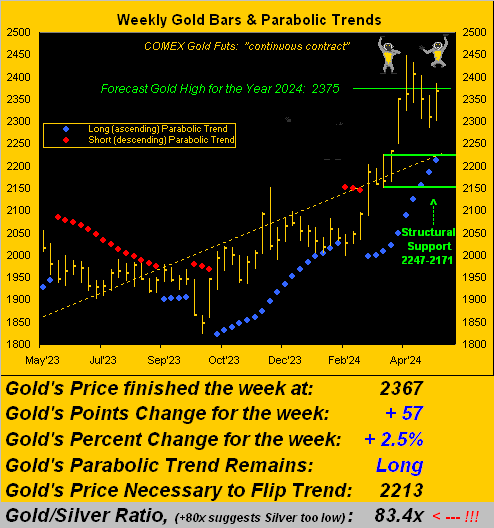
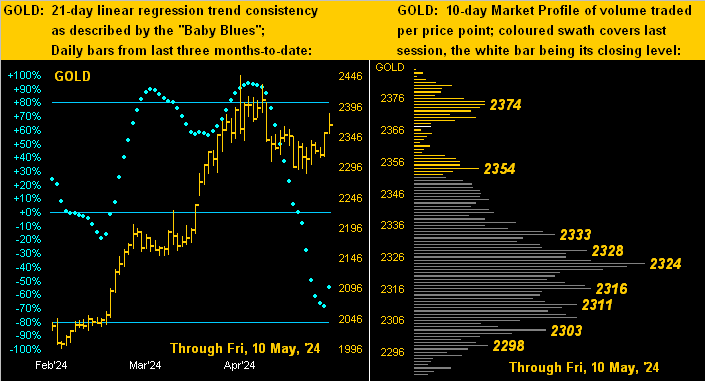
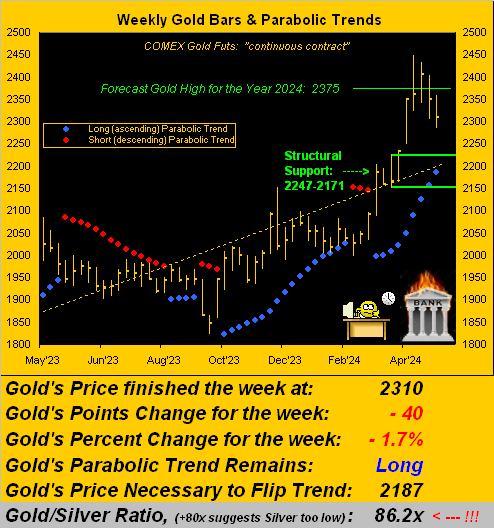
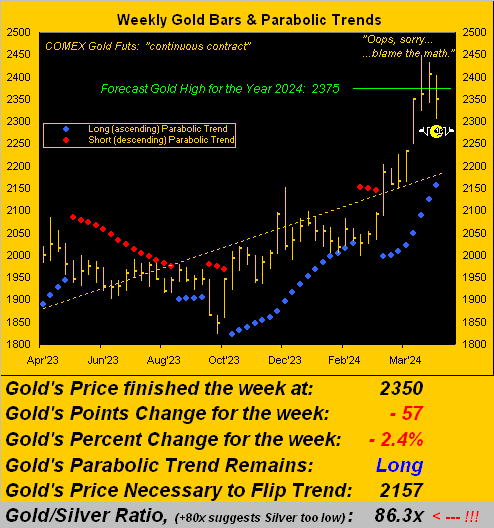
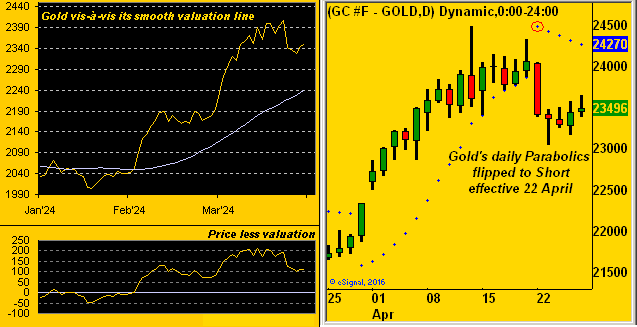
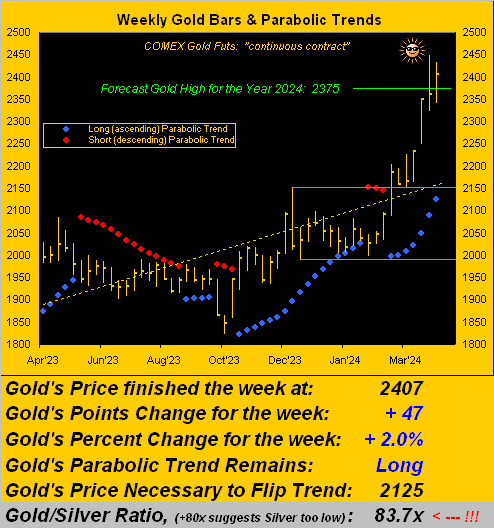
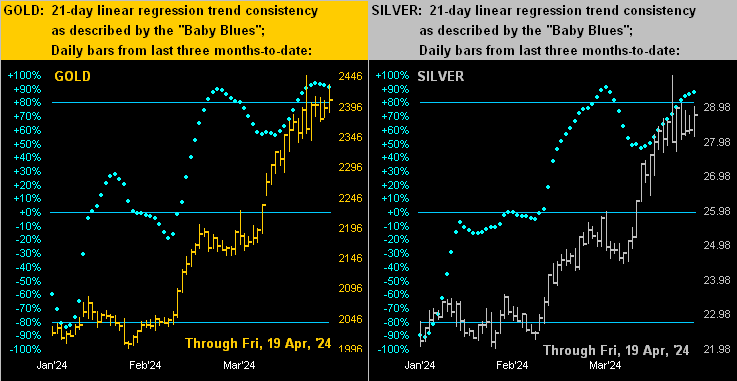
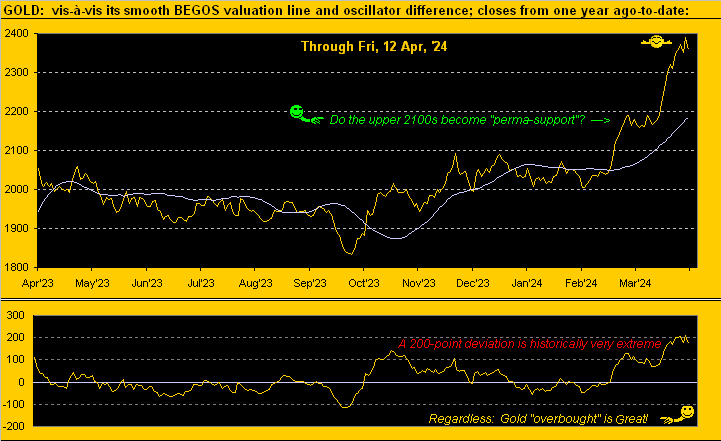
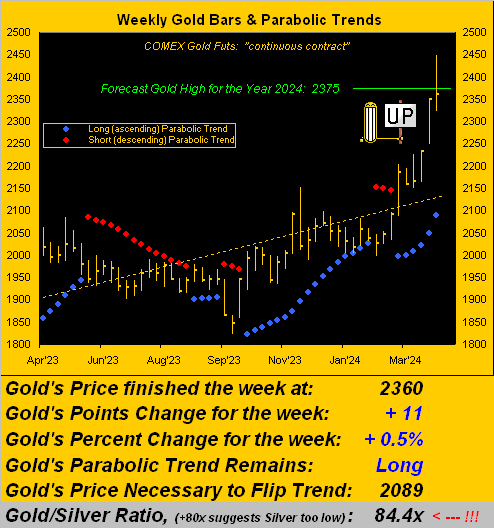
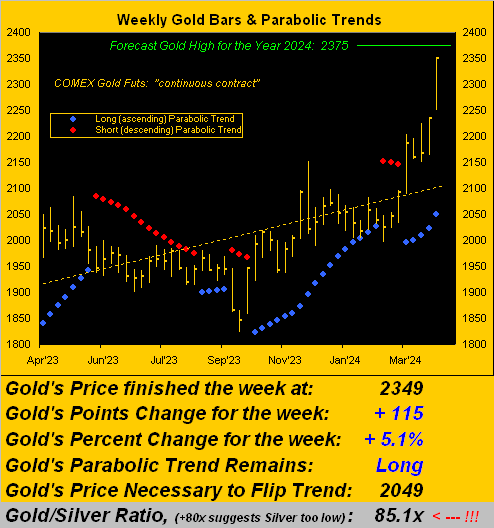
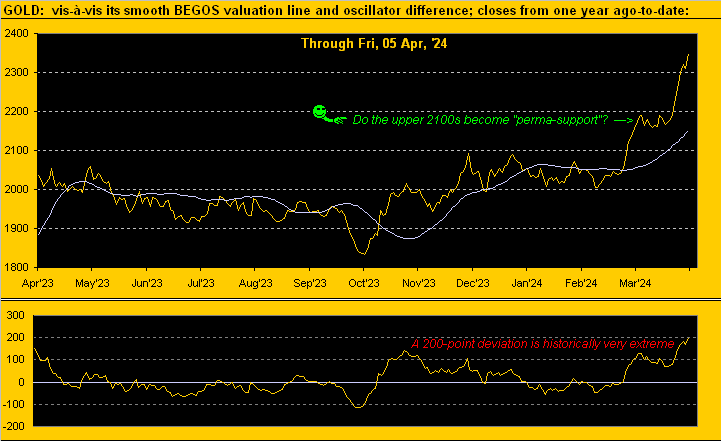
‘Course, the question then remains: has the near-term downside Gold correction run its course? Or is the perfect Fibonacci Golden Ratio retracement and subsequent same-day pullback signaling the resumption of such downside? To be sure, Gold’s daily “textbook technicals” (MACD, Price Oscillator, Moneyflow) — which a week ago were leaning lower — are just now bending up a bit. And yet per both the website’s Market Values and Gold pages, price is still +69 points above its smooth valuation line, (it has not been below same since 28 February). Also fundamentally, in a week almost completely bereft of incoming metrics for the Economic Barometer, save for some arguably “hawkish” FedSpeak to end said week, there’s really not that much upon which to critique. Yet as we all know, “the trend is your friend”, and as we next go to Gold’s weekly bars from a year ago-to-date, both the rising dashed linear regression trendline and blue-dotted parabolic Long trend look great. Warily however, prior to Gold next scoring a fresh All-Time High at 2450+, it may be a bit premature to start dancing to The Chipmunks ![]() “Funky Monkey“
“Funky Monkey“![]() :
:
Toward the wrap, let’s go to the stack:
The Gold Stack
Gold’s Value per Dollar Debasement, (from our opening “Scoreboard”): 3765
Gold’s All-Time Intra-Day High: 2449 (12 April 2024)
2024’s High: 2449 (12 April 2024)
Gold’s All-Time Closing High: 2391 (11 April 2024)
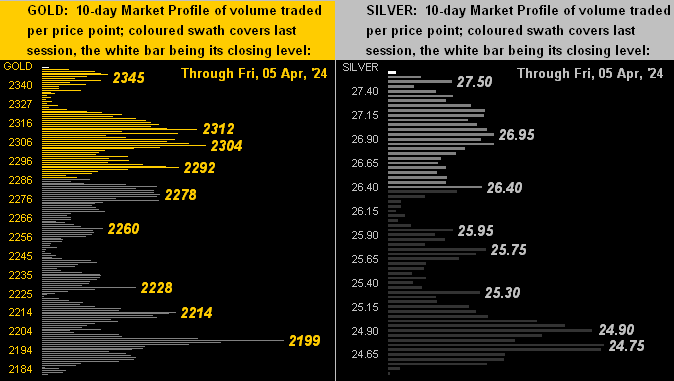
10-Session directional range: up to 2386 (from 2285) = +101 points or +4.4%
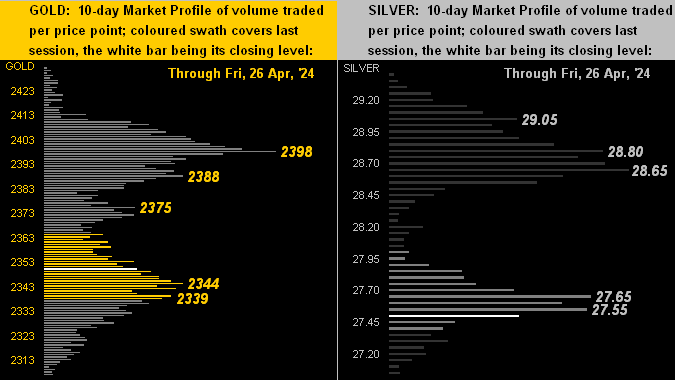
Trading Resistance: 2374
Gold Currently: 2367, (expected daily trading range [“EDTR”]: 37 points)
Trading Support: various from 2333 to 2298, most notably therein 2324
10-Session “volume-weighted” average price magnet: 2328
Structural Support: 2247-2171
The Weekly Parabolic Price to flip Short: 2213
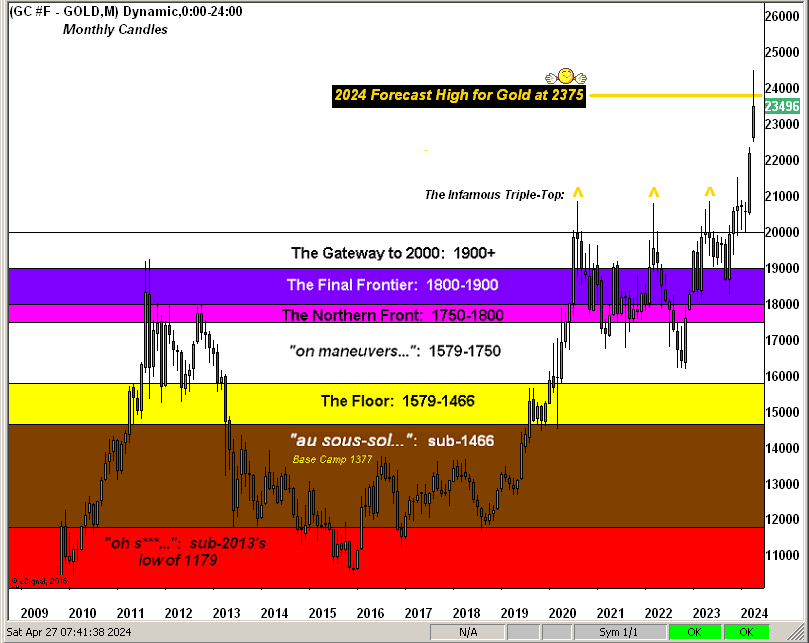
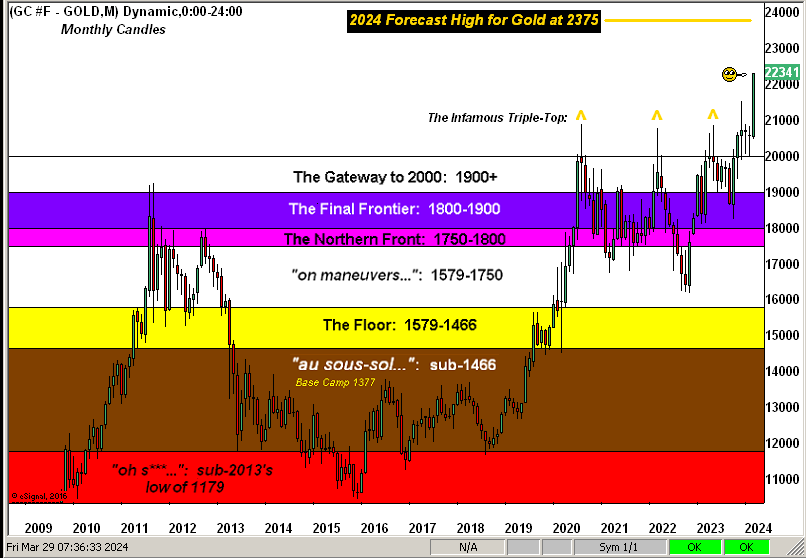
The 2000’s Triple-Top: 2089 (07 Aug ’20); 2079 (08 Mar’22); 2085 (04 May ’23)
The 300-Day Moving Average: 2028 and rising
2024’s Low: 1996 (14 February)
The Gateway to 2000: 1900+
The Final Frontier: 1800-1900
The Northern Front: 1800-1750
On Maneuvers: 1750-1579
The Floor: 1579-1466
Le Sous-sol: Sub-1466
The Support Shelf: 1454-1434
Base Camp: 1377
The 1360s Double-Top: 1369 in Apr ’18 preceded by 1362 in Sep ’17
Neverland: The Whiny 1290s
The Box: 1280-1240
“So, mmb, we got your closer ready to go!“
And thank you, Squire, ’tis as rich as they come. We’ll spare (to benevolently save embarrassment) such pundit’s identity, but here we go. Ready? Hat-tip Dow Jones Newswires from last Monday:
- “Gold is overvalued now and won’t help you beat inflation in coming years.”
(Even the “doggy” can’t believe that one!)
Cheers!
www.TheGoldUpdate.com
www.deMeadville.com
and now on “X”: @deMeadvillePro
10 May 2024 – 08:37 Central Euro Time
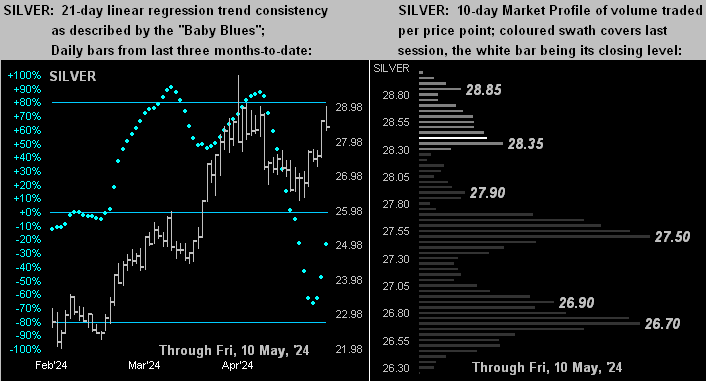
The Metals Triumvirate is on the move this morning as Gold, Silver and Copper are getting the bid, all at present above today’s neutral Zones; the other BEGOS Markets are within same and volatility is mostly light, the exception being Copper having already traced 73% of its EDTR (see Market Ranges). Gold appears on track for a positive weekly close for the first time since that ending 20 April; in real-time, the yellow metal still is +70 points above its smooth valuation line (see Market Values); and at Market Trends, Gold’s linreg remains negative, however the “Baby Blues” therein have today lurched to the upside, and the “textbook technicals” have begun turning positive; more on it all of course in tomorrow’s 756th consecutive Saturday edition of the Gold Update. In a day replete with FedSpeak, the Econ Baro concludes its week with May’s UoM Sentiment Survey and April’s Treasury Budget.
09 May 2024 – 08:31 Central Euro Time
At present we’ve the Bond below its Neutral Zone for today, whilst Silver is above same; BEGOS Markets’ volatility by this hour remains quite light, again in a week with little incoming EconData. Looking at Market Rhythms for pure swing consistency, on a 10-test basis our leader is Copper’s 1hr MACD; on a 24-test basis ’tis the Swiss Franc’s 30mn Moneyflow. By Market Trends, when just recently Copper was sporting the only positive linreg, positive too now are those for the Bond, Euro, Swiss Franc and Spoo; ’tis indicative for Fed rate cut expectations. Our best correlation amongst the five primary BEGOS components is positive between the Bond and the Euro. Simply today for the Econ Baro arrives last week’s Initial Jobless Claims.
08 May 2024 – 08:38 Central Euro Time
Both Copper and Oil are at present below today’s Neutral Zones; the other BEGOS Markets are within same, and volatility is again light. The Euro has yet to respond to its positive crossing of the smooth valuation line (see Market Values); still (in real-time), the Euro’s “Baby Blues” are now rising above their 0% axis, (see Market Trends) the linreg having turned positive; Market Profile support for the Euro is 1.07000; too, the Euro’s Best Market Rhythm (see the Euro’s page) is its daily Price Oscillator which appears poised to turn positive: 7 of the past 10 Price Oscillator crossings for the Euro (in either direction) have generated follow-through of at least 0.02000 points ($2,500/cac). Today for the Econ Baro we’ve March’s Wholesale Inventories.
07 May 2024 – 08:35 Central Euro Time
Both the Swiss Franc and Silver are currently below today’s Neutral Zones; the balance of the BEGOS Markets are within same, and volatility is light. We’re minding the Euro, as Friday (by Market Values) the currency confirmed a positive crossover of price above its smooth valuation line: the average follow-through of such crossings from a year ago-to-date is some 0.019 points, which from Friday’s settle at 1.07815 “suggests” the Euro reaching up toward the 1.10s; (the Euro is at present 1.07745); obviously “average” hardly is forward reality, however as “Fed rate cut” expectations are renewing, that has taken some puff out of the Dollar. Late in today’s session the Econ Baro looks to March’s Consumer Credit.
06 May 2024 – 08:24 Central Euro Time
The Swiss Franc is currently below today’s Neutral Zone; above same are the Metals Triumvirate and Oil, and BEGOS Markets volatility is mostly moderate, even as a week with little incoming EconData begins: just five metrics are due through Friday. The Gold Update muses over the “seasonality” of bank failures, noting (per Fitch) that 7% of U.S. banks are “stressed”; otherwise, Gold’s near-term technicals continue to appear negative despite a bit of a price bounce to start the week. Meanwhile, the S&P 500 has unwound its “textbook oversold” condition; and with about 75% of Q1 Earnings Season complete for the S&P, 65% (somewhat below average) have thus far improved their bottom lines from Q1 a year ago; the “live” (futs-adj’d) P/E is 38.2x and the yield 1.417%; the annualized three-month U.S. T-Bill yield is 5.235%.
The Gold Update: No. 755 – (04 May 2024) – “Own Gold with Reason into Bank Failure Season”


To wrap, we mentioned earlier with respect to the Fed those who fawn over every word, which may well include they who manage your money, i.e. the “pro” you know. But wait, there’s more: hat-tip Bloomy from just over a week ago when the “Casino 500” was weathering a minor correction: “Wall Street Humbled as Fast-Reversing Markets Confound the Pros.” Is that not oxymoronic? Any “pro” worth his or her salt ought hardly be “confounded” by anything the market does, certainly so when it declines from these ridiculously overvalued levels. Certainly stated: rather than “confounded”, a true “pro” ought be “expective” of significant (understatement) downside risk. Right? What are they missing?
“Math skills, mmb?“
Oh Squire, you’re just too good. But be it rate uncertainties, debased currencies, bank failures, “stoopid” equity values, geo-political jitters or the “confounded pro” whose hands are on your money…

…maintain sound reason and your wealth domain with Gold!
Cheers!
www.TheGoldUpdate.com
www.deMeadville.com
and now on “X”: @deMeadvillePro
03 May 2024 – 08:18 Central Euro Time
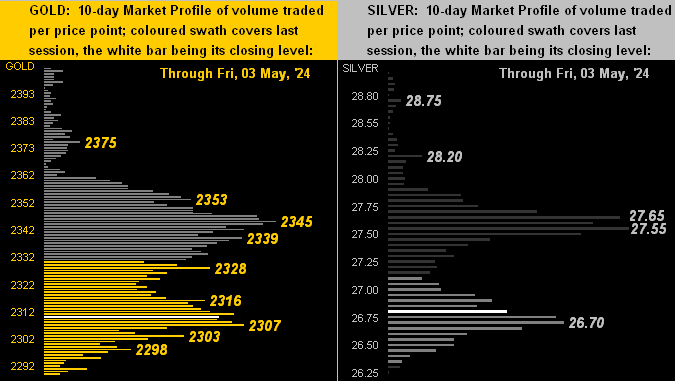
We’ve the Swiss Franc at present above its Neutral Zone for today; the seven other BEGOS Markets are within same, and volatility is again light. Our top three Market Rhythms on 10-test swing basis are the Spoo’s 1hr MACD and daily Parabolics, plus the Swiss Franc’s 15mn Parabolics; on 24-test swing basis they are Gold’s 15mn Moneyflow, Copper’s 8hr Moneyflow, and the Swiss Franc’s daily Parabolics. Looking at Market Values, Gold — which in recent weeks had been better than +200 points above its smooth valuation line — is now (in real-time) “just” +46 points above it; Oil is better than -4 points below same, and the Spoo -101 points by same; the Euro looks poised for the ensuing week to cross above its valuation line, which by rule would be a Long signal. The Econ Baro concludes its week with Aprils’ Payrolls data and the ISM(Svc) Index.
02 May 2024 – 08:19 Central Euro Time
At present we’ve both the Bond and Spoo above today’s Neutral Zones, whilst below same is Silver; BEGOS Markets’ volatility is light. The FOMC’s stance as anticipated was a fairly do-nothing non-event, notably as little has changed on the inflation front, (save for it not really slowing). At Market Trends, the “Baby Blues” of trend consistency are curling upward for the Bond, Euro and Spoo, even as the Fed (subtly or otherwise) is de-emphasizing the word “cut” without specifying “raise” (yet?); ‘course, we’ll continue to mid the math thereto. ‘Tis a busy inflow of metrics today for the Econ Baro, including March’s Trade Deficit and Factory Orders, as well as the initial look at Productivity and Unit Labor Costs for Q1.
01 May 2024 – 08:45 Central Euro Time
Save for the Swiss Franc, at present below today’s Neutral Zone, the seven other BEGOS Markets are within same, and volatility is very light, albeit in the context that some EDTRs (see Market Ranges) have been expanding of late, notably so that for the Spoo which is now measured at 74 points. As anticipated, in real-time the linregs for both Gold and Silver have now rotated to negative, leaving Copper as the only positive linreg BEGOS component. With better than half of S&P 500 companies having thus far reported earnings, the “live” P/E has favourably come off a bit, now 38.3x, but still extremely expensive by any historical earnings yardstick. The Econ Baro looks to April’s ADP Employment Data and ISM(Mfg) Index, plus March’s Construction Spending. 18:00 brings the FOMC’s Policy Statement and then Powell’s Presser.
30 April 2024 – 08:37 Central Euro Time
The final day of the year’s first quadrimestris finds early on all eight BEGOS Markets in the red; therein, the elements comprising the EuroCurrencies and Metals Triumvirate are all at present below their respective Neutral Zones for today, (the Bond, Oil and Spoo within same, albeit down). At Market Trends, both Gold and Silver appear within a day or two of their linregs rotating from positive to negative, which would leave Copper as the sole remaining component with a positive linreg; Gold remains above its smooth valuation line (see Market Values) in real-time by +78 points; still thus far today, the yellow metal already has broken below key Market Profile trading support (2342), current price now 2331. For the Econ Baro we’ve April’s Chi PMI and Consumer Confidence, plus Q1’s Employment Cost Index.
29 April 2024 – 08:32 Central Euro Time
A bit of Dollar weakness to begin “Fed Week”, the Euro and Swiss Franc (non-BEGOS Yen too) at present above today’s Neutral Zones; the balance of the BEGOS Markets are within same, and volatility is already is moderate-to-robust, the Swiss Franc having traced 108% of its EDTR (see Market Ranges). The Gold Update “apologetically” takes credit for price’s demise last Monday; further downside purely by near-term technicals is anticipated toward structural support in the 2247-2171 zone, (Gold currently is 2342). Thus far in Q1 Earnings Season, 64% of S&P 500 constituents have bettered their bottom lines from a year ago (a decent Earnings Season is at least 70% improvement), but the excessively high level of the Index hasn’t lowered the “live” P/E a wit (45.5x futs-adj’d). Given historical reversion to the P/E mean, the S&P remains, dare we say, dangerously high.
The Gold Update: No. 754 – (27 April 2024) – “Gold Falters, Treads Water”
Per a tongue-in-cheek note this past week to our StateSide Investors’ Roundtable, we apologized for single-handedly having “crashed” the precious metals’ markets with last Saturday’s missive (“Gold Fit to Pull Back a Bit”) following which on Monday — directly out of the chute — the yellow metal suffered its third-worst intraday high-to-low loss (-2.7% or -$62/oz.) in better than 14 months…
Too, Sweet Sister Silver’s simultaneous stint saw a -5.7% slam. Damn!
We nonetheless plead innocent for merely going with the math, a valued leading science which few anymore seem to do. For recently we’d written ad nauseum: “…near-term Gold is very over-extended; but broad-term Gold remains very undervalued…” And for you WestPalmBeachers down there, “near-term” plays out prior to “broad-term”, the former being exactly what Gold is now enduring, (i.e. ’tis going down). Or for those you scoring at home: mere math + historical repetition = leading knowledge. Hardly the “holy grail”, but given prudent cash management, ’tis on balance beneficial to one’s trading account. “Try it, you’ll like it!” –[Alka-Selzer, ’72].
Oh to be sure, Gold through just the first third of this year has already achieved our forecast high of 2375, indeed reaching up to 2449, albeit price settled yesterday (Friday) below both of those levels at 2350. And whilst we’re on record to not upwardly re-forecast a revised target, we’d be surprised should Gold not trade higher still as the year unfolds, even if the Federal Reserve raises rates. ‘Course, you regular readers know we’ve be musing since the start of this year over the Fed actually needing to again raise rates, contra to the non-math parroting crowd’s having called for as many as three rate cuts during 2024, (such expectations having lately been reduced to just one cut toward the end of the year).
But even should the Fed dutifully raise, such move — as we’ve in the past shown — wouldn’t automatically deter Gold from moving higher. Recall the three-year stint from 2004 through 2006: the FedFundsRate rose 425 basis points … and Gold rose +69%.
Thus whilst Gold is positioned just fine (thank you very much), when it comes to the stock market, it seems as if we’re in a constant state of hand-holding. On days when the S&P 500 rises +1%, FinMedia responses range from neutral to happy. But toss in a -1% down day, and many-a-headline goes catastrophic:
- “Markets Roiled by FedSpeak!”
- “Markets Plunge on Powell!”
- “Markets Tumble on Earnings Trouble!”
Good grief. The telling optics are that the FinMedia folks today have no concept of “Roiled”, “Plunge” nor “Tumble”. They weren’t around in ’87, ’02, ’09, et alia. Reprise The Temptations from ’66: ![]() “Get Ready”
“Get Ready”![]() .
.
And although we’re not predicting what would be a third -50% “correction” in just this century for the S&P, by math (oh-no, say it ain’t so) the setup is sitting there:
- Neither earnings nor yield are supportive of price;
- Twice as much money is invested in the S&P than exists (by “M2”); and
- Risk-free dough pays triple the S&P’s yield.
Back in “our day”, a stock was purchased to benefit from a methodically rising price based on earnings generation — plus for high-quality companies — a dividend yield. Today, stocks are purchased on expectations of their quickly quadrupling. ‘Tis why we regularly term this “The Investing Age of Stoopid”. Have a nice day.
Meanwhile, although April has been a losing month for the S&P, ’tis been a good month for Gold, as you know price having reached an All-Time High of 2449 (at precisely 07:15 GMT on the 9th). And with but two trading days remaining in April, ’tis close enough to month-end to bring up our BEGOS Markets Standings essentially through this year’s first quadrimestris. Therein, red-hot metal Copper –which a month ago had been sixth in this stack — is now leading the pack (a sign of continued inflation expectations), having even surpassed Oil, with Gold still on the podium scantly ahead of what is undoubtedly a pouting Sister Silver, just one-tenth of a percent behind in fourth:
Notwithstanding our ever-ongoing aforementioned misgivings about the terrifically overvalued stock market as measured by the S&P (aka “Casino”) 500, note in the Baro the “live” price/earnings ratio is now 45.0x (by trailing twelve months) which as we near the half-way mark of Q1 Earnings Season hasn’t — on a cap-weighted basis — declined a material wit, (’twas 46.1x at the start of Earnings Season).
Yes, some 64% of S&P constituents have thus far reported year-over-year earnings increases: but that impossibly supports a P/E of such level, indeed nearly double that of a dozen years ago. Also, the “all-risk” Casino’s yield is now 1.413% versus the “no-risk” annualized U.S. three-month T-Bill’s 5.238%. And yet the week was replete with such FinMedia headlines as (hat-tip Bloomy) –> “Magnificent Seven Roar…”, “Big Tech Surges…” and “AI Craze Powers Best Week…” Thus the great game of “Equities Chicken” continues.
Oooh, and we shan’t then close without mentioning this from the “Which Came First? The Chicken or the Egg? Dept.” (Hat-tip NewsMax) –> Engineers from The University of Colorado “Go Buffs!” at Boulder have conclusive research that folks over the age of 65 tend to slow down as it takes more energy to move than it does those younger. Which has us seriously considering a new career in the field of such paid-for research of obvious conclusion.
Either way conclusively, don’t you be a chicken: use our weekly research to buy and hold Gold!

Cheers!
www.TheGoldUpdate.com
www.deMeadville.com
and now on “X”: @deMeadvillePro
26 April 2024 – 08:37 Central Euro Time
Both the Bond and Copper currently are above today’s Neutral Zones; the balance of the BEGOS Markets are within same, and volatility is mostly light. Of note: the change in the Spoo at this time (5127.25, -4.50) belies the change in the S&P itself at the open given a material rise the Spoo after stocks had closed: at that present Spoo level, the S&P would open higher by some +46 points (+0.9%). Cac volume for Silver is moving from May into July: after Monday’s fallout for the precious metals, Gold and Silver have basically been treading water: however by Market Trends, their respective “Baby Blues” of trend consistency continue to drop, our old adage being “Follow the Blues instead of the news, else lose your shoes.” Widely followed today for the Econ Baro are March’s Personal Income/Spending and “Fed-favoured” Core PCE Prices.
25 April 2024 – 08:27 Central Euro Time
The EuroCurrencies (Euro and Swiss Franc) are at present above today’s Neutral Zones; the balance of the BEGOS Markets are within same, and volatility is light. Amongst the five primary BEGOS components, the best correlation is negative between the Bond and Gold. As for the five’s Market Values in real-time: the Bond is better than -6 points “low” vis-à-vis its smooth valuation line, the Euro -2.16 points “low”, Gold +96 points “high”, Oil right on its valuation line, and the Spoo -215 points “low”, (the S&P 500 itself now eight days “textbook oversold”, however fundamentally by earnings still catastrophically overvalued, the “live” P/E 43.6x). Incoming metrics for the Econ Baro today include March’s Pending Home Sales plus the first peek at Q1 GDP.
24 April 2024 – 08:22 Central Euro Time
The Bond is at present below its Neutral Zone for today; above same is Copper, the cac volume for which is rolling from May into July, and BEGOS Markets’ volatility is mostly light within the context that Market Ranges have been increasing these last couple of months. Leading our Market Rhythms for consistency is (on a 10-test swing basis) the Euro’s 1hr Parabolics; more broadly (on a 24-test swing basis) the Swiss Franc’s daily Parabolics continue to top that list. At Market Trends, as anticipated, we’ve confirmation of both precious metals’ “Baby Blues” having moved below their respective key +80% axes: thus we should see still lower prices for Gold and Silver near-term. The Econ Baro looks to March’s Durable Orders.
23 April 2024 – 08:15 Central Euro Time
All three elements of the BEGOS Markets’ Metals Triumvirate are at present below today’s Neutral Zones; the other components are within same, and volatility is light-to-moderate. On the heels of the current Gold Update’s near-term negative stance, Gold yesterday suffered its third-worst intraday high-to-low loss (-2.7%) since February a year ago; (’twas Silver’s fourth-worst [-5.7%] across the same 14-month stint). We expect to see lower near-term levels still for both precious metals as (in real-time) their respective “Baby Blues” are crossing below their key +80% axes (see Market Trends). Gold vis-à-vis its smooth Market Values line has essentially halved the recent +200-point gap, but still (in real-time) price is +99 points above valuation. The Econ Baro awaits March’s New Home Sales.
22 April 2024 – 08:29 Central Euro Time
The Bond, Swiss Franc, Gold, Silver and Oil are all at present below their respective Neutral Zones for today; above same is the Spoo, and BEGOS Markets’ volatility runs from light-to-robust, Silver having already traded 101% of its EDTR (see Market Ranges). The Gold Update cites the yellow metal as “fit to pull back a bit”, which on cue ’tis doing: still, our live Market Values shows price +162 points above its smooth valuation line; mind too at Market Trends the level and direction of Gold’s “Baby Blues” of trend consistency. As to the S&P 500, ’tis technically in a “textbook oversold” mode for the first time since late last October; regardless, the Index remain excessively high given its ongoing lack of earnings support: the futs-adj’d “live” P/E at this moment is 43.0x. The volume of incoming Q1 earnings is substantive as the week unfolds.
The Gold Update: No. 753 – (20 April 2024) – “Gold Fit to Pull Back a Bit”

Next week bring 10 metrics into the Econ Baro, the two most viewed to be:
- The first peek at Q1 Gross Domestic Product, the growth pace for which is expected to have slowed from that in Q4, and
- March’s “Fed-favoured” Personal Consumption Expenditures Prices, such paces not expected to have eased from those in February.
Nonetheless, despite a pending dip in the price of Gold, ‘tis best you continue to grab more and hold!

Cheers!
www.TheGoldUpdate.com
www.deMeadville.com
and now on “X”: @deMeadvillePro
19 April 2024 – 08:37 Central Euro Time
At present we’ve the Bond, Swiss Franc and Oil above today’s Neutral Zones; the Spoo is below same, and volatility is robust given markets responding to an escalation of conflict in the Middle East; of note, the Metals Triumvirate (Gold/Silver/Copper) along with the Euro are the least volatile (comparatively) of the BEGOS Markets thus far this session. We still sense some near-term retrenchment for Gold, and both it and Silver are nearing negative Market Magnet crossovers. The S&P 500 would appear to be enroute to a sixth consecutive down day, a streak not seen since 05-12 October 2002. The Dollar Index continues to hover above the 106 handle, a level last visited some five months ago. And as noted yesterday, the Econ Baro’s week has already concluded, the net result bringing a downward bent.
18 April 2024 – 08:21 Central Euro Time
Dough is finding its way into the BEGOS Markets: at present the Bond, Swiss Franc, all three components of the Metals Triumvirate and the Spoo are above today’s Neutral Zones; the Euro and Oil are within same, and volatility is pushing toward moderate. On a 10-test basis, these five Market Rhythms are leading the pack for swing consistency: the Bond’s daily Parabolics, Copper’s 12hr Parabolics and 6hr Price Oscillator; the Euro’s 2hr MACD, and the Spoo’s daily Parabolics. More broadly time-wise, the leader on the 24-test swing basis is the Swiss Franc’s daily Parabolics. The Econ Baro completes its week today, incoming metrics including April’s Philly Fed Index, plus March’s Existing Home Sales and Leading (i.e. “lagging”) Indicators.
17 April 2024 – 08:29 Central Euro Time
All eight BEGOS Markets are at present within their respective Neutral Zones for today; session volatility is again light. Going ’round the Market Values horn for the five primary components, as readings are excessive: the Bond is -8 points “low” vis-à-vis its smooth valuation line, the Euro -0.044 points “low”, Gold +189 points “high”, Oil +2.88 points “high”, and the Spoo -216 points “low”. Very early on in Q1 Earnings Season, with 23 S&P 500 constituents having thus far reported, only 13 (57%) have bettered their bottom lines of a year ago. The “live” P/E of the S&P (futs’-adj/d) is 44.7x and the yield 1.420%. No metrics are due today for the Econ Baro.
16 April 2024 – 08:20 Central Euro Time
The Swiss Franc is at present below its Neutral Zone for today; the other seven BEGOS Markets are within same, and volatility is light in context with all EDTRs (see Market Ranges) increasing of late. Speaking of the Swissie, its daily Parabolics are leading our Market Rhythms studies for consistency on a 24-test swing basis. As noted in the current edition of The Gold Update: “…the stock market [is] poised for a downward skate…” even as it has been descending over the past couple of weeks: indeed the Spoo’s daily Price Oscillator study indicated a fresh Short per this morning’s open; there is some arbitrary structural support into the lower 4900s, (depending upon one’s measuring of such); again, the S&P 500 remains a vastly overvalued index relative to earnings, especially in an attractively-positive risk-free interest rate environment. The Econ Baro looks to March’s Housing Starts/Permits and IndProd/CapUtil.
15 April 2024 – 08:44 Central Euro Time
The week begins with the Bond at present below its Neutral Zone; above same are the Euro, Swiss Franc, Gold, Silver and Spoo; and BEGOS Markets’ volatility is moderate-to-robust, notably for both Silver and Copper. The Gold Update cites our 2375 forecast having been achieved (last Tuesday); even so as price remains cheap relative to debasement valuation, Gold on a near-term basis remains excessively “overbought”: currently 2374, the Market Value smooth valuation line is but 2192. Looking at Market Trends for all eight BEGOS components, the 21-day linregs are positive for Gold, Silver, Copper and Oil; such trends are negative for negative for the Bond, Euro, Swiss Franc and Spoo; on balance, a rather an inflationary view, that. The Econ Baro starts a fairly busy week with April’s NY State Empire and NAHB Housing Indices, March’s Retail Sales, and February’s Business Inventories.
The Gold Update: No. 752 – (13 April 2024) – “Gold Achieves Our Forecast High for This Year”

To sum it all up with further Gold highs intact, let’s wrap with the stack:
The Gold Stack
Gold’s Value per Dollar Debasement, (from our opening “Scoreboard”): 3722
Gold’s All-Time Intra-Day High: 2449 (12 April 2024)
2024’s High: 2449 (12 April 2024)
10-Session directional range: up to 2449 (from 2249) = +200 points or +8.9%
Trading Resistance (Profile selection): 2413
Gold’s All-Time Closing High: 2391 (11 April 2024)
Gold Currently: 2360, (expected daily trading range [“EDTR”]: 44 points)
Trading Support (Profile selections): 2358 / 2346 / 2304 / 2292 / 2278
10-Session “volume-weighted” average price magnet: 2340
The 2000’s Triple-Top: 2089 (07 Aug ’20); 2079 (08 Mar’22); 2085 (04 May ’23)
The Weekly Parabolic Price to flip Short: 2023
The 300-Day Moving Average: 1996 and rising
2024’s Low: 1996 (14 February)
The Gateway to 2000: 1900+
The Final Frontier: 1800-1900
The Northern Front: 1800-1750
On Maneuvers: 1750-1579
The Floor: 1579-1466
Le Sous-sol: Sub-1466
The Support Shelf: 1454-1434
Base Camp: 1377
The 1360s Double-Top: 1369 in Apr ’18 preceded by 1362 in Sep ’17
Neverland: The Whiny 1290s
The Box: 1280-1240
Next week brings 13 metrics into the Econ Baro, plus Q1 Earnings Season ramps up, notably featuring financial institutions. We indeed sported a wry smile yesterday over the FinMedia’s concern of Wells Fargo (WFC) having beaten earnings “estimates”, but the stock then falling “on the news”. Perhaps ’twas because the company actually made less money than a year earlier, (but we’re not supposed to point that out). Best to point to that which broadly makes money and secures your world of wealth: Gold!

Cheers!
www.TheGoldUpdate.com
www.deMeadville.com
and now on “X”: @deMeadvillePro
12 April 2024 – 08:44 Central Euro Time
The Bond and the Metals Triumvirate are all at present above today’s Neutral Zones; below same are the EuroCurrencies, and BEGOS Markets’ volatility is pushing toward moderate. Gold has eclipsed the 2400 level (All-Time High now 2413): price (now 2408) is +222 points above its smooth valuation line (see Market Values); more of course in tomorrow’s 752nd consecutive Saturday edition of The Gold Update. And yet, the Dollar also is on the move, trading this week to levels not seen since mid-November, (Gold then nearly -400 lower points than today). The Econ Baro concludes its week with a bit more inflation information as it awaits March’s Ex/Im Prices, plus UofM’s Sentiment Survey. And banks start to report for Q1 Earnings Season.
11 April 2024 – 08:20 Central Euro Time
Similar to this time yesterday, ahead now of StateSide wholesale inflation, all eight BEGOS Markets are within today’s Neutral Zones, and volatility is light. At Market Trends, the Spoo’s “Baby Blues” for trend consistency are looking to cross their 0% axis as the linreg rotates from positive toward negative; technically for the S&P 500 itself, the daily parabolic trend, MACD and Moneyflow standard studies have all taken a negative bent; the Index’s “live” P/E (futs-adj’d) is 45.2x and the yield 1.387%. Gold (not unexpectedly) has mildly come off both its All-Time High (2385) and our year’s forecast high (2375): current price is 2354; Gold’s Market Magnet settled last evening at 2307; and by Market Values, Gold’s smooth valuation line is notably lower at 2179. Again today’s incoming metrics for the Econ Baro include March’s PPI.
10 April 2024 – 08:37 Central Euro Time
Yesterday (09 April) Gold achieved our forecast high price for this year at 2375; as you readers of the Gold Update know, at the beginning of the year we couched such call as “conservative”, and given some nine months now still remain in 2024, it well could be. Ahead of Stateside retail inflation, all eight BEGOS Markets are at present within their respective Neutral Zones for today, and volatility is very light, the average EDTR (see Market Ranges) tracing just 27% to this point. Looking at Market Profiles, we’ve trading support for the Bond at 117^22, the same for the Spoo at 5254, and for Oil at 85.20; Gold’s most dominantly traded handle of the past two weeks is 2304 and for the Euro ’tis 1.087. As noted, the Econ Baro awaits March’s CPI as well as the month’s Treasury Deficit, plus February’s Wholesale Inventories.
09 April 2024 – 08:45 Central Euro Time
At present, the Bond is above its Neutral Zone whilst below same is Copper; BEGOS Markets’ volatility is light. Leading Market Rhythms for consistency on a swing basis are: (10-test basis) Copper’s 6hr Price Oscillator, the Bond’s daily Parabolics, and Gold’s 15mn MACD; (24-test basis) the Swiss Franc’s daily Parabolics and Copper’s 6hr Parabolics. At Market Values for the Spoo, both price and its smooth valuation line finally have met; the deviation for Gold remains extremely stretched to the upside, in real-time by +198 points; for the other three primary BEGOS components: the Bond is 5 points “low”, the Euro 0.23 points “low” and Oil nearly 6 points “high”. Again, nothing is due today for the Econ Baro ahead of inflation data (CPI, PPI, Ex/Im Prices) through the balance of the week.
08 April 2024 – 08:32 Central Euro Time
The back-loaded EconData week is underway with the Bond, Swiss Franc, Copper and Oil all at present beneath their respective Neutral Zones for today; above same is Silver, and BEGOS Markets’ volatility is already mostly robust, the components of the Metals Triumvirate all well-exceeding their EDTRs (see Market Ranges). The Gold Update again cites (in a positive way) the “extreme” overbought technical near-term stance of price; so far this session, Gold has traded to within 3 points of our forecast high (2375) for this year: mind Gold’s Market Values graphic as to price vis-à-vis its smooth valuation line. As Q1 Earnings Season commences today, the “live” (futs-adj’d) P/E of the S&P is 46.6x, essentially double that since its inception a dozen years ago; the yield is a paltry 1.371% vs. 5.215% annualized on the risk-free US three-month T-Bill.
The Gold Update: No. 751 – (06 April 2024) – “Gold ‘Overbought’ is Great!”

To wrap, in that we’ve mentioned inflation, again ’tis on full display next week as the March data arrives at both the retail (Consumer Price Index) and Wholesale (Producer Price Index) levels. In both cases, consensus expects cooling. (We’ll believe it when we see it; on this side of the Pond it sure doesn’t feel like it). Still toward staying first rate: ensure your nuggets of financial wisdom include both Gold and Silver, as being “overbought” is great!

Cheers!
www.TheGoldUpdate.com
www.deMeadville.com
and now on “X”: @deMeadvillePro
05 April 2024 – 08:23 Central Euro Time
All three elements of the BEGOS Markets’ Metals Triumvirate are at present below their respective Neutral Zones for today; none of the other components are above same, and volatility runs the gamut from light-to-robust, Silver having already traced 102% of its EDTR (see Market Ranges). Following yesterday’s Commentary on the Spoo seeing its “Baby Blues” (see Market Trends) having slipped below their key +80% axis as well as the S&P 500 being in a historically extreme overbought streak, an inevitable price dump emerged: to the extent it becomes material near-term remains to be seen, the Spoo up a tad this morning. In the day’s balance, the Econ Baro looks to March’s Payrolls data, followed late in the session by February’s Consumer Credit.
04 April 2024 – 08:33 Central Euro Time
Silver — for which the net gain across the past two trading days was +8.3% — is at present below today’s Neutral Zone, as is the Bond; above same is Copper, and volatility for the BEGOS Markets is mostly light. The Spoo’s “Baby Blues” (see Market Trends) confirmed settling beneath their key +80% axis, thus indicative of lower price levels near-term, although two of the past six like downside signals from a year ago-to-date have produced minimal material downside given the S&P 500 having been in “straight-up” mode. Indeed through yesterday, the S&P recorded its 52nd consecutive trading session as “textbook overbought” which ranks fifth for such streaks in better than four decades. With Q1 Earnings Season commencing next week, the “live” (futs-adj’d) P/E is now 46.7x. Today’s incoming Econ Baro metrics include February’s Trade Deficit.
03 April 2024 – 08:26 Central Euro Time
At present we’ve both Silver and Copper above today’s Neutral Zones; below same are both Oil and the Spoo, and BEGOS Markets’ volatility is again mostly light; (both the white and red metals have traced better than 50% of their EDTRs [see Market Ranges]). Looking at Market Values (in real-time): the Bond is nearly -4.5 points “low” vis-à-vis its smooth valuation line, the Euro nearly -0.03 points “low”, Gold +166 points “high”; Oil +4.9 points “high”, and the Spoo now down to just +29 points “high”. Specific to Gold’s “high” deviation, such extremes are rare and have historically led to price pullbacks near-to-medium term; ‘course since Gold is (finally) getting a bid these days, history may not necessarily repeat: rather, the smooth valuation line can instead catch up to price. The Econ Baro looks to March’s ADP Employment data and the ISM(Svc) Index.
02 April 2024 – 08:33 Central Euro Time
Early on we’ve the two EuroCurrencies below today’s Neutral Zones, whilst above same is Silver; BEGOS Markets volatility is mostly light as most ETDRs (see Market Ranges) are narrowing, save for those of the Metals Triumvirate. The Dollar continues getting a bid now to nearly a two-month high as Fed rate cuts fade a bit from FinMedia wishful reporting. Looking at Market Rhythm swing consistencies (on a 10-test basis), we’ve five of note per late night’s data runs: Oil’s 60mn Moneyflow, Copper’s 6hr Price Oscillator, the Spoo’s daily Parabolics, and for the Bond both its 2hr Moneyflow and daily Parabolics. The Econ Baro awaits February’s Factory Orders.
01 April 2024 – 09:26 Central Euro Time
The BEGOS Markets’ Metals Triumvirate are all above today’s Neutral Zones, as is the Spoo; none of the other components are below same, and volatility runs from light-to-robust, Gold already having traced 102% of its EDTR (see Market Ranges). Gold, with its fresh June premium, is now 2281, within 100 points of our forecast high for this year of 2375; The Gold Update remains a bit wary of Gold being technically over-extended near term; too therein, February’s PCE data (reported during Friday’s holiday) confirms a five-month rising trend of inflation by that metric. Regardless, the Spoo at present (5330) is poised such that the S&P 500 would open at a record high. Due for the Econ Baro is March’s ISM(Mfg) Index and February’s Construction Spending.
The Gold Update: No. 750 – (30 March 2024) – “Gold Reaps More Record Ground”

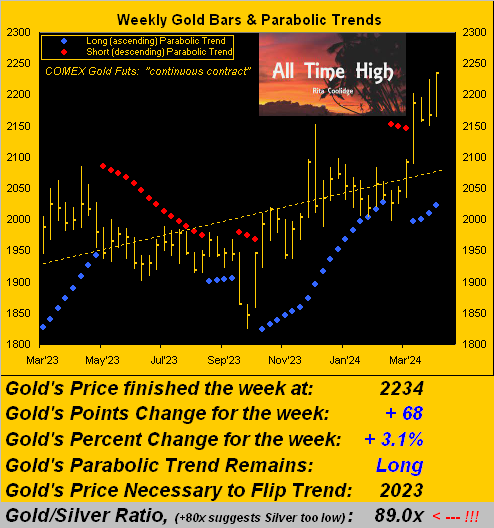
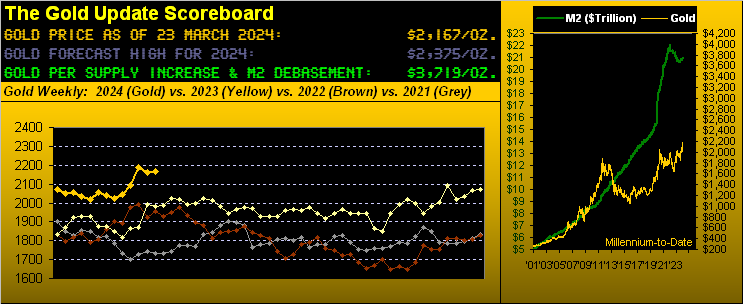
Welcome one and all to the 750th consecutive Saturday edition of The Gold Update. Having missed nary a Saturday since our first missive (20 November 2009) with Gold then 1151, price since has nearly doubled (+94%), toward settling this past shortened trading week on Thursday at the latest All-Time High of 2234. Thus we’ve a milestone price for Gold in synch with this milestone missive.
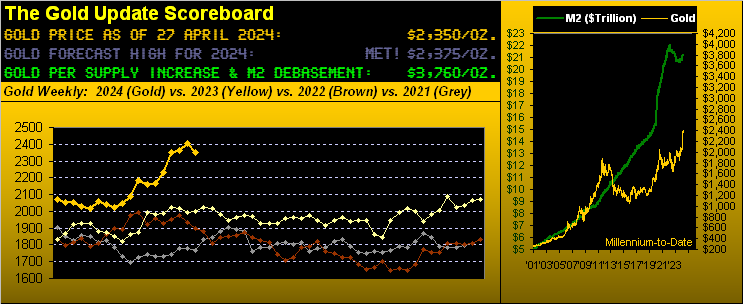
To be sure across the same stint, Gold supply’s tonnage has increased +23% for which we rightly account in the above Scoreboard valuation of 3719; but the U.S. liquid money supply (“M2”) has far more overwhelmingly increased +147% (that’s 2.5x for those of you scoring at home). ‘Tis reason right there to make sure you own Gold!
So as we turn to Gold’s weekly bars and parabolic trends from one year ago-to-date, let’s again cue Rita Coolidge from back in ’83 with ![]() “All Time High”
“All Time High”![]() :
:
To close — given that the yellow metal is at an All-Time High — nothing could be more appropriate to wrap than with The Gold Stack, with the June contract but one row below debasement valuation:
The Gold Stack
Gold’s Value per Dollar Debasement, (from our opening “Scoreboard”): 3719
JUNE Gold Currently: 2255, (expected daily trading range [“EDTR”]: 30 points)
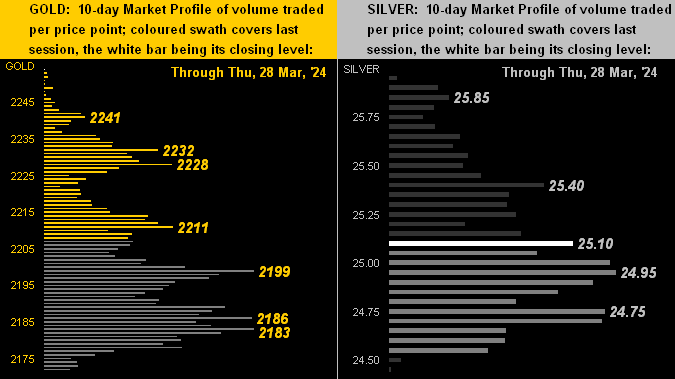
Trading Support (basis June): 2241 / 2232 / 2228 / 2211 / 2199 / 2186 / 2183
Gold’s All-Time Intra-Day High: 2234 (28 March 2024)
2024’s High: 2234 (28 March)
10-Session directional range: up to 2234 (from 2149) = +85 points or +4.0%
Gold’s All-Time Closing High: 2234 (28 March 2024)
Trading Resistance: (none)
10-Session “volume-weighted” average price magnet (basis June): 2202
The 2000’s Triple-Top: 2089 (07 Aug ’20); 2079 (08 Mar’22); 2085 (04 May ’23)
The Weekly Parabolic Price to flip Short: 2023
2024’s Low: 1996 (14 February)
The 300-Day Moving Average: 1983 and rising
The Gateway to 2000: 1900+
The Final Frontier: 1800-1900
The Northern Front: 1800-1750
On Maneuvers: 1750-1579
The Floor: 1579-1466
Le Sous-sol: Sub-1466
The Support Shelf: 1454-1434
Base Camp: 1377
The 1360s Double-Top: 1369 in Apr ’18 preceded by 1362 in Sep ’17
Neverland: The Whiny 1290s
The Box: 1280-1240
So there we’ve missive No. 750 as magnificently aligned with a Gold All-Time High. Will it get any better? ‘Course ’twill! Just make sure you make your move with Gold!

Cheers!
www.TheGoldUpdate.com
www.deMeadville.com
and now on “X”: @deMeadvillePro
28 March 2024 – 09:07 Central Euro Time
The week’s final trading day is underway with the Euro, Swiss Franc and Silver all at present below today’s Neutral Zones; the other BEGOS Markets are within same, and volatility is light-to-moderate, the Euro, Gold and Copper already exceeding 50% of their respective EDTRs (see Market Ranges). Per our S&P 500 Moneyflow page, all three time measures (week, month, quarter) are lately indicative of money not flowing from the Index, but neither is inflow increasing; the “live P/E of the S&P (futs’adj’d) is now 47.3x, which as you regular readers know is essentially double that since this measure’s inception a dozen years ago: the S&P thus remains significantly (understatement) expensive. ‘Tis a busy two days for the Econ Baro: today’s incoming metrics include March’s Chi PMI and revision to the UofM Sentiment Survey, February’s Pending Home Sales, and the final revision to Q4 GDP. Tomorrow whilst the markets are closed the Baro nonetheless looks to February’s Personal Income/Spending, plus the “Fed-favoured” PCE data. Joyeuses Pâques à Tous !
27 March 2024 – 09:18 Central Euro Time
Both the Swiss Franc and Oil are at present below today’s Neutral Zones; otherwise the BEGOS Markets are within same, and volatility is light. Looking at Market Rhythms , the most consistent on a 10-test swing basis is the Spoo’s daily Parabolics, whilst on a 24-test swing basis ’tis the Euro’s 15mn Price Oscillator. Market Values’ deviations of note are the Euro as some -0.02 points “low” per its smooth valuation line, Gold as +68 points “high” and the Spoo as +90 points “high”. And as previously noted, at Market Trends Silver’s “Baby Blues” of consistency confirmed dropping below their key +80% axis suggestive of lower price levels near-term. Nothing is due today for the Econ Baro ahead of a data barrage both Thursday and Friday (the markets being shut on the latter).
26 March 2024 – 09:14 Central Euro Time
The Swiss Franc, Silver and Copper are all at present below their respective Neutral Zones for today; the other BEGOS Markets are within same, and volatility is mostly light, save for Copper which has already traced 62% if its EDTR (see Market Ranges). At Market Trends (in real-time), the “Baby Blues” of trend consistency for both Silver and Copper have dropped below their key +80% axes. Gold’s negative technicals (covered in the current Gold Update) have yet to similarly affect price: too, Gold’s cac volume today is rolling from April into that for June, in turn adding +22 points of fresh premium to price. For the Econ Baro today we’ve March’s Consumer Confidence and February’s Durable Orders.
25 March 2024 – 09:18 Central Euro Time
We start the shortened week with Copper at present above its Neutral Zone for today; all the other BEGOS Markets are within same, and volatility is light-to-moderate. The Gold Update graphically lays out the increasing inflation scenario, querying if the Fed has lost its “cred”; too, the Update cites near-term negative technical measures for Gold and that there is little structural support sub-2150 until 2050, (were price to materially let go); of course, the broader weekly parabolic trend remains firmly Long. The S&P 500 is 45 days “textbook overbought”, placing it in the 98th percentile of such overbought conditions since at least the year 1980; the “live” (futs-adj’d) P/E is presently 46.2x. The Econ Baro looks to February’s New Home Sales.
The Gold Update: No. 749 – (23 March 2024) – “Gold’s Fresh Highs; Fed’s Cred Demise?”
“So, mmb, the question becomes ‘How low is low’, eh?“
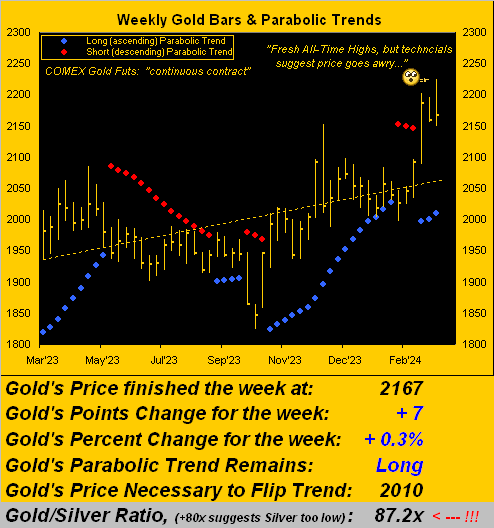
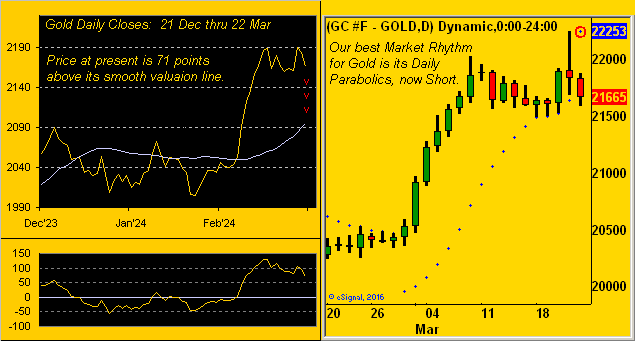
So ’tis, Squire, (barring the technicals instead catching up to price, which again in a bullish breakout is mathematically natural). Regardless, in looking above at the right-hand panel of Gold since a month ago, “The Big Move” in round numbers was +100 points from 2050 to 2150. Thus by structural support, that latter number ideally would be as low as Gold goes near-term. But with three technical negatives all simultaneously in play (price above value, Short daily parabolic trend, and as noted we’ll see, a breakdown in Gold’s “Baby Blues”), we sense 2150 shall bust, (this past week’s low having already touched 2149, but ’twas prior to Thursday’s 2225 All-Time High).
Nonetheless, does all that mean a full retracement back down to 2050 is warranted? ‘Tis dependent on buyside enthusiasm: through the 57 trading days year-to-date, Gold’s average daily COMEX contract volume is 208,633; yet for these past five days, the average is +15% higher at 240,638. We can therefore say that “Gold is in play”: however, Friday’s down day (high-to-low from 2188-to-2158) sported Gold’s largest one-day contract volume this year at 391,750, such “mo-mo suggesting more low” should dip buyers wait out more downside show. ‘Course, broadly on balance, Gold continues to look good to go with eventually higher levels to bestow.
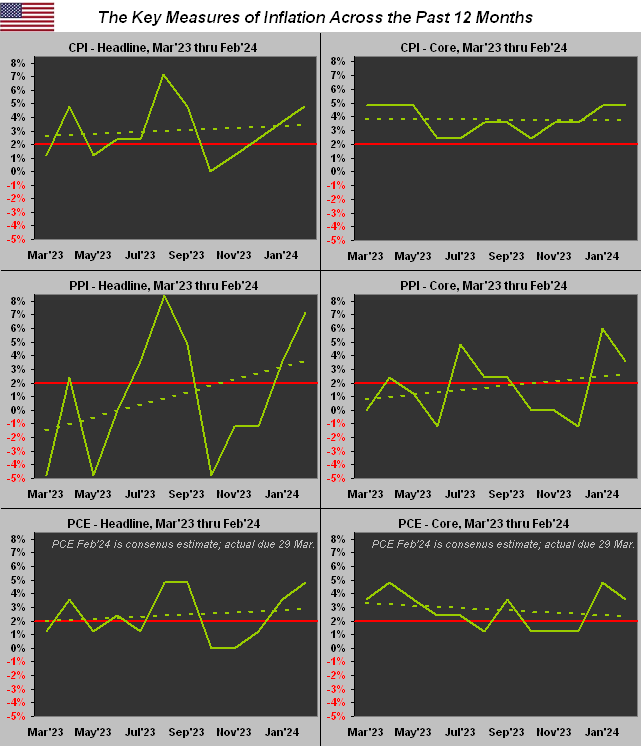
Meanwhile, bestowed upon a needy, stagflative Economic Barometer this past week was improved data for housing. The National Association of Home Builders Index gained ground in March as did February’s readings for Housing Starts, Building Permits, and Existing Home Sales. In an otherwise light week for incoming data, the only “negative” metric was a slowing in March’s Philly Fed Index: but its result (3.2) was positive for just the fourth time in the past 22 months: ![]() “Fly, Eagles Fly”
“Fly, Eagles Fly”![]() [Borrelli/Courtland, ’55]. Here’s the Baro:
[Borrelli/Courtland, ’55]. Here’s the Baro:
To close, we’ve these few quick quips.
This past Tuesday we awoke to read that Kazuo Ueda and his mates at Nippon Ginkō — for the first time in 17 years — put positive the bank’s overnight lending rate in raising it from -0.1% to a sought range of 0.0% to 0.1%. Still, it all seems rather wee, but as goes the saying: “Saké to me, Saké to me, Saké to me…”
This past Thursday with Swiss precision at 09:00 CET, Tommy Jordan and his lads at Schweizerische Nationalbank cut — without scheduled notice — both their key lending and deposit rates to 1.50%. This in turn elicited the Swiss Franc’s largest single session high-to-low drop (-1.69%) versus the Dollar in better than a year. Or how would Emmental Robin put: “Holy cheese, Batman!”
And from the “You Can’t Make This BS Up Dept.”, hardly complete would be the week without having learned from “ABC News!” that according to The World Happiness Report, the Good Old USA no longer ranks amongst the Top 20 Happiest Countries. Aw shucks. But when your nation averages some 45 murders per day (per the Kaman Law Firm), ’tis hard to be happy. Indeed, that’s America, babe: “Death and Taxes!”
Rather, seek that which is more life-and-monetary sustaining:

And Gold in any denomination is still Gold!
Cheers!
www.TheGoldUpdate.com
www.deMeadville.com
and now on “X”: @deMeadvillePro
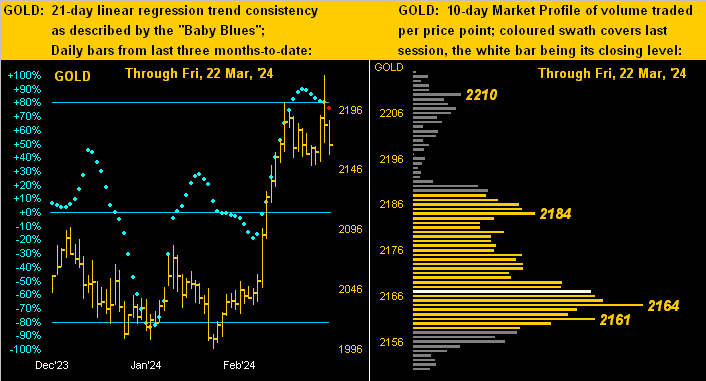
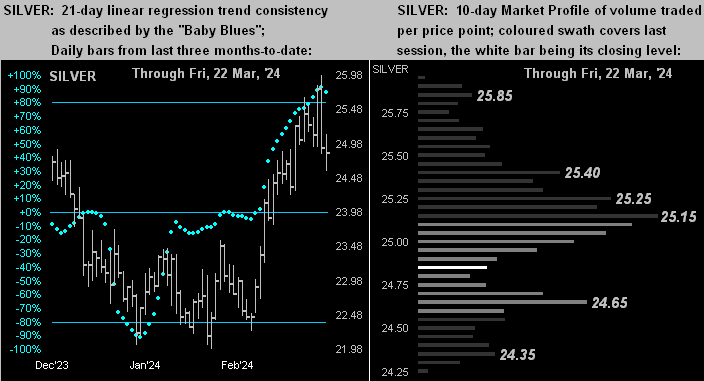
22 March 2024 – 09:25 Central Euro Time
The EuroCurrencies and Metals Triumvirate are all at present below their respective Neutral Zones for today; the balance of the BEGOS Markets are within same, and volatility is firmly moderate. Whilst by Market Ranges most of the EDTRs are on the rise, ’tis not the case for either the Bond nor Oil, (nor to a minor extent, the Euro). Yesterday’s high-to-low plunge in the Swiss Franc of -1.69% was the largest across the day’s range in better than a year (since 15 March ’23) on the heels of the Schweizerische Nationalbank unscheduled reduction of its key interest rate. Looking at Market Rhythms for consistency, our 10-test swing leader is the Spoo’s daily Parabolics, (see too the Yen’s 15mn Moneyflow study); on the 24-test basis ’tis the Swiss Franc’s daily Parabolics. The Econ Baro’s week is complete.
21 March 2024 – 09:07 Central Euro Time
The Swiss Franc, Copper, Spoo and Gold are all at present above today’s Neutral Zones: the yellow metal recorded a new high overnight at 2225; BEGOS Markets volatility is moderate-to-robust, Gold notably having traced 135% of its EDTR (see Market Ranges); and by Market Values (in real-time) price (currently 2209) is +119 points above its smooth valuation line. Per the Fed’s math, even as inflation is increasing, they calculate it as decreasing; more on that in the next Saturday edition of The Gold Update. The Econ Baro wraps its week today, income metrics including Q4’s Current Account Deficit, March’s Philly Fed Index, plus February’s Existing Home Sales and Leading (i.e. “lagging”) Indicators.
20 March 2024 – 09:11 Central Euro Time
Spring starts similarly to Winter’s final day, with (save for the Bond) all the BEGOS Markets at present in the red ahead of the Fed; volatility is mostly light (Copper having already traced 63% of its EDTR — see Market Ranges). ‘Twill be interesting to note (perhaps during Chair Powell’s post-FOMC Policy Statement presser) if a FinMedia member brings up the notion of a rate hike, (all as luridly updated in the current edition of The Gold Update). As for the S&P 500, the “live” (futs-adj’d) P/E is 45.8x and the yield 1.380%; that for the 3-month T-Bill is 5.238% annualized. Nothing is due today for the Econ Baro.
19 March 2024 – 09:36 Central Euro Time
All eight BEGOS Markets are at present in the red; session volatility is mostly moderate; of note, the Yen (not as yet a BEGOS component) has traced 168% of its EDTR (see Market Ranges for those of the BEGOS Markets), as the BOJ ends its era of negative interest rates. Looking at Market Rhythms, our leader for consistency on a pure swing 10-test basis is Gold’s 30mn Price Oscillator, whilst on a 24-test basis ’tis the Swiss Franc’s 6hr Parabolics; indeed by Market Trends, the Swiss Franc is the only component now sporting a negative linreg: were there a “hawkish hint” in the FOMC’s Policy Statement (tomorrow) ‘twould likely add to Dollar strength. The Econ Baro awaits February’s Housing Starts/Permits.
18 March 2024 – 09:07 Central Euro Time
Both Oil and the Spoo are at present above their respective Neutral Zones for today; the balance of the BEGOS Markets are within same, and volatility is light. The Gold Update continues (at the very least) to muse over the notion of the Fed at some point actually having to raise rates: therein, our updated inflation table tells the story. The yellow metal itself as “expected” is coming off the recent All-Time High of 2203 (currently 2155) given the excessive distance of price above its smooth valuation line, that live reading now +79 points (see Market Values). ‘Tis a light week of data for the Econ Baro, beginning today with March’s NAHB Housing Index.