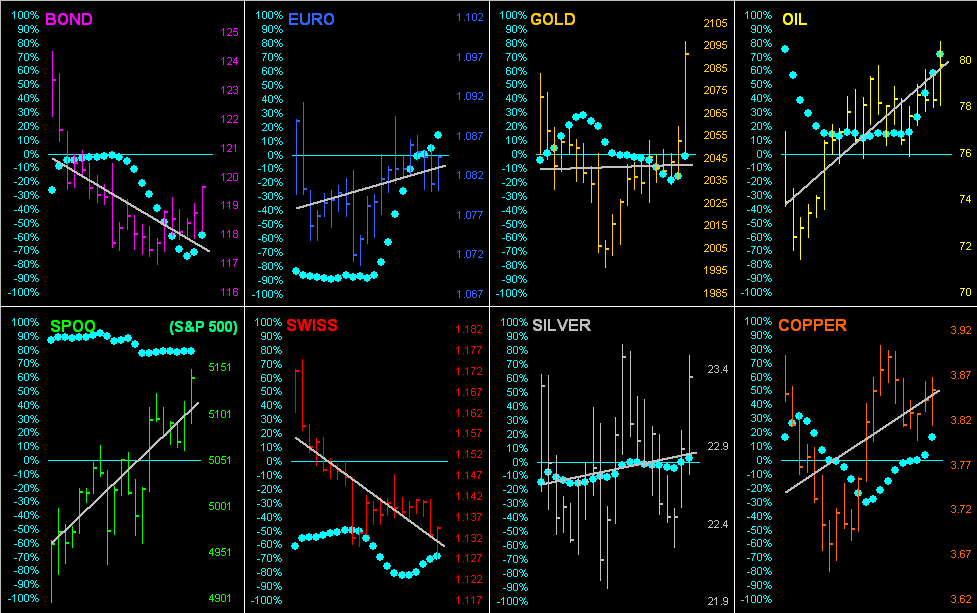
Early on we’ve the two EuroCurrencies below today’s Neutral Zones, whilst above same is Silver; BEGOS Markets volatility is mostly light as most ETDRs (see Market Ranges) are narrowing, save for those of the Metals Triumvirate. The Dollar continues getting a bid now to nearly a two-month high as Fed rate cuts fade a bit from FinMedia wishful reporting. Looking at Market Rhythm swing consistencies (on a 10-test basis), we’ve five of note per late night’s data runs: Oil’s 60mn Moneyflow, Copper’s 6hr Price Oscillator, the Spoo’s daily Parabolics, and for the Bond both its 2hr Moneyflow and daily Parabolics. The Econ Baro awaits February’s Factory Orders.
 Mark
Mark
01 April 2024 – 09:26 Central Euro Time
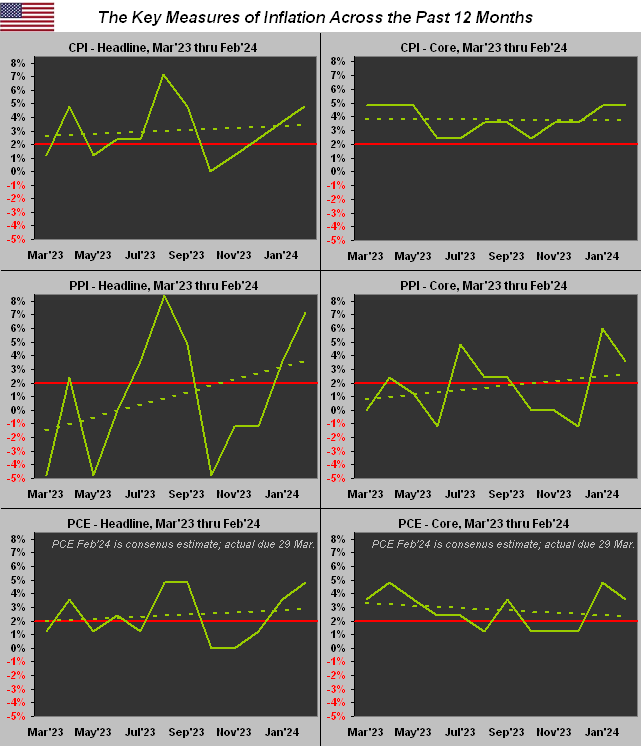
The BEGOS Markets’ Metals Triumvirate are all above today’s Neutral Zones, as is the Spoo; none of the other components are below same, and volatility runs from light-to-robust, Gold already having traced 102% of its EDTR (see Market Ranges). Gold, with its fresh June premium, is now 2281, within 100 points of our forecast high for this year of 2375; The Gold Update remains a bit wary of Gold being technically over-extended near term; too therein, February’s PCE data (reported during Friday’s holiday) confirms a five-month rising trend of inflation by that metric. Regardless, the Spoo at present (5330) is poised such that the S&P 500 would open at a record high. Due for the Econ Baro is March’s ISM(Mfg) Index and February’s Construction Spending.
The Gold Update: No. 750 – (30 March 2024) – “Gold Reaps More Record Ground”

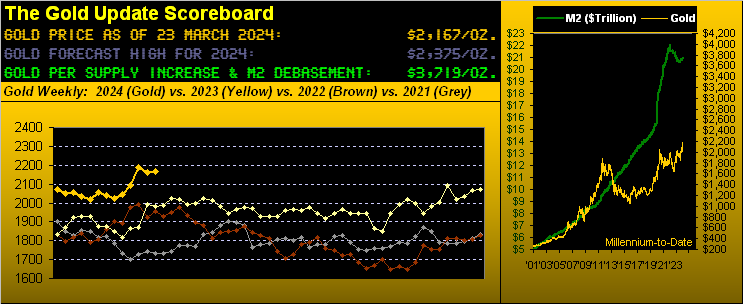
Welcome one and all to the 750th consecutive Saturday edition of The Gold Update. Having missed nary a Saturday since our first missive (20 November 2009) with Gold then 1151, price since has nearly doubled (+94%), toward settling this past shortened trading week on Thursday at the latest All-Time High of 2234. Thus we’ve a milestone price for Gold in synch with this milestone missive.
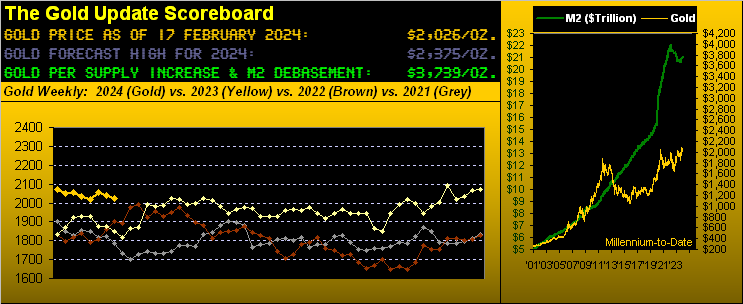
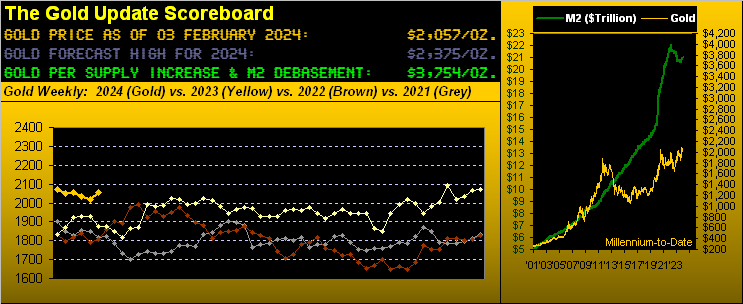
To be sure across the same stint, Gold supply’s tonnage has increased +23% for which we rightly account in the above Scoreboard valuation of 3719; but the U.S. liquid money supply (“M2”) has far more overwhelmingly increased +147% (that’s 2.5x for those of you scoring at home). ‘Tis reason right there to make sure you own Gold!
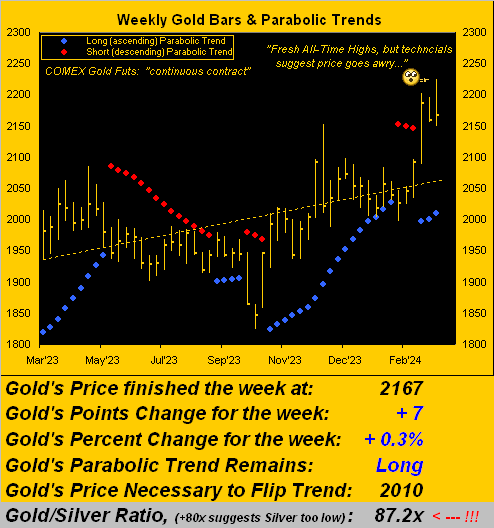
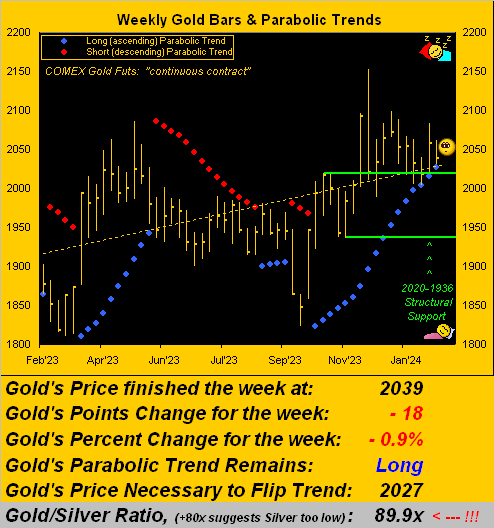
So as we turn to Gold’s weekly bars and parabolic trends from one year ago-to-date, let’s again cue Rita Coolidge from back in ’83 with ![]() “All Time High”
“All Time High”![]() :
:
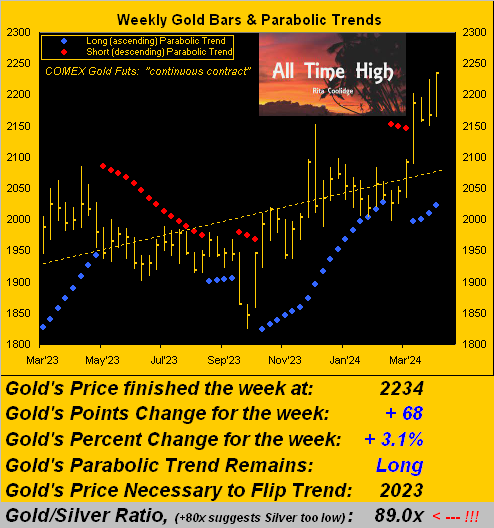
To close — given that the yellow metal is at an All-Time High — nothing could be more appropriate to wrap than with The Gold Stack, with the June contract but one row below debasement valuation:
The Gold Stack
Gold’s Value per Dollar Debasement, (from our opening “Scoreboard”): 3719
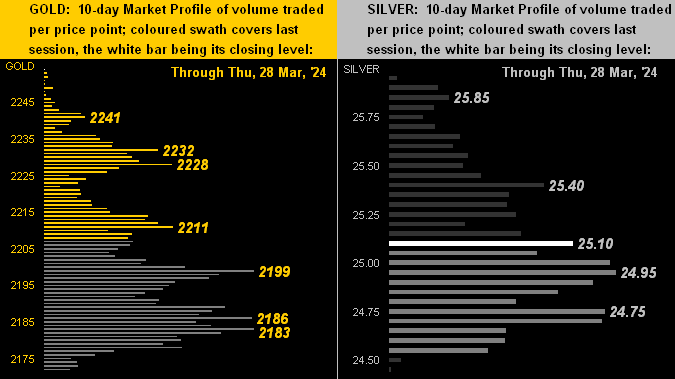
JUNE Gold Currently: 2255, (expected daily trading range [“EDTR”]: 30 points)
Trading Support (basis June): 2241 / 2232 / 2228 / 2211 / 2199 / 2186 / 2183
Gold’s All-Time Intra-Day High: 2234 (28 March 2024)
2024’s High: 2234 (28 March)
10-Session directional range: up to 2234 (from 2149) = +85 points or +4.0%
Gold’s All-Time Closing High: 2234 (28 March 2024)
Trading Resistance: (none)
10-Session “volume-weighted” average price magnet (basis June): 2202
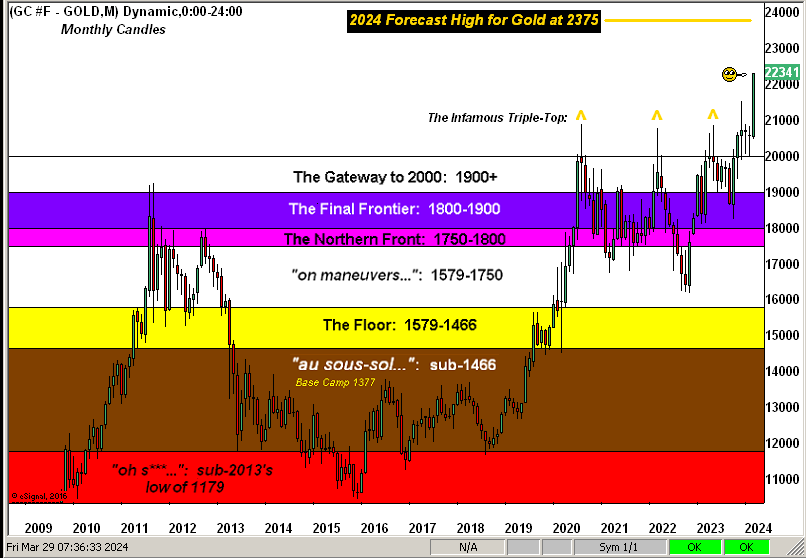
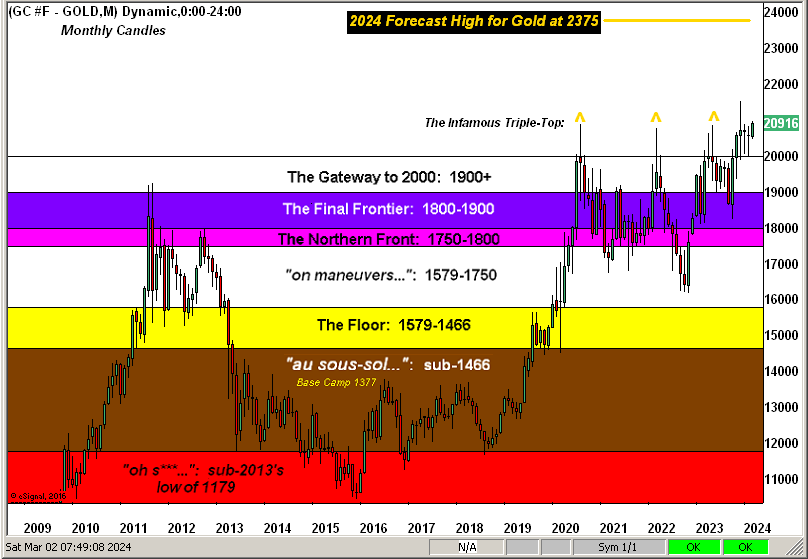
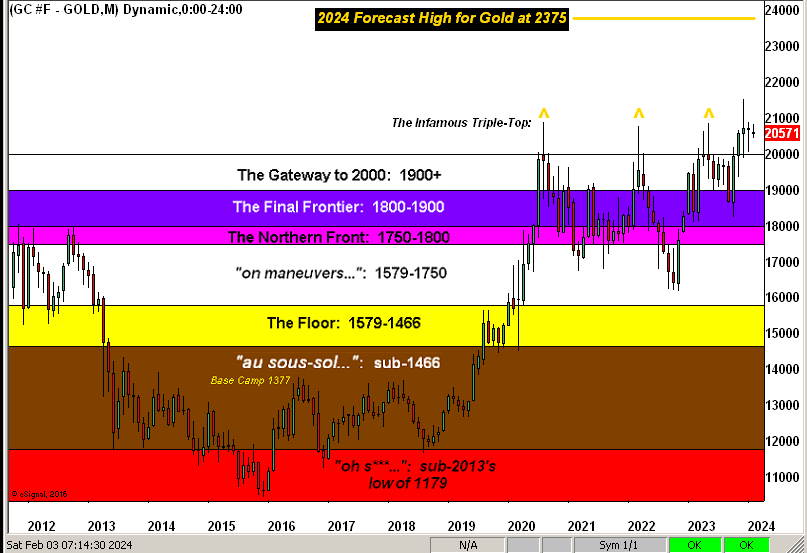
The 2000’s Triple-Top: 2089 (07 Aug ’20); 2079 (08 Mar’22); 2085 (04 May ’23)
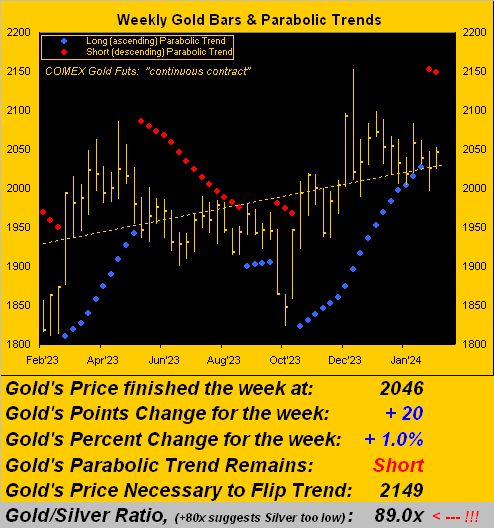
The Weekly Parabolic Price to flip Short: 2023
2024’s Low: 1996 (14 February)
The 300-Day Moving Average: 1983 and rising
The Gateway to 2000: 1900+
The Final Frontier: 1800-1900
The Northern Front: 1800-1750
On Maneuvers: 1750-1579
The Floor: 1579-1466
Le Sous-sol: Sub-1466
The Support Shelf: 1454-1434
Base Camp: 1377
The 1360s Double-Top: 1369 in Apr ’18 preceded by 1362 in Sep ’17
Neverland: The Whiny 1290s
The Box: 1280-1240
So there we’ve missive No. 750 as magnificently aligned with a Gold All-Time High. Will it get any better? ‘Course ’twill! Just make sure you make your move with Gold!

Cheers!
…m…
www.TheGoldUpdate.com
www.deMeadville.com
and now on “X”: @deMeadvillePro
28 March 2024 – 09:07 Central Euro Time
The week’s final trading day is underway with the Euro, Swiss Franc and Silver all at present below today’s Neutral Zones; the other BEGOS Markets are within same, and volatility is light-to-moderate, the Euro, Gold and Copper already exceeding 50% of their respective EDTRs (see Market Ranges). Per our S&P 500 Moneyflow page, all three time measures (week, month, quarter) are lately indicative of money not flowing from the Index, but neither is inflow increasing; the “live P/E of the S&P (futs’adj’d) is now 47.3x, which as you regular readers know is essentially double that since this measure’s inception a dozen years ago: the S&P thus remains significantly (understatement) expensive. ‘Tis a busy two days for the Econ Baro: today’s incoming metrics include March’s Chi PMI and revision to the UofM Sentiment Survey, February’s Pending Home Sales, and the final revision to Q4 GDP. Tomorrow whilst the markets are closed the Baro nonetheless looks to February’s Personal Income/Spending, plus the “Fed-favoured” PCE data. Joyeuses Pâques à Tous !
27 March 2024 – 09:18 Central Euro Time
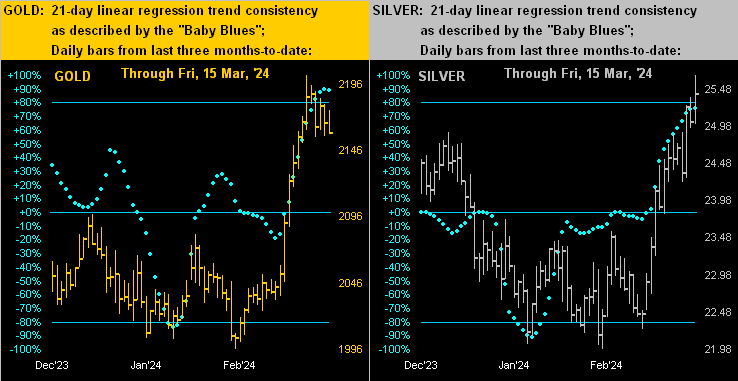
Both the Swiss Franc and Oil are at present below today’s Neutral Zones; otherwise the BEGOS Markets are within same, and volatility is light. Looking at Market Rhythms , the most consistent on a 10-test swing basis is the Spoo’s daily Parabolics, whilst on a 24-test swing basis ’tis the Euro’s 15mn Price Oscillator. Market Values’ deviations of note are the Euro as some -0.02 points “low” per its smooth valuation line, Gold as +68 points “high” and the Spoo as +90 points “high”. And as previously noted, at Market Trends Silver’s “Baby Blues” of consistency confirmed dropping below their key +80% axis suggestive of lower price levels near-term. Nothing is due today for the Econ Baro ahead of a data barrage both Thursday and Friday (the markets being shut on the latter).
26 March 2024 – 09:14 Central Euro Time
The Swiss Franc, Silver and Copper are all at present below their respective Neutral Zones for today; the other BEGOS Markets are within same, and volatility is mostly light, save for Copper which has already traced 62% if its EDTR (see Market Ranges). At Market Trends (in real-time), the “Baby Blues” of trend consistency for both Silver and Copper have dropped below their key +80% axes. Gold’s negative technicals (covered in the current Gold Update) have yet to similarly affect price: too, Gold’s cac volume today is rolling from April into that for June, in turn adding +22 points of fresh premium to price. For the Econ Baro today we’ve March’s Consumer Confidence and February’s Durable Orders.
25 March 2024 – 09:18 Central Euro Time
We start the shortened week with Copper at present above its Neutral Zone for today; all the other BEGOS Markets are within same, and volatility is light-to-moderate. The Gold Update graphically lays out the increasing inflation scenario, querying if the Fed has lost its “cred”; too, the Update cites near-term negative technical measures for Gold and that there is little structural support sub-2150 until 2050, (were price to materially let go); of course, the broader weekly parabolic trend remains firmly Long. The S&P 500 is 45 days “textbook overbought”, placing it in the 98th percentile of such overbought conditions since at least the year 1980; the “live” (futs-adj’d) P/E is presently 46.2x. The Econ Baro looks to February’s New Home Sales.
The Gold Update: No. 749 – (23 March 2024) – “Gold’s Fresh Highs; Fed’s Cred Demise?”
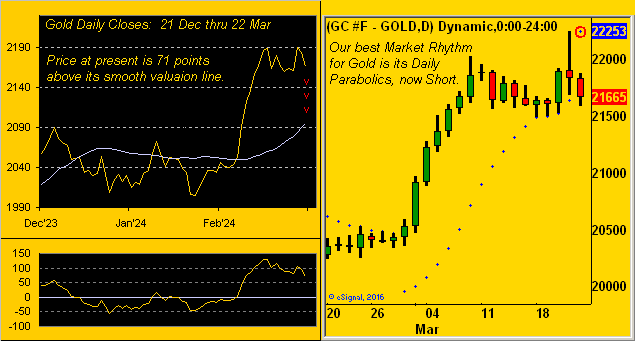
“So, mmb, the question becomes ‘How low is low’, eh?“
So ’tis, Squire, (barring the technicals instead catching up to price, which again in a bullish breakout is mathematically natural). Regardless, in looking above at the right-hand panel of Gold since a month ago, “The Big Move” in round numbers was +100 points from 2050 to 2150. Thus by structural support, that latter number ideally would be as low as Gold goes near-term. But with three technical negatives all simultaneously in play (price above value, Short daily parabolic trend, and as noted we’ll see, a breakdown in Gold’s “Baby Blues”), we sense 2150 shall bust, (this past week’s low having already touched 2149, but ’twas prior to Thursday’s 2225 All-Time High).
Nonetheless, does all that mean a full retracement back down to 2050 is warranted? ‘Tis dependent on buyside enthusiasm: through the 57 trading days year-to-date, Gold’s average daily COMEX contract volume is 208,633; yet for these past five days, the average is +15% higher at 240,638. We can therefore say that “Gold is in play”: however, Friday’s down day (high-to-low from 2188-to-2158) sported Gold’s largest one-day contract volume this year at 391,750, such “mo-mo suggesting more low” should dip buyers wait out more downside show. ‘Course, broadly on balance, Gold continues to look good to go with eventually higher levels to bestow.
Meanwhile, bestowed upon a needy, stagflative Economic Barometer this past week was improved data for housing. The National Association of Home Builders Index gained ground in March as did February’s readings for Housing Starts, Building Permits, and Existing Home Sales. In an otherwise light week for incoming data, the only “negative” metric was a slowing in March’s Philly Fed Index: but its result (3.2) was positive for just the fourth time in the past 22 months: ![]() “Fly, Eagles Fly”
“Fly, Eagles Fly”![]() [Borrelli/Courtland, ’55]. Here’s the Baro:
[Borrelli/Courtland, ’55]. Here’s the Baro:
To close, we’ve these few quick quips.
This past Tuesday we awoke to read that Kazuo Ueda and his mates at Nippon Ginkō — for the first time in 17 years — put positive the bank’s overnight lending rate in raising it from -0.1% to a sought range of 0.0% to 0.1%. Still, it all seems rather wee, but as goes the saying: “Saké to me, Saké to me, Saké to me…”
This past Thursday with Swiss precision at 09:00 CET, Tommy Jordan and his lads at Schweizerische Nationalbank cut — without scheduled notice — both their key lending and deposit rates to 1.50%. This in turn elicited the Swiss Franc’s largest single session high-to-low drop (-1.69%) versus the Dollar in better than a year. Or how would Emmental Robin put: “Holy cheese, Batman!”
And from the “You Can’t Make This BS Up Dept.”, hardly complete would be the week without having learned from “ABC News!” that according to The World Happiness Report, the Good Old USA no longer ranks amongst the Top 20 Happiest Countries. Aw shucks. But when your nation averages some 45 murders per day (per the Kaman Law Firm), ’tis hard to be happy. Indeed, that’s America, babe: “Death and Taxes!”
Rather, seek that which is more life-and-monetary sustaining:

And Gold in any denomination is still Gold!
Cheers!
…m…
www.TheGoldUpdate.com
www.deMeadville.com
and now on “X”: @deMeadvillePro
22 March 2024 – 09:25 Central Euro Time
The EuroCurrencies and Metals Triumvirate are all at present below their respective Neutral Zones for today; the balance of the BEGOS Markets are within same, and volatility is firmly moderate. Whilst by Market Ranges most of the EDTRs are on the rise, ’tis not the case for either the Bond nor Oil, (nor to a minor extent, the Euro). Yesterday’s high-to-low plunge in the Swiss Franc of -1.69% was the largest across the day’s range in better than a year (since 15 March ’23) on the heels of the Schweizerische Nationalbank unscheduled reduction of its key interest rate. Looking at Market Rhythms for consistency, our 10-test swing leader is the Spoo’s daily Parabolics, (see too the Yen’s 15mn Moneyflow study); on the 24-test basis ’tis the Swiss Franc’s daily Parabolics. The Econ Baro’s week is complete.
21 March 2024 – 09:07 Central Euro Time
The Swiss Franc, Copper, Spoo and Gold are all at present above today’s Neutral Zones: the yellow metal recorded a new high overnight at 2225; BEGOS Markets volatility is moderate-to-robust, Gold notably having traced 135% of its EDTR (see Market Ranges); and by Market Values (in real-time) price (currently 2209) is +119 points above its smooth valuation line. Per the Fed’s math, even as inflation is increasing, they calculate it as decreasing; more on that in the next Saturday edition of The Gold Update. The Econ Baro wraps its week today, income metrics including Q4’s Current Account Deficit, March’s Philly Fed Index, plus February’s Existing Home Sales and Leading (i.e. “lagging”) Indicators.
20 March 2024 – 09:11 Central Euro Time
Spring starts similarly to Winter’s final day, with (save for the Bond) all the BEGOS Markets at present in the red ahead of the Fed; volatility is mostly light (Copper having already traced 63% of its EDTR — see Market Ranges). ‘Twill be interesting to note (perhaps during Chair Powell’s post-FOMC Policy Statement presser) if a FinMedia member brings up the notion of a rate hike, (all as luridly updated in the current edition of The Gold Update). As for the S&P 500, the “live” (futs-adj’d) P/E is 45.8x and the yield 1.380%; that for the 3-month T-Bill is 5.238% annualized. Nothing is due today for the Econ Baro.
19 March 2024 – 09:36 Central Euro Time
All eight BEGOS Markets are at present in the red; session volatility is mostly moderate; of note, the Yen (not as yet a BEGOS component) has traced 168% of its EDTR (see Market Ranges for those of the BEGOS Markets), as the BOJ ends its era of negative interest rates. Looking at Market Rhythms, our leader for consistency on a pure swing 10-test basis is Gold’s 30mn Price Oscillator, whilst on a 24-test basis ’tis the Swiss Franc’s 6hr Parabolics; indeed by Market Trends, the Swiss Franc is the only component now sporting a negative linreg: were there a “hawkish hint” in the FOMC’s Policy Statement (tomorrow) ‘twould likely add to Dollar strength. The Econ Baro awaits February’s Housing Starts/Permits.
18 March 2024 – 09:07 Central Euro Time
Both Oil and the Spoo are at present above their respective Neutral Zones for today; the balance of the BEGOS Markets are within same, and volatility is light. The Gold Update continues (at the very least) to muse over the notion of the Fed at some point actually having to raise rates: therein, our updated inflation table tells the story. The yellow metal itself as “expected” is coming off the recent All-Time High of 2203 (currently 2155) given the excessive distance of price above its smooth valuation line, that live reading now +79 points (see Market Values). ‘Tis a light week of data for the Econ Baro, beginning today with March’s NAHB Housing Index.
The Gold Update: No. 748 – (16 March 2024) – “Gold’s Expected Detinue; Fed HIKE Must Ensue?”

Towards the wrap, here’s The Gold Stack:
The Gold Stack
Gold’s Value per Dollar Debasement, (from our opening “Scoreboard”): 3717
Gold’s All-Time Intra-Day High: 2203 (08 March 2024)
2024’s High: 2203 (08 March)
10-Session directional range: up to 2203 (from 2088) = +115 points or +5.5%
Gold’s All-Time Closing High: 2189 (11 March 2024)
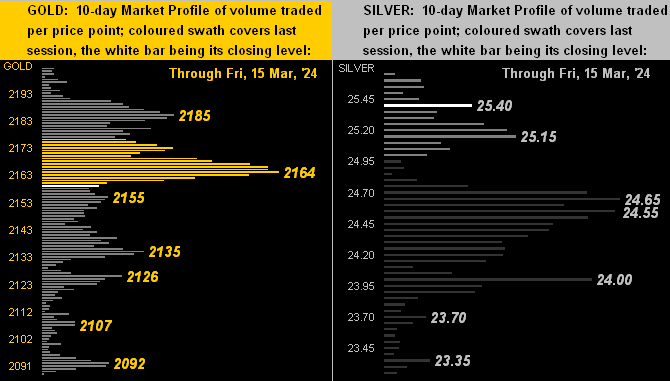
Trading Resistance: 2185 / 2164
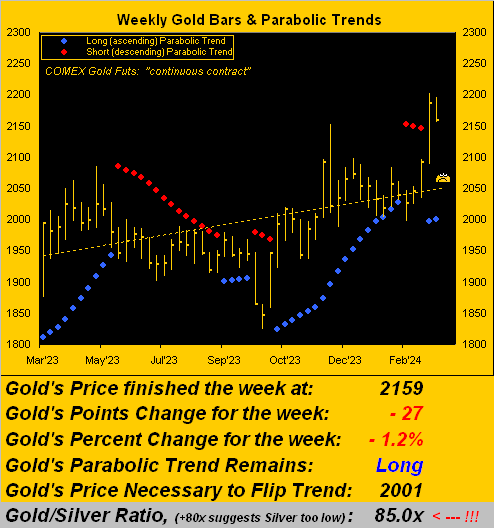
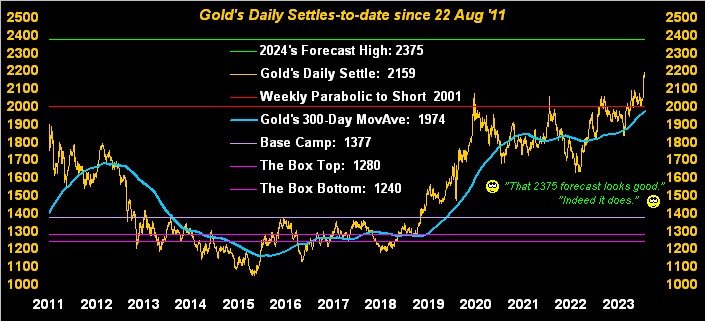
Gold Currently: 2159, (expected daily trading range [“EDTR”]: 26 points)
10-Session “volume-weighted” average price magnet: 2157
Trading Support: 2155 / 2135 / 2126 / 2107 / 2092
The 2000’s Triple-Top: 2089 (07 Aug ’20); 2079 (08 Mar ’22); 2085 (04 May ’23)
The Weekly Parabolic Price to flip Short: 2001
2024’s Low: 1996 (14 February)
The 300-Day Moving Average: 1974 and rising
The Gateway to 2000: 1900+
The Final Frontier: 1800-1900
The Northern Front: 1800-1750
On Maneuvers: 1750-1579
The Floor: 1579-1466
Le Sous-sol: Sub-1466
The Support Shelf: 1454-1434
Base Camp: 1377
The 1360s Double-Top: 1369 in Apr ’18 preceded by 1362 in Sep ’17
Neverland: The Whiny 1290s
The Box: 1280-1240
‘Tis a fairly quiet week ahead for incoming Econ Baro metrics: just seven are scheduled, four of which relate to Housing. Still as cited, The Main Event is Wednesday’s FOMC “maintain the target range” decision. But in and amongst the Statement, Powell Presser and FedSpeak, might the phrase “rate increase” slip out … just as a little future possibility? Quel drame, mes amis…
Either way, with Gold paused per its detinue, consider adding more to your metals’ milieu!
Cheers!
…m…
www.TheGoldUpdate.com
www.deMeadville.com
and now on “X”: @deMeadvillePro
15 March 2024 – 09:18 Central Euro Time
The Swiss Franc at present is below today’s Neutral Zone; above same are the three elements of the Metals Triumvirate; BEGOS Markets volatility is moderate, Copper indeed having already traced 128% of its EDTR (see Market Ranges). Cac volume for the EuroCurrencies is rolling from March into that for June, whilst too for Oil is the volume from April into May. At Market Trends, breaking the case of all eight components having been in positive linregs is the Swiss Franc as the Dollar gets the bid over recent days: might the Fed have to raise? More on that in tomorrow’s Gold Update. The Econ Baro looks to complete the week with March’s NY State Empire Index and UofM Sentiment, plus February’s Ex/Im Prices and IndProd/CapUtil.
14 March 2024 – 09:32 Central Euro Time
Both Gold and Copper are at present below today’s Neutral Zones; above same is Oil, and BEGOS Markets volatility is pushing toward moderate, Copper having already traced 105% of today’s EDTR. Gold (2173) has dominant Profile trading support at 2165, and again by Market Values, Gold (in real-time) is +107 points above its smooth valuation line: (the Spoo at present is +171 points above same). ‘Tis a busy day for the Econ Baro, incoming metrics including February’s PPI and Retail Sales, plus January’s Wholesale Inventories.
13 March 2024 – 09:16 Central Euro Time
Copper is the sole BEGOS Market at present outside (above) its Neutral Zone for today; session volatility is light. At Market Trends, all eight components are in positive linreg, and six of the eight (save for Copper and Oil) have their “Baby Blues” of trend consistency in ascent. At Market Values (in real-time), the Bond, Euro and Oil are all essentially on their smooth valuation lines; Gold is +101 points “high” and the Spoo +180 points “high”. Nothing is due today for the Econ Baro, ahead of 12 incoming metrics over the next two days.
12 March 2024 – 09:13 Central Euro Time
Gold is at present below today’s Neutral Zone whilst the Spoo is above same; BEGOS Markets volatility is light, (albeit the Yen [not a BEGOS component] has traced 107% of its EDTR [see Market Ranges for those of the BEGOS Markets]). Recall from the current Gold Update that the yellow metal is very high above its smooth valuation line (per Market Values), in real-time now +121 points: historically as therein cited, some natural price pullback is to be expected. Otherwise, the five primary Markets are again in positive correlation with one another. For the Econ Baro today we’ve February’s CPI and Treasury Budget.
11 March 2024 – 09:21 Central Euro Time
The Bond and Swiss Franc are at present above today’s Neutral Zones; below same is the Spoo, and BEGOS Markets volatility is mostly light. Cac volume for the Spoo is moving from March into June, with 63 points of additional premium in the latter. The Gold Update cites the fresh spate of marginal All-Time Highs, (to as high as 2203); too, the Update describes a current S&P condition which only has occurred twice in the past 25 years, both prior cases leading to “corrections” of 16% to 18%. Our leading Market Rhythm at present on a 10-test swing basis is the Bond’s daily Parabolics, whilst on a 24-test swing basis ’tis the Swiss Franc’s daily Parabolics. The Econ Baro is quiet today ahead of 15 metrics due as the week unfolds.
The Gold Update: No. 747 – (09 March 2024) – “Gold Flies to Fresh All-Time Highs”

“But the S&P 500 keeps sailing right along, eh mmb?“
So ‘twould appear, Squire, albeit the mighty Index did just (barely) record a down week (-0.3%), only its third such demise of not just the past the ten weeks year-to-date, but indeed since that ending 23 October … which for those of you scoring at home means the Casino 500 has spun 16 up weeks of the last 19. How rare are such streaks? On a mutually-exclusive basis, before this run, it had only occurred on two other occasions across the past 25 calendar years (during 2018 and 2011, prior to which was during 1989). And following the 2018 stint, the S&P then “corrected” as much as -18.3% within three months, whilst after the 2011 stint, the Index similarly dumped -16.9%. Also, this Casino 500 is now characterized as 35 consecutive trading days “textbook overbought”. So ![]() “Get Ready”
“Get Ready”![]() –[The Temptations, ’66].
–[The Temptations, ’66].
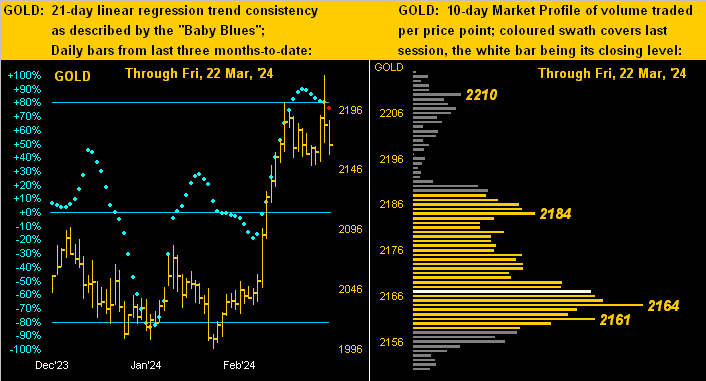
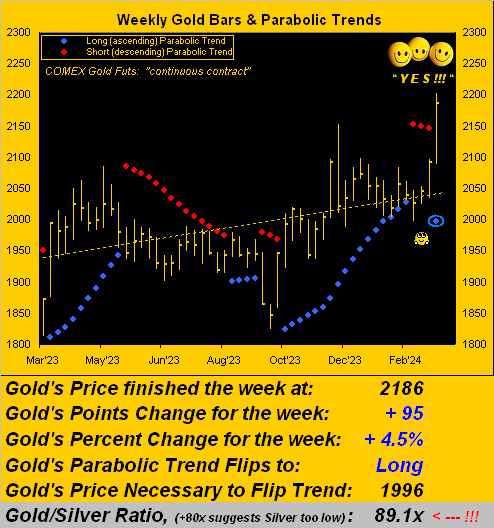
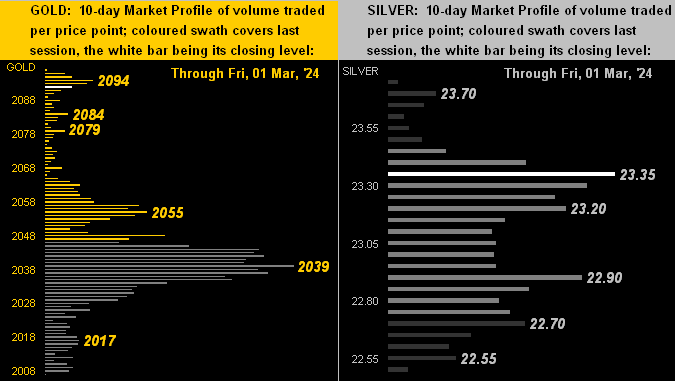
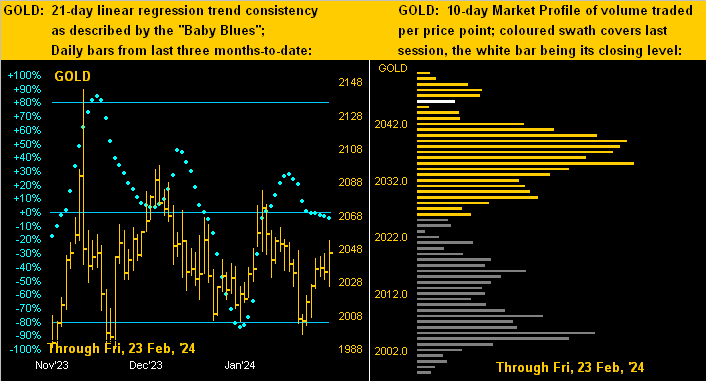
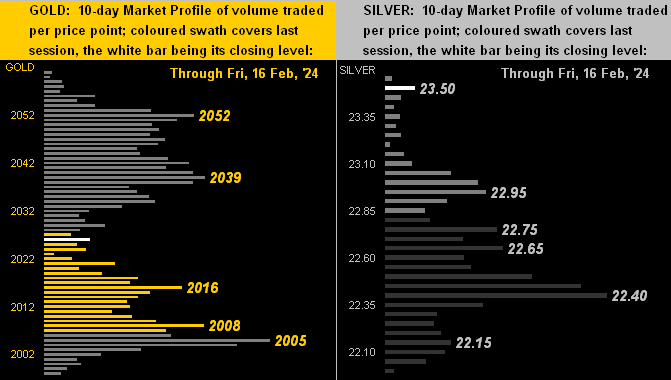
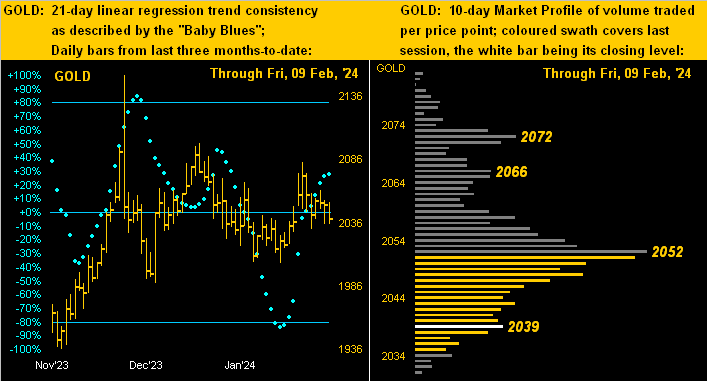
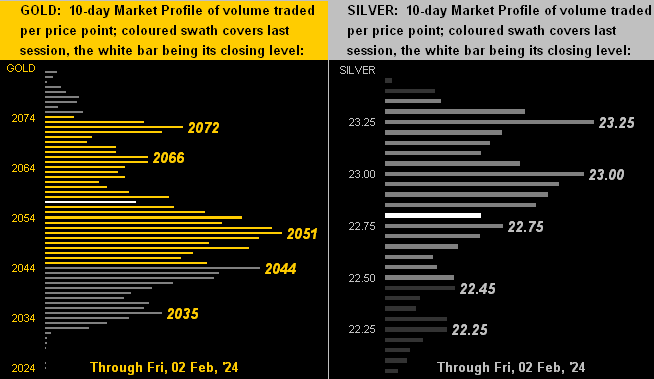
Tempting, too, is the track of Gold, certainly so since mid-February from the rightmost dominant low (1996) in the following left-hand panel of price’s daily bars from three months ago-to-date. In the right-hand panel we’ve Gold’s 10-day Market Profile with its bevy of volume-dominant support levels as labeled:
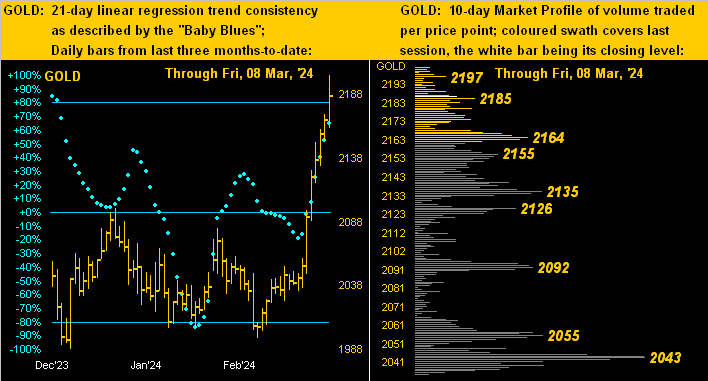
To finish, with 15 metrics due next week for the Econ Baro including the Bureau of Labor Statistics’ reads on the pace of February inflation at both the retail and wholesale levels, we can’t resist going with this closing graphic as — after all — ’tis The Gold Update No. 747:

What fuels your financial jet? We trust ’tis Gold!
Cheers!
…m…
www.TheGoldUpdate.com
www.deMeadville.com
and now on “X”: @deMeadvillePro
08 March 2024 – 09:18 Central Euro Time
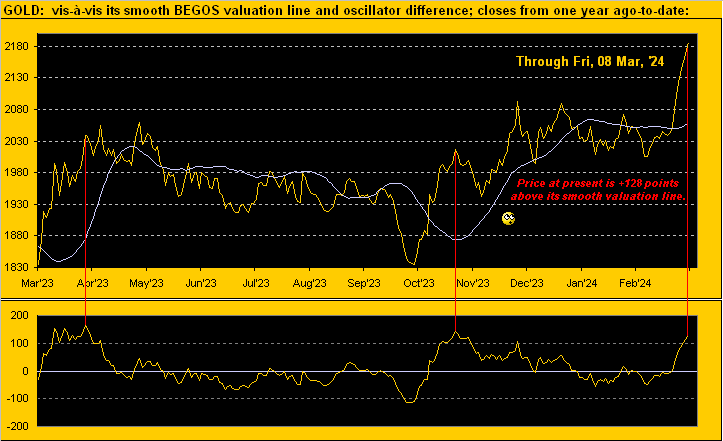
The Euro is at present below its Neutral Zone for today; above same is Silver, and BEGOS Markets volatility is light with February’s Payrolls data in the Econ Baro’s balance. Going ’round the Market Values page (in real-time): the Bond is essentially on its smooth valuation line as is the Euro, Gold is +113 points “high”, Oil is +3.2 points “high”, and the Spoo +211 points “high”. The “live” P/E of the S&P (futs-adj’d) is 47.4x and the yield 1.381%; annualized three-month risk-free dough yields 5.228%. Gold continues to make marginal All-Time Highs, the latest being 2172; more of course on that in tomorrow’s Gold Update.
07 March 2024 – 09:12 Central Euro Time
Gold is ticking over marginal highs: presently 2164, the fresh All-Time High is now 2169. The yellow metal along with Copper are both at present above today’s Neutral Zones; below same is the Spoo, and BEGOS Markets volatility is mostly light, save for Gold having traced 70% of its EDTR (see Market Ranges) to this point. All five primary components (Bond/Euro/Gold/Oil/S&P) through last evening are in positive correlation with one another. The Econ Baro looks to metrics including January’s Trade Deficit and Consumer Credit, along with revisions to Q4’s Productivity and Unit Labor Costs. FedChair Powell completes his Humphrey-Hawkins Testimony today before the Senate Banking Committee.
06 March 2024 – 09:18 Central Euro Time
Gold has yet to crack its 04 December All-Time High (2153), albeit ’tis knocking on the door; again this is in the context of price trading up this year toward our forecast high of 2375, so the next incremental high is not that big a deal. At present, we’ve Copper above its Neutral Zone for today; the rest of the BEGOS Markets are within same, and volatility is mostly light. A final quick peek at Q4 Earnings Season in looking beyond just the S&P 500: of the 1,859 total companies reporting, just 52% improved their bottom lines over the prior year’s like quarter. For the Econ Baro today we’ve February’s ADP Employment Data, plus January’s Wholesale Inventories. Too, FedChair Powell commences his two-day Humphrey-Hawkins Testimony beginning with the House Financial Services Committee. Then late in the session we get the Fed’s Tan Tome.
05 March 2024 – 09:14 Central Euro Time
Gold settled yesterday at an All-Time Closing High (2123); ‘course, the All-Time High itself remains 2152. At present, the Bond is above today’s Neutral Zone; the balance of the BEGOS Markets are within same, and volatility is again light-to-moderate. For Gold, our best Market Rhythm on a pure swing basis (10-test) is its 8hr Moneyflow; on a profit-take basis, ’tis Gold’s daily Parabolics, (see Market Rhythms). Silver (24.14) remains exceptionally cheap relative to Gold, the Gold/Silver ratio 88.1x vs. the century-to-date average of 68.1x. The Econ Baro looks to February’s ISM(Svc) Index plus January’s Factory Orders.
04 March 2024 – 09:15 Central Euro Time
The Euro, Swiss Franc and Copper are all at present above today’s Neutral Zones; the other BEGOS Markets are within same, and volatility is light-to-moderate. The Gold Update cites the early machinations of stagflation as Econ Baro data suddenly weakens, yet inflation data moves up and away from the Fed’s +2.0% target. Whilst we received a positive Swiss Franc signal last week as the “Baby Blues” (see Market Trends) moved above their -80% axis, of note the daily Parabolics have just flipped to Short, one of the top current Market Rhythms; so perhaps price works lower, then higher, (barring the Baby Blues reverting southerly). The Econ Baro awaits 13 incoming metrics for the week (none today), of which just 5 “by consensus” are expected to have improved period-over-period. Finally, Q4 Earnings Season has concluded with 4 of 10 S&P 500 constituents not having improved their year-over-year bottom lines: and yet the S&P sits at an all-time high (5137), the “live” P/E at 46.8x.
The Gold Update: No. 746 – (02 March 2024) – “Gold Grabs Center-Stage as Stagflation Starts to Rage”

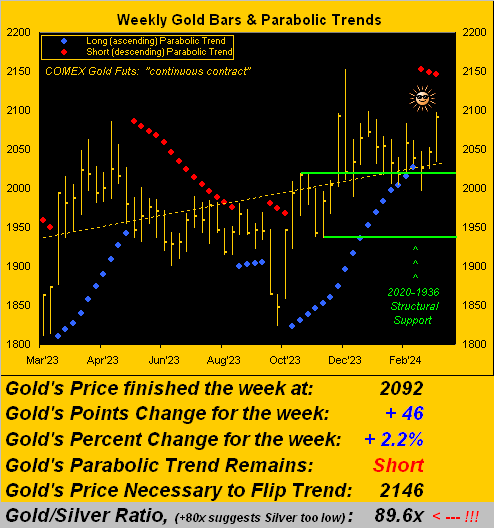
A bold title to head this recital, Gold on Friday posting its best low-to-high intraday gain (+2.4% or +50 points) since 13 December toward settling the week at 2092, essentially tying its highest-ever weekly closing price (with that recorded this past 01 December). To maintain perspective, Gold’s All-Time High remains 2152 (per last 04 December).
Credit Gold’s Friday flight with our Economic Barometer consumed by blight. Straightaway as the incoming metrics low-lighted economic decay, no sooner had we posted the Econ Baro just after the 16:00 (CET) barrage of negative data that Gold got the bid, the FinMedia in full throat for the Federal Reserve to cut rates. But as to inflation: ’tis going the wrong way!
So as succinctly set out in his 2008 tome “When Markets Collide”, one Mohamed El-Erian writes of stagflation as “a situation characterized by disappointingly low economic growth and high inflation.” Is such situation suddenly starting? From our bold title, let’s get straight to two bold graphics: first the economy and second inflation.
1) The Economic Barometer: just as ’twas all going great for the StateSide economy, the FinMedia consistently reminding us of the successes in having embraced Bidenomics, what just happened? In turning below to the Econ Baro from one year-ago-to-date, that rightmost vertical drop is its second-worst six trading-day plunge since this time a year ago. Should such reversal of fortune continue to work its way into the data for computing Gross Domestic Product, that’ll be El-Erian’s “disappointingly low economic growth” … ![]() “Whoomp! There it is!””
“Whoomp! There it is!””![]()
As for 2024’s brief stint year-to-date, despite Gold’s Friday upstate, price so far hasn’t done that great. For in turning to the BEGOS Markets Standings to this point of the year, Gold is up but a wee +1.0%, (even as the Dollar Index is +2.8%, but as you know, Gold plays no currency favourites). Topping the podium at present is Oil, +11.9% followed by the “Casino 500” +7.7%. Indeed specific to the S&P, through the first 42 trading days of this year, that +7.7% gain ranks second only to 2019’s stint (+11.4%) across the same number of days. But there’s a glaring difference between ![]() “Now and Then””
“Now and Then””![]() –[The BeaTles, ’23]. Then the “live” price earnings ratio of the S&P 500 was 30.6x (yield 2.054%). Now ’tis 46.5x (yield 1.400%.). Three-month risk-free dough then? 2.375%. And now? 5.215%. Yet you’re still in the stock market? Sheer guts. Regardless, as the fuse burns off, let’s get to the Standings before the whole thing blows up:
–[The BeaTles, ’23]. Then the “live” price earnings ratio of the S&P 500 was 30.6x (yield 2.054%). Now ’tis 46.5x (yield 1.400%.). Three-month risk-free dough then? 2.375%. And now? 5.215%. Yet you’re still in the stock market? Sheer guts. Regardless, as the fuse burns off, let’s get to the Standings before the whole thing blows up:
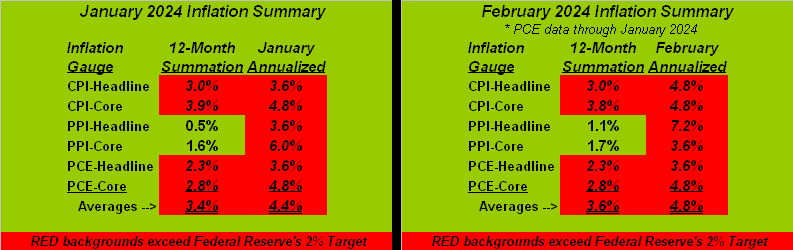
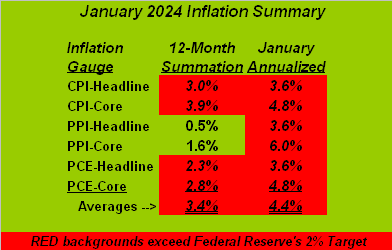
To sum it all up for this week, we’ve emphasized the Fed having to face what appears as the early machinations of a stagflating economy, a “damned if they do, damned if they don’t” scenario. Despite all the FinMedia blather about inflation being tamed — given we instead do the math — ’tisn’t. Our puke-green table with the red 2.0% overages ought be on every news desk in the nation and ’round the world. (But as is sadly typical, the truth wrecks the narrative). And as for the suddenly slipping economy, 13 metrics hit the Econ Baro next week, of which just five “by consensus” are supposed to show period-over-period improvement.
Thus as the cost to survive goes on the rise whilst that upon which you rely slips by, ’tis probably a good idea to have a little Gold! Or a lot of Gold!

Cheers!
…m…
www.TheGoldUpdate.com
www.deMeadville.com
and now on “X”: @deMeadvillePro
01 March 2024 – 09:20 Central Euro Time
The Swiss Franc and Copper are both at present below today’s Neutral Zones; above same is the Spoo, and volatility is light-to-moderate. We’re a bit surprised with equities’ upside move yesterday on the heels of a firm Core PCE Report for January at an annualized pace of +4.8%, well beyond double that sought by the Fed; (more on that in tomorrow’s 746th edition of The Gold Update); still, the Dollar Index hasn’t backed off a wit, sensing that current rate levels shan’t decline any time soon. The Econ Baro rounds out its week with February’s ISM(Mfg) Index and revision to UofM Sentiment, plus January’s Construction Spending.
29 February 2024 – 09:17 Central Euro Time
We’ve reached “PCE” Day” and all eight BEGOS Markets are at present within their respective Neutral Zones for today; volatility is light; for the record, the non-BEGOS Market Yen has already traced 140% of its EDTR (see Market Ranges for the BEGOS components); there are musings that Japan may move toward an interest rate increase. The Spoo which has stalled in recent days is nonetheless by Market Values +124 points (in real-time) above its smooth valuation line. Along with January’s “Fed-favoured” Core PCE reading (which by consensus is expected to be double December’s pace), other incoming metrics for the Econ Baro today include the month’s Personal Income/Spending, Pending Home Sales, and February’s Chi PMI.
28 February 2024 – 09:17 Central Euro Time
Red is the watchword for the BEGOS Markets, all the components to the South, save for the Bond, the cac volume for which is rolling from March into that for June; session volatility is again light. The markets have taken on a “wait and hold” approach ahead of tomorrow’s release of January’s Fed-favoured PCE data. At Market Trends, the Swiss Franc’s “Baby Blues” of trend consistency yesterday confirmed crossing above their key -80% axis, indicative of high price levels near-term. And today for the Econ Baro we’ve the first revision to Q4 GDP.
27 February 2024 – 09:49 Central Euro Time
The components of the Metals Triumvirate are all above their Neutral Zones; none of the other BEGOS Markets are below same, and volatility continues as light to this time of day. On a 10-test swing basis, our most consistent Market Rhythm is the Bond’s daily Parabolics; on a 24-test swing basis ’tis the Spoo’s 1hr Moneyflow. By Market Trends, only Oil and the Spoo are in positive linreg, albeit the Euro appears near to rotating from negative to positive. For the Econ Baro today we’ve February’s Consumer Confidence and January’s Durable Orders.
26 February 2024 – 10:05 Central Euro Time
Both Silver and Copper are at present below today’s Neutral Zones; the balance of the BEGOS Markets are within same, and volatility is again light. The “flu-abbreviated” Gold Update reminds us of the yellow metal having only just started a fresh weekly parabolic Short trend, despite price’s resiliency to this point; noted therein is traders’ new awareness of the Fed potentially having to raise rather than cut rates, something upon which we’ve occasionally mused since the start of the year; (PCE data is due Thursday). This is the final week of Q4 Earnings Season. And the Econ Baro begins a fairly busy week with January’s New Home Sales.

23 February 2024 – 09:31 Central Euro Time
At present, all eight BEGOS Markts are inside of today’s Neutral Zones, and volatility is light. Copper’s cac volume is moving from March into that for May, and we ought see same for Silver as the new week unfolds. The “live” P/E of the S&P is now 49.0x, exemplary of the comparatively weak Q4 Earnings Season, which itself has one more week to run even as the Index continues to ascend. Our top Market Rhythm for swing consistency (10-test basis) is the Euro’s 30mn Parabolics; more broadly (24-test basis) ’tis Silver’s 30mn Parabolics. Hardly robust is Gold (2030) as it tries to defy the 2020-1936 structural support zone: more on it all in tomorrow’s 745th edition of The Gold Update.
22 February 2024 – 09:29 Central Euro Time
The EuroCurrencies, Metals Triumvirate, and Spoo are all at present above their respective Neutral Zones for today; BEGOS Markets volatility is moderate-to-robust, the Euro having notably traced 116% of its EDTR (see Market Ranges). The “live” P/E of the S&P is 46.9x and the yield 1.439% versus an annualized 5.235% on three-month risk-free dough; the Index is now 23 consecutive trading days as “textbook overbought”; as to the Spoo, ’tis +160 points above its smooth valuation line (see Market Values). The Econ Baro concludes its very quiet week with January’s Existing Home Sales.
21 February 2024 – 09:28 Central Euro Time
Silver and Copper are at present above today’s Neutral ones; the Spoo is below same, and volatility is mostly light. By Market Trends: Silver, Oil and the Spoo are sporting positive linregs; those for the Bond, Euro, Swiss Franc, Gold and Copper are negative. Some seven weeks ago we speculated on the Fed potentially having to raise rather than cut rates: the FinMedia and now just starting to pick up that notion, (more on that in next Saturday’s edition of The Gold Update). Nothing is due for the Econ Baro today; however, the FOMC’s Minutes from the 30/31 January meeting are to be released.
20 February 2024 – 11:13 Central Euro Time
The BEGOS Market’s two-day session continues with both the Euro and Gold at present above their respective Neutral Zones for today, whilst below same are Silver and The Spoo; volatility is moderate. Leading our Market Rhythms for swing consistency (10-test basis) are the Bond’s daily Parabolics and Copper’s 1hr Parabolics, whilst on a 24-test basis we’ve Copper’s 30mn Parabolics and same study for Silver. For Oil (currently 77.71), we’ve Market Profile support at 77.60; for the Spoo (currently 4998) Market Profile resistance shows at 5015. January’s Leading (i.e. lagging) Indicators come due for the Econ Baro.
19 February 2024 – 09:15 Central Euro Time
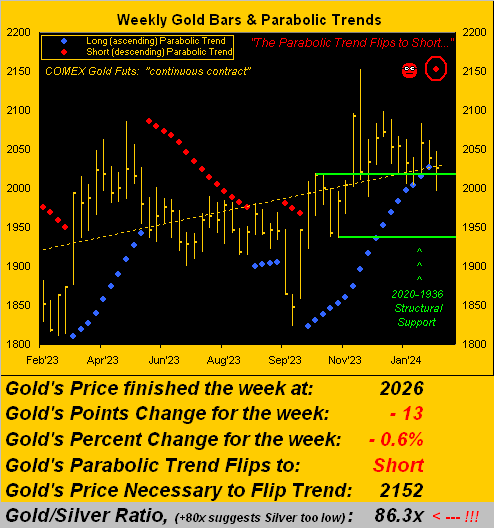
‘Tis the first of a two-day session for the BEGOS Markets (given today’s StateSide holiday). At present, both the Bond and Silver are below today’s Neutral Zones, whilst above same are Gold and the Spoo; volatility is light-to-moderate, Silver having already traced 76% of its EDTR (see Market Ranges). The Gold Update re-muses over the notion of the Fed perhaps having to raise (rather than stand pat or cut) rates; and with Gold’s weekly parabolic trend having flipped from Long to Short, we anticipate the 2020-1936 support zone seeing further testing. Following a very busy week of 19 incoming metrics for the Econ Baro, just three are on the slate this time ’round. Q4 Earnings Season has two weeks yet to run: specific to the S&P 500, of the 364 constituents having thus far reported, 62% (276) having improved their bottom lines over Q4 of a year ago.
The Gold Update: No. 744 – (17 February 2024) – “More Gold Slippin’ as Inflation Renews Rippin’”
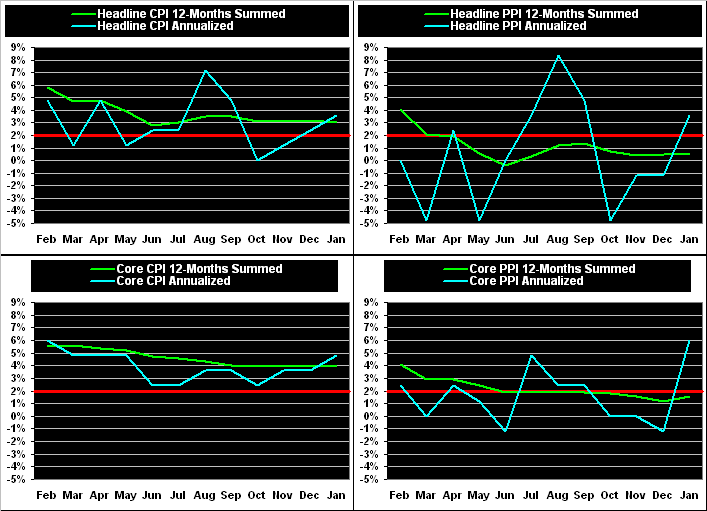
We’ll close with this absurd deception from the rather desperate “It’s All Good!” FinMedia. (Ensure you’re not sipping your favourite beverage, lest it spew from your nose given uncontrollable laughter). Following Tuesday’s release of renewed retail inflation per the CPI, floundering CNN Business ran with this headline, (put your glass down…): “Good News for Americans: Inflation cooled back down in January”. Again, the CPI’s pace increased from +0.2% in December to +0.3%, and its core reading from +0.3% to 0.4%. Cool, baby.

Cheers! (And don’t forget the Gold!)
…m…
www.TheGoldUpdate.com
www.deMeadville.com
and now on “X”: @deMeadvillePro
16 February 2024 – 09:12 Central Euro Time
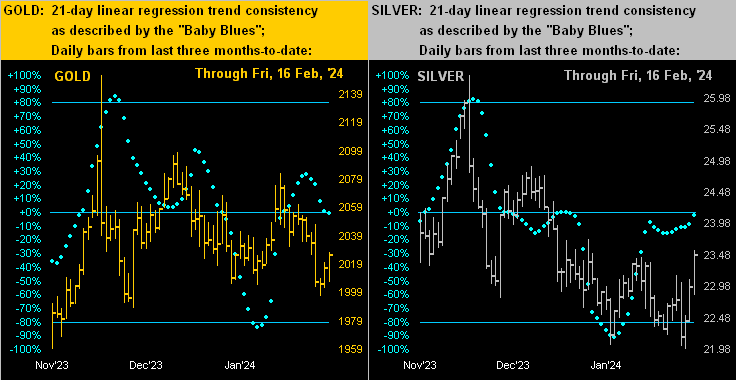
The Bond and Swiss Franc are at present below their respective Neutral Zones for today; above same is Copper, and volatility is mostly light, (the red metal the sole component having already traded in excess of 50% [54%] of its EDTR [see Market Ranges]). At Market Trends, save for Oil and the Spoo, the other six BEGOS Markets are in linreg downtrends. And in going ’round the horn in real-time for the five primary components’ Market Values: the Bond is better than -4 points “low” per its smooth valuation line, the Euro -0.023 points “low”, Gold -36 points “low”, Oil nearly +4 points “high”, and the Spoo +185 points “high”. The Econ Baro concludes its very busy week with February’s UofM Sentiment Survey, plus January’s PPI and Housing Starts/Permits.
15 February 2024 – 09:13 Central Euro Time
We’ve at present both the Bond and Swiss Franc above today’s Neutral Zones; the balance of the BEGOS Markets are within same, and volatility is light. Looking at Market Rhythms, on a 24-test wing basis for consistency, Copper’s 30mn Parabolics ranks 1st. By Market Trends, Copper’s “Baby Blues” are in decline, as are those for all the other components, save for the Spoo, the Market Value for which (in real-time) is +170 points above its smooth valuation line. The “live” P/E of the S&P (fut’s adj’d) is 49.7x. ‘Tis a massive set of incoming metrics (11) for the Econ Baro today: included therein are February’s NY State Empire Index, Philly Fed Index and NAHB Index, plus January’s Retail Sales, Ex/Im Prices and IndProd/CapUtil, plus December’s Business Inventories.
14 February 2024 – 09:19 Central Euro Time
Silver of late seems to oft be the BEGOS Markets’ sole overnight outlier: ’tis at present below its Neutral Zone for today, whilst all the other components are within same; volatility is quite light with Copper sporting the widest EDTR tracing (see Market Ranges) of just 38% to this point. As perhaps provocatively put at times year-to-date in The Gold Update: what if the Fed had to again raise rates to battle increasing inflation? (January’s “Fed-favoured” Core PCE pace is not due until 29 February). With better than two weeks still to run in Q4 Earnings Season, it remains that 4 in 10 S&P 500 constituents have not improved their year-over-year bottom lines. At Market Values, despite the -1.4% drop yesterday in the S&P, the Spoo (in real-time) is still 133 points above its smooth valuation line; the Index itself is 18 consecutive trading days “textbook overbought” and the “live” (futs-adj’d) P/E is now 47.8x, essentially double where ’twas when first established a dozen years ago.
13 February 2024 – 09:18 Central Euro Time
At present the Swiss Franc is below today’s Neutral Zone, whilst above same are all three elements of the Metals Triumvirate; volatility is mostly light. As anticipated both in yesterday’s commentary and the current edition of The Gold Update, the yellow metal’s weekly parabolic trend — after having been Long for 17 weeks — has provisionally flipped to Short, confirmation of which shall come at Friday’s settle, (barring a rocket shot above 2152); as noted, this technically opens the door for further testing of the 2020-1936 support structure; strictly on a swing basis for consistency, Gold’s best Market Rhythm is currently the 4hr Moneyflow. We’re notably eying the Core CPI in today’s retail inflation data for the Econ Baro: such Core reading may indicate inflation running at a +3.6% pace.
12 February 2024 – 09:35 Central Euro Time
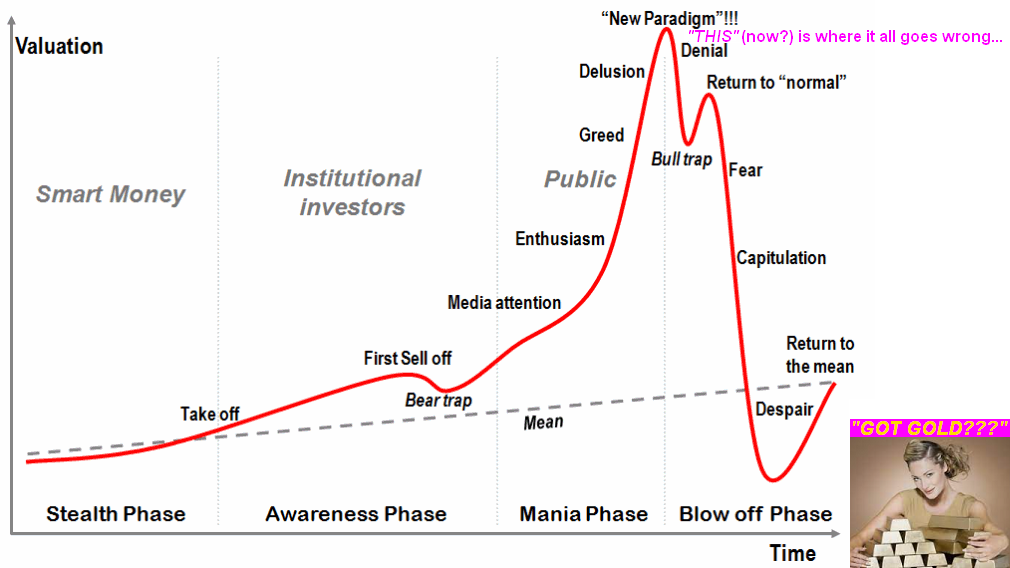
The BEGOS Markets start the week with Silver as the sole component at present outside (above) its Neutral Zone for today; session volatility is mostly light, save for the white metal having already traced 82% of its EDTR (see Market Ranges). The Gold Update notes the narrowness of the yellow metal’s trade of late, with the likelihood the weekly parabolic Long trend shall now flip to Short; emphasis is placed on the S&P 500’s ongoing overvaluation and potential positioning within the stock market’s broad-based “emotional” cycle, suggestive of the Index having reached the inflexion point from where “it all goes wrong.” The Econ Baro’s busy week of 17 incoming metrics begins with January’s Treasury Deficit.
The Gold Update: No. 743 – (10 February 2024) – “This is Where it All Goes Wrong (Got Gold?)”

And so to wrap with a little AI (again that’s “Assembled Inaccuracy”) fun in three parts.
First and obviously not proper use of AI per se, we simply “Googled” the following question: “What is the trading profit for the past 10 swings of the S&P 500 emini futures by parabolics on three-point range candles?” The reply was merely a slew of adverts for commodity trading firms.
Second we went to a proper AI site and identically queried: “What is the trading profit for the past 10 swings of the S&P 500 emini futures by parabolics on three-point range candles?” The amount of verbage returned was practically endless, but finally came the reply: “Therefore, the trading profit for the past 10 swings of the S&P 500 Emini futures by parabolics on three-point range candles is $3175.” Which is comprehensively wrong. The correct answer is $938.
Third we thus thought: let’s try something a little easier. Ready? In we typed “What is the price of gold?” The reply? “As of today, the price of gold is $1,775.45 per troy ounce.” Which again is comprehensively wrong. The correct answer is $2024.40 (spot) or $2038.70 (futures). Oh my, AI.
And AI is purportedly bringing us to Dow 100,000? Talk about “This” being is where it all goes wrong!
We therefore think for now: “Forget about it!”
Rather: Just get some Gold! That’s Actual Intelligence!
“Smart boy…”
Cheers!
…m…
www.TheGoldUpdate.com
www.deMeadville.com
and now on “X”: @deMeadvillePro
09 February 2024 – 09:25 Central Euro Time
All eight BEGOS Markets are at present within their respective Neutral Zones for today; session volatility is very light. The S&P 500 briefly topped the 5000-mark yesterday (at precisely 5000.40) before settling at 4998. Four in ten S&P stocks have thus far not improved their Q4 earnings over those of a year ago. Infamous Dave Einhorn just referred to the markets as “fundamentally broken”; (obviously he reads The Gold Update … more on that in tomorrow’s 743rd edition). Our top Market Rhythms for consistency on a 10-test swing basis are currently the Bond’s daily Parabolics, both the Swiss Franc’s 8hr Moneyflow and daily Parabolics, and the Spoo’s 2hr Price Oscillator. The Econ Baro already has concluded its muted week.
08 February 2024 – 09:16 Central Euro Time
The Spoo is now above 5000 for the first time in its history, (the S&P itself near the threshold). At present we’ve both Silver and Copper above their Neutral Zones for today; the rest of the BEGOS Markets are within same, and volatility is light. Per our S&P Moneyflow page, dough is flowing into the Index at an unbelievable rate given the more-than-extreme overvaluation: the “live” P/E (fut’s adj’d) is now 50.2x. Today’s Econ Baro metrics include December’s Wholesale Inventories.
07 February 2024 – 09:39 Central Euro Time
At present, Gold and Silver are the only BEGOS Market outside (below) today’s Neutral Zone; session volatility again is notably light. Of late we’ve a strong positive correlation between the Bond and Gold: indeed the tracks of their daily bars across the past 21 trading days (one month) are (to the glance) identical. We continue to monitor Gold’s weekly technicals, the Moneyflow for which is inching lower still; again a retest of the 2020-1936 can be in the cards, certainly upon the weekly parabolic Long trend flipping to Short, (the hurdle for which is currently 2015 versus price right now of 2048). The Econ Baro looks to December’s Trade Deficit and (late in the session) Consumer Credit.
06 February 2024 – 09:14 Central Euro Time
The Spoo is the sole BEGOS Market at present outside (above) its Neutral Zone for today; session volatility is notably light, even as nothing is on the schedule for the Econ Baro. Our top three Market Rhythms (on a 10-test swing basis) for consistency are Gold’s 1hr Moneyflow, the Swiss Franc’s 8hr Moneyflow, and the Spoo’s 2hr Price Oscillator. Going ’round the Market Values horn for the five primary components, in real-time we’ve the Bond as -2^22 points “low” vis-à-vis its smooth valuation line, the Euro as -0.022 points “low’, Gold as just -10 points “low”, Oil as basically spot-on its valuation line, and the Spoo as +172 points “high”. At Market Trends, those with positive linregs are Gold, Copper, Oil and the Spoo; thus those negative are the Bond, Euro Swiss Franc and Silver. Through yesterday, only 57% of S&P 500 companies’ Q4 earnings are better than a year ago, with many reports still in the balance over these next couple of weeks.
05 February 2024 – 09:20 Central Euro Time
The Bond and Precious Metals are starting the week to the downside; the balance of the BEGOS Markets are within today’s Neutral Zone, and volatility is pushing toward moderate; Gold already has traced 75% of its EDTR (see Market Ranges). The Gold Update accounts for 19 fresh points of premium in the April contract, but remains wary of some near-term price setback; too, mention is made of Dot-Com-like worries by Big Banks, (an issue upon which we’ve repeated these last several months). The “live” (futs-adj’d) P/E of the S&P 500 is 51.0x: 98 earnings reports are scheduled for the Index this week. The Econ Baro begins a very light data week with January’s ISM(Svc) Index.
The Gold Update: No. 742 – (03 February 2024) – “Gold Gains Ground on Premium Sound”

“You say ‘lousy’, mmb? 75% of S&P companies have beaten estimates…“
Squire revels in playing this earnings game. Truth be told, only 56% of bottom lines have improved over a year ago, thus far making Q4 the sixth-worst S&P 500 Earnings Season of the past 27. Rising yields, a rising Dollar, scant earnings growth, and this Casino 500 sits at an all-time closing high (4959)? Ought we re-classify The Investing Age of Stoopid to that of Braindead?
But wait, there’s more: within several missives dating as far back as last mid-November, we’ve likened what we’ve been seeing in the Casino 500 to that which ultimately fed into the DotComBomb some two decades ago. And — late as they may be in figuring this out — major investment banks are (finally) seeing same. Hat-tip Bloomy for reporting last Tuesday that “JP Morgan Quants Warn of Dot-Com Style Concentration in US Stocks”, and then followed that yesterday with “BofA’s Hartnett Says Stock Markets Are Behaving Like Dot-Com Era”. Are the Big Banks at last actually doing the math?
The “live” price/earnings ratio of the Casino 500 is now 50.5x … and as we’ve previously noted, that is higher than ’twas at the outset of the DotComBomb, which high-to-low from 2000 into 2002 found the S&P “correct” more than -50% … just in case you’re scoring — or better yet preparing — at home. Because in reprising Bachman–Turner Overdrive from back in ’74: ![]() “You Ain’t Seen Nothing Yet”
“You Ain’t Seen Nothing Yet”![]()
‘Course, the “talk of the town” remains the so-called “Magnificent Seven”. Per yesterday’s settle, the combined market capitalization of: both Alphabet tranches, Apple, Amazon, Meta, Microsoft, Nvidia and Tesla represents 29.2% of the entire S&P 500. Their average P/E is now 46.5x (44.8x cap-weighted, were they in their own index of just seven companies). This is beyond lunacy by any historical measure.
Moreover as we’ve all along been wary, the annualized risk-free yield per yesterday’s settle on the three-month U.S. T-bill is 5.210%; that on the risk-all Casino 500 is 1.431%. (Further, as you regular readers well know, the market cap of the S&P is more than twice the readily available money supply to cover it … oops).
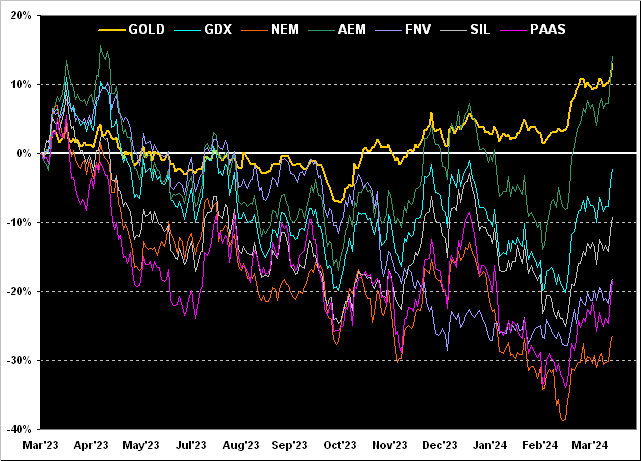
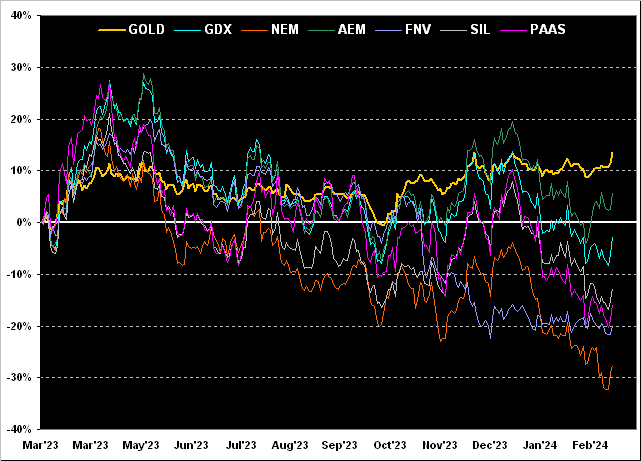
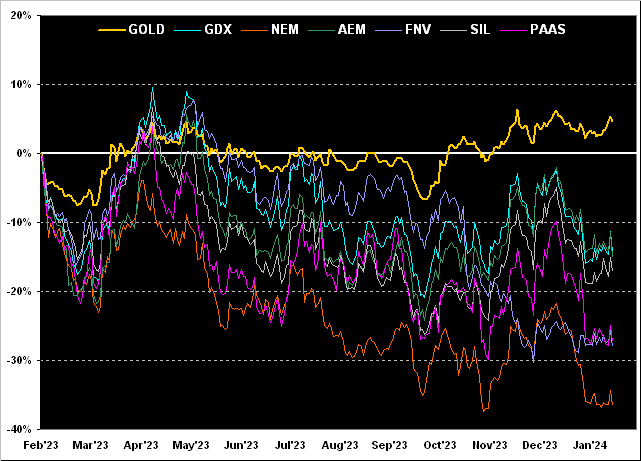
But back to Gold — the true hard asset currency dating at least as far back as Lydia’s King Croesus, circa 550 BC — ’tis time to bring up our year-over-year comparison of the yellow metal vis-à-vis its key equity brethren. So from worst to first we’ve: Newmont (NEM) -37%, Franco-Nevada (FNV) -28%, Pan American Silver (PAAS) -27%, the Global X Silver Miners exchange-traded fund (SIL) -17%, Agnico Eagle Mines (AEM) -15%, the VanEck Vectors Gold Miners exchange-traded fund (GDX) -14%, but Gold itself +5%. Does this mean the price of Gold (2057) is too high? Hardly, given our opening Gold Scoreboard’s valuation (3754). But in this goofball era of “The Magnificent Seven, or Nothing!”, the precious metals remain the wallflowers. It shan’t last; (it never has). Here’s the graphic:
The ensuing week appears underwhelming for the Econ Baro: just five metrics are due. But for Q4 Earnings Season, another 98 reports are scheduled for the S&P 500 as the Index’s insanity continues … or starts to come to its senses. On verra…
‘Course, nothing is more sensible than having a little Gold!
Cheers!
…m…
www.TheGoldUpdate.com
www.deMeadville.com
and now on “X”: @deMeadvillePro