Copper is presently below its Neutral Zone for today; the balance of the BEGOS Markets are within same, and volatility is again light. Per our MoneyFlow page, the S&P 500 has received substantive inflow across all three of our time measures (weekly, monthly. quarterly): the inference thus is bullish for the S&P; however, ’tis so overcooked to this point both fundamentally and technically that some degree of downside hoovering awaits; perhaps ’twill be a “sell the priced-in” Fed announcement tomorrow; as noted yesterday, the Spoo’s daily Parabolics have just flipped to Short. For the Econ Baro today we’ve December’s NAHB Housing Index, November’s Retail Sales and IndProd/CapUtil, plus October’s Business Inventories.
 Mark
Mark
16 December 2024 – 08:37 Central Euro Time
The busy week begins with the Swiss Franc at present the sole BEGOS Market outside (above) its Neutral Zone for today; session volatility is light. The Gold Update graphically depicts last week’s “Spike n’ Sink”, price initially driven up geopolitically and on the CPI, then back down on the PPI and a bit of Fed doubt; highlighted therein is inflation being back on the increase, the Dollar in turn getting the bid throughout last week. As to notions of an S&P 500 “Santa Claus Rally”, across the past 44 years for these seven trading days leading up to Christmas ’tis not occurred in 13 of them (i.e. ’tis not automatic); indeed the Spoo’s daily Parabolics flipped to Short effective today’s open. Cac volume for the Spoo is rolling from December into that for March, and for Oil from January into February. For the Econ Baro there are 19 metrics due this the week, 10 of which arrive prior to Wednesday’s FOMC Policy Statement; today brings December’s NY State Empire Index.
The Gold Update: No. 787 – (14 December 2024) – “Gold Does the Spike n’ Sink”

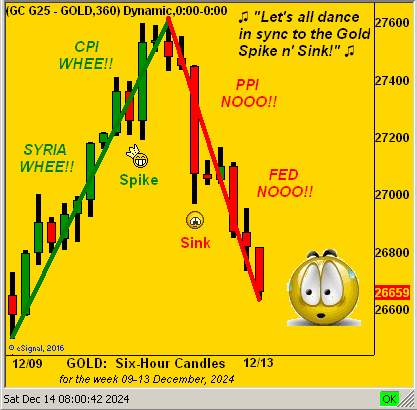
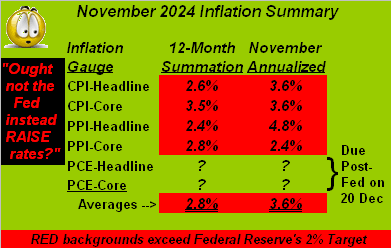
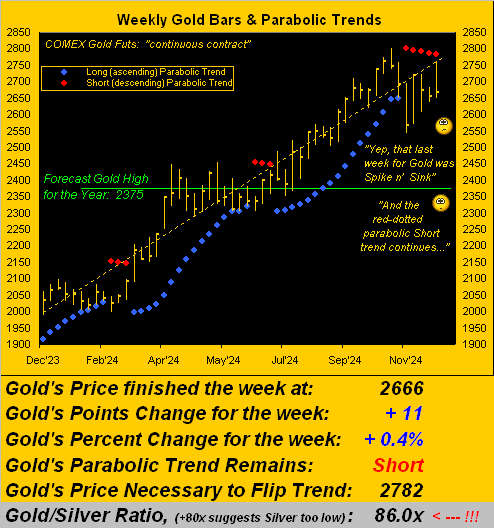
Thus into a very busy “Fed Week” we go during which 19 metrics come due for the Econ Baro, 10 that are scheduled prior to the FOMC’s Policy Statement late Wednesday. Since the FinMedia have assured us the Fed will cut, is that already priced into Gold? But then again, hearsay has it the Bank come 29 January shall “pause” post-Santa Claus; so hold any applause.
And always make sure you’ve some Gold in your claws!
Cheers!
…m…
www.TheGoldUpdate.com
www.deMeadville.com
and now on “X”: @deMeadvillePro
13 December 2024 – 08:24 Central Euro Time
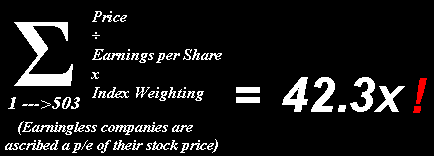
All eight BEGOS Markets are presently within today’s Neutral Zones, and volatility is very light. The Yen’s Long signal herein cited on 03 December is provisionally failing: ’tis based upon the daily Price Oscillator dominating the Market Rhythms for pure swing consistency (on a 24-test basis); such signal would now swing to Short. The S&P 500 yesterday produced a “Hobson Close” in settling on its low level for the session: this last occurred on 26 August 2022, following which the S&P some seven weeks later was down by more than -13%, albeit we don’t give such events predictive shrift, whereas the futs-adj’d “live” P/E for the S&P is an unsustainable 46.4x. ‘Tis rollover for the currencies from the December cacs to those for March. And the Econ Baro wraps its week with November’s Ex/Im Prices.
12 December 2024 – 08:20 Central Euro Time
The Euro, Silver and Copper are at present all above their respective Neutral Zones for today; none of the other BEGOS Markets are below same, and volatility is mostly light. Yesterday’s +0.8% rise in the S&P 500 is “media-credited” to the CPI — whilst yet again above the Fed’s desired pace — having met “expectations” in turn “guaranteeing” a rate cut come the FOMC’s 18 December Policy Statement; (yes, ’tis nonsensical). Looking at current correlations amongst the five primary BEGOS components, the best is negative between the Euro and Oil; notably, Oil yesterday confirmed a close above its Market Magnet, suggestive of still higher prices near-term, perhaps a breakout above the mid-71s top from two weeks ago. Included in today’s incoming Econ Baro metrics we’ve November’s wholesale inflation reads per the PPI.
11 December 2024 – 08:40 Central Euro Time
Both the Euro and Swiss Franc are presently below today’s Neutral Zones; none of the other BEGOS Markets are above same, and volatility is mostly moderate, save for the Spoo, for which the EDTR (see Market Ranges) has been been swiftly narrowing: two weeks ago ’twas 67 points, today ’tis set for 47 points. Looking at Market Rhythms, on a 10-test basis the consistency swing leader is Silver’s 8hr Price Oscillator, followed by the non-BEGOS Yen’s daily Parabolics which flipped to Short effective today’s open, counter to the Yen’s daily Price Oscillator: that study on the 24-test basis is Long. The Econ Baro gets its first dose of November’s inflation data at the retail level via the CPI; too, late in the session comes the month’s Treasury Budget.
10 December 2024 – 08:40 Central Euro Time
Gold is the sole BEGOS Market outside (above) its Neutral Zone for today; session volatility for the BEGOS Markets is quite light. Gold has been getting a bid as the week unfolds, albeit ‘twould “appear” to be geopolitically-driven: as you regular readers know, such impetus for Gold rallies generally sees price return back down from whence it initially came; again, the parabolic weekly trend for Gold remains Short. As to the Spoo, its 12hr MACD confirmed a negative crossover effective today’s open: this has been an excellent Market Rhythm for the the Spoo with the last 10 such crossovers (to Long or Short) all following-through with at least an additional 76 points; thus basis the March cac (which opened today at 6134) a move down to at least 6058 would be reasonable, barring first an all-time high above 6179. The Econ Baro awaits the revisions to Q3’s Productivity and Unit Labor Costs.
09 December 2024 – 08:24 Central Euro Time
At present we’ve the Euro below its Neutral Zone for today, whilst above same is Gold; BEGOS Markets’ volatility is light-to-moderate. The Gold Update cites the narrowing of price’s trading range such that ’tis anticipated the current parabolic Short trend shall carry on for at least another week; provided as well is evidence of the S&P 500’s extreme “textbook overbought” condition, both technically and fundamentally. Amongst Market Rhythms, we’re minding the Spoo’s 12hr MACD as ’tis been a solid signaling performer from August-to-date: its next stance would be from Long-to-Short within a day or two, barring price resuming its upside breakout. Metrics are due every day this week for the Econ Baro, starting today with October’s Wholesale Inventories.
The Gold Update: No. 786 – (07 December 2024) – “Gold Boring; S&P Warning”


“But mmb, you said at the beginning something about a 26% fall in the S&P…”
So here’s the skinny, Squire.
Going away back to the days of AvidTrader (and indeed by this measure since the year 1980), when the S&P 500 gets a bit far afield from itself — either up or down — we quantitatively couch it as mildly, moderately or extremely “textbook overbought” or “textbook oversold”.
Through yesterday’s (Friday’s) S&P 500 settle at 6090, ’twas the eighth consecutive day of being extremely “textbook overbought”. And across the past 45 calendar years, on a mutually-exclusive basis, such eight-day run has only occurred 14 other times. Doesn’t sound like much right?
But wait, there’s more: the last time this current condition came to fruition was in November 2021 from which the S&P’s fall within one year was -26%, (inclusive of recession fears — and the Econ Baro today is significantly lower than ’twas then). The prior occurrence came in 2019 from which the fall within one year was -25%, (inclusive of the 2020 COVID mini-crash).
And yet the inevitable next time ’round, a like percentage drop might actually be considered small. Why? Don’t forget: had COVID never happened, the S&P today would at best be around 3000 and all would be as happy as clams. Instead, today ’tis at 6000 with the honestly-calculated price/earnings ratio now 46.9x, which is double the norm, and triple what was taught as “acceptable” in B-school. For you WestPalmBeachers down there, that means company earnings haven’t increased commensurate with stocks prices. To wit we update this closing graphic of the S&P 500 across the past 50 years with the extrapolated regression channel had COVID never happened. Fortunately however, earnings are no longer meaningful for stocks’ pricing:
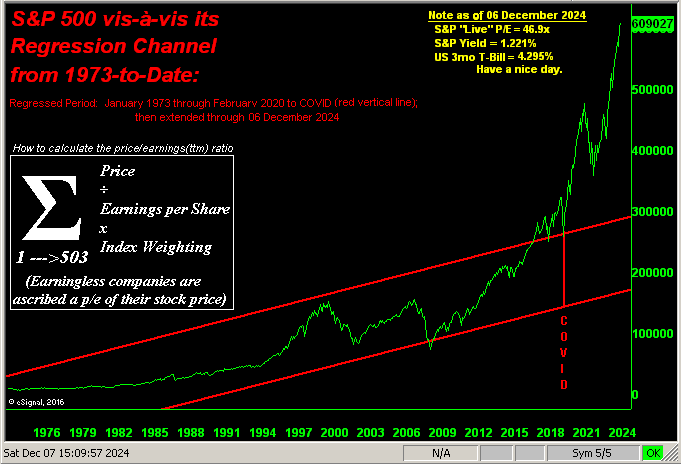
‘Course, your “expert” all-in equites money manager has the appropriate protection in place, right? (Pssst … and given the current $53T market cap of the S&P is supported by a liquid U.S. money supply of “only” $22T, broker-issued IOUs will be made available, right?)
“Got Gold?”
Cheers!
…m…
www.TheGoldUpdate.com
www.deMeadville.com
and now on “X”: @deMeadvillePro
06 December 2024 – 08:43 Central Euro Time
Presently, all eight BEGOS Markets are within their respective Neutral Zones for today, and volatility to this point of the session is light-to-moderate. The Metals Triumvirate is thus far getting the most play, the EDTR (see Market Ranges) tracings being 68% for Silver, 71% for Copper and 77% for Gold. As anticipated, both the Euro and Swiss Franc have moved higher since their “Baby Blues” (see Market Trends) climbed above their -80% axes coming out of last week. And going ’round the Market Values horn for the five primary BEGOS components we’ve (in real-time) the Bond as better than +3 points “high” above its smooth valuation line, the Euro -0.012 points “low”, Gold -20 points “low”, Oil -1.43 points “low” and the Spoo +229 points high. The S&P 500 has been at an “extreme” level of being “textbook overbought” now for seven consecutive trading days, a condition not seen since early November 2021, following which the Index “corrected” by better than -22% over the ensuing eight months. The Econ Baro concludes its week with December’s UofM Sentiment Survey, November’s Payrolls and late in the session October’s Consumer Credit.
05 December 2024 – 08:27 Central Euro Time
The Euro is the sole BEGOS Market outside (above) its Neutral Zone for today; session volatility is very light. Gold’s 12hr Parabolics flipped to Long effective today’s open: of the 405 Market Rhythms run each evening, this one ranks in the top ten and has produced a minimum of 17 points of follow-through (either Long or Short) in nine of the past 10 signals; of course, the more dominant weekly Parabolic trend remains Short; too, (inclusive of real-time), Gold’s 21-day linear regression trend is neutral, its “Baby Blues” (see Market Trends) smack on their 0% axis, but themselves rising. For the S&P 500, its “live” (futs-adj’d) P/E is now 46.6x, the Index now overbought through 35 of the past 39 trading days, and at our “extreme” level through the past six. Today’s incoming metrics for the Econ Baro include November’s Trade Deficit.
04 December 2024 – 08:36 Central Euro Time
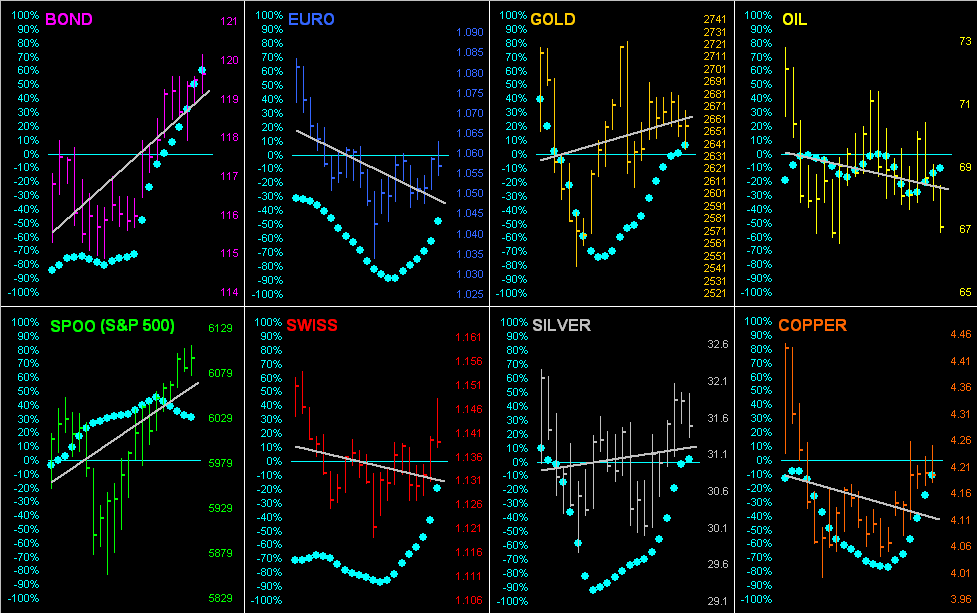
At present, all eight BEGOS Markets are within their respective Neutral Zones for today, and session volatility is light. In looking at Market Ranges, notably narrowing of late include those for the Bond, Silver, Copper, Oil, and to some extent the Spoo. As to Market Rhythms’ pure swing consistency, on a 10-test basis the current leaders are Oil’s 15mn Moneyflow, Silver’s 1hr MACD and 8hr Price Oscillator, plus the non-BEGOS Yen’s daily Parabolics; on a 24-test basis the current best are Gold’s 2hr MACD, and as has been mentioned in multiple commentaries, the non-BEGOS Yen’s daily Price Oscillator. The Econ Baro looks to November’s ADP Employment data, ISM(Svc) Index and October’s Factory Orders. Then late in the session comes the Fed’s Tan Tome.
03 December 2024 – 08:42 Central Euro Time
At present below today’s Neutral Zones are the Bond and Swiss Franc; above same are Silver and Copper, and session volatility is light-to-moderate. The non-BEGOS Yen’s daily Price Oscillator — which has be dominating the top of our Market Rhythms runs on a 24-test basis for pure swing consistency — confirmed flipping from Short to Long at today’s open: currently 0.0066815, ‘twould be well within historical performance range to see an ascent up to at least .0068940 into year-end; (the average full swing duration of this Rhythm over the past three years is some seven trading weeks). Also for currencies, just as yesterday we cited the Swiss Franc’s having (by Market Trends) its “Baby Blues” cross above the key -80% axis, so too now has that measure for the Euro; the Dollar’s weakening over the past two weeks looks to further strengthen these attendant currencies. ‘Tis a quiet day for the Econ Baro which yesterday benefitted by both the ISM(Mfg) Index and Construction Spending.
02 December 2024 – 08:32 Central Euro Time
Save for Oil, ’tis a red start to December for the seven other BEGOS Markets, each one (except for the mildly negative Spoo) at present below their respective Neutral Zones for today; volatility is firmly moderate, likely pushing toward robust as the day unfolds. The S&P 500’s “textbook overbought” stance is at our “extreme” reading: indeed ’tis been overbought for 17 consecutive trading days and in total for 32 of the last 36; the “live” (futs-adj’d) P/E is presently a whopping 45.5x and the yield 1.228%; that annualized for the risk-free 3-month T-Bill is 4.373%. On Friday, the Swiss Franc’s “Baby Blues” (see Market Trends) confirmed crossing above the key -80% axis, indicative of still higher prices: currently 1.1327, a near-term push to at least 1.1442 wouldn’t be untoward. The Econ Baro begins December with November’s ISM(Mfg) Index and October’s Construction Spending.

29 November 2024 – 08:48 Central Euro Time
The two-day abbreviated session for the BEGOS Markets continues with just the Swiss Franc at present outside (below) its Neutral Zone; volatility for the combined session is moderate. Of note from our Market Magnets page, those for both the Euro and Swiss Franc have been price penetrated to the upside, whilst for Gold to the downside: such penetrations are indicative of continued near-term direction. The Spoo suggests a higher open for the S&P 500, its “textbook overbought” streak to be further extended. Early BEGOS Market’s closures are as follows (all GMT): the Bond 18:15, EuroCurrencies 19:45, Metals Triumvirate 19:45, Oil 19:45, and the Spoo 19:15. As stated in the still current edition of The Gold Update, tomorrow’s edition shall be quite brief given our writing remotely this time ’round.
28 November 2024 – 08:26 Central Euro Time
Whilst StateSide ’tis the Thanksgiving holiday, the BEGOS Markets are active for two abbreviated sessions combined into Friday settlement. And at present below their Neutral Zones are the Euro, Swiss Franc and Silver; the balance of the components are within same, and volatility is light. Going ’round the Market Values horn of the five primary BEGOS elements, we’ve (in real-time) the Bond as some +1.2 points “high” above its smooth valuation line, the Euro -0.018 points “low”, Gold as -51 points “low, Oil as -1.24 points “low” and the Spoo as 206 points “high”. Yesterday, the S&P 500 completed its 16th consecutive trading days as “textbook overbought”, indeed its 31st of the past 35. Today’s GLOBEX trading halts commence from 18:00 GMT for the Spoo through the usual 22:00 GMT for the currencies.
27 November 2024 – 08:02 Central Euro Time
Save for the mildly lower Euro, Oil and Spoo, the balance of the BEGOS Markets are higher; notably above their Neutral Zones at present are the Swiss Franc and Metals Triumvirate; session volatility is light ahead of a large load of incoming EconData. Our top two current Market rhythms for pure swing consistency are (on a 10-test basis) Copper’s 15mn Parabolics and Silver’s 8hr Price Oscillator; too (on a 24-test basis) remains the non-BEGOS Yen’s daily Price Oscillator, plus Gold’s 30mn Price Oscillator. StateSide, ’tis the final full trading day of the week. And for the Econ Baro, incoming metrics today include October’s Personal Income/Spending, “Fed-favoured” Core PCE Prices Index, Durables Orders and Pending Home Sales, plus the second peek at Q3 GDP.
26 November 2024 – 08:30 Central Euro Time
Presently, all eight BEGOS Markets are in the red and all (save for the Bond) below today’s Neutral Zones; volatility is mostly moderate. The S&P 500 continues its “textbook overbought” stance: however, yesterday’s MoneyFlow belied the Index’s up day of +0.3%, citing it ought instead have been -2.0%; the MoneyFlow of the S&P is a leading indicator (see The S&P 500, MoneyFlow); the three most negative cap-weighted outflows came from NVDA, TSLA and NFLX; indeed, the outflow from NVDA was sufficient for it to lose top spot in the largest cap-weighted constituents (see too Valuations & Rankings). The best directional correlation amongst the five primary BEGOS Markets currently is positive between Gold and Oil. The Econ Baro awaits November’s Consumer Confidence and October’s New Home Sales. Also late in the session we’ve the FOMC Minutes from the 06-07 November meeting.
25 November 2024 – 08:32 Central Euro Time
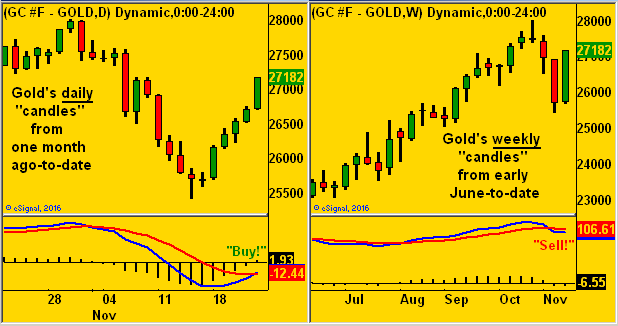
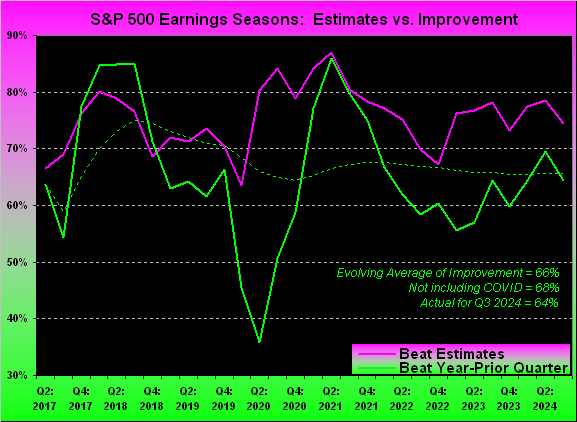
All eight BEGOS Markets are at present outside of their respective Neutral Zones for today: above are the Bond, Euro, Swiss Franc, Copper and Spoo; below are Gold, Silver and Oil; session volatility is moderate-to-robust. Gold has already given back as much as 38% of last week’s +151 points gain: The Gold Update highlights Gold’s stellar week as nonetheless a contra-trend rally within the fresh weekly parabolic Short trend; key to assess this week shall be Wednesday’s PCE data for October; too, Gold is whipsawing ’round its smooth valuation line (see Market Values), today having crossed back below it. Well up thus far today is the Bond: we’d of late written our anticipation of a such a move, notably as the Bond’s “Baby Blues” (see Market Trends) have twice crossed above their -80% axis since 11 November. And Q3 Earnings Season concluded on Friday, the sub-par performance seeing 64% of S&P 500 constituents bettering their bottom lines over Q3 a year ago: the average such improvement since 2017 is 66%, and ex-COVID, 68%. The “live” (futs adj’d) P/E of the S&P is presently 44.9x.
The Gold Update: No. 784 – (23 November 2024) – “Gold’s Contra-Trend Rally; S&P’s Earnings(less) Tally”


So into the StateSide Thanksgiving week we go: 11 metrics come due for the Econ Baro, including 10 packed into Monday through Wednesday, the PCE data surely to get the lion’s share of interest.
Moreover: we’ve this heads-up for next Saturday’s edition of The Gold Update. We shall be once again “in motion”, this time through the treasured beauty of Tuscany. Thus akin to the occasional “Gold in 60 Seconds”, next week’s piece shall be quite brief. True, ’tis is a month-end edition, normally graphics-rich. However, we’ll like save most of those for the ensuing 07 December missive. Either way, Gold’s reaction to next Wednesday’s PCE shall be key.
As we thus prepare to embark for Golden Tuscany, ensure your tally totals a Golden Destiny!

Cheers!
…m…
www.TheGoldUpdate.com
www.deMeadville.com
and now on “X”: @deMeadvillePro
22 November 2024 – 08:32 Central Euro Time
Both Gold and Silver are at present above today’s Neutral Zones, whilst below same is Copper; the balance of the BEGOS Markets are calm, and session volatility remains light to this point. Gold has had a firm contra-trend rally this week even as the weekly parabolic trend just flipped from Long-to-Short a week ago: more of course in tomorrow’s 784th consecutive Saturday edition of The Gold Update. At Market Trends, the sole BEGOS component with a positive linreg is the Spoo. The S&P’s “textbook overbought” streak continues, the sub-par Q3 Earnings Season (which concludes today) in turn maintaining a stratospherically high “live” P/E of 45.4x (futs-adj’d for real-time). Bitcoin appears poised to tap 100,000 today, (high 99,820). And the Econ Baro concludes its quiet week with the monthly revision to November’s UofM Sentiment Survey.
21 November 2024 – 08:38 Central Euro Time
Both Gold and Silver are at present above their respective Neutral Zones for today, whilst below same is the Spoo; volatility is again light. Looking at Market Values in real-time for the five primary BEGOS Markets, we’ve the Bond as -1.50 points “low” vis-à-vis its smooth valuation line, the Euro -0.024 points “low”, Gold -16 points “low”, Oil -0.99 points “low” and the Spoo +131 points “high”. The S&P 500 is now 11 consecutive trading days “textbook overbought” and further is 26 days as such across the past 30. The “Baby Blues” (see Market Trends) for the Precious Metals are starting to curl upward, albeit their linregs remain well negative. And for the Econ Baro, incoming metrics include November’s Philly Fed Index, plus October’s Existing Home Sales and Leading (i.e. “Lagging”) Indicators.
20 November 2024 – 08:38 Central Euro Time
Save for Oil and the Spoo, the other six BEGOS Markets are lower, notably with the Bond, Euro, Swiss Franc, Gold and Silver at present below today’s Neutral Zones; the Spoo is above same, and volatility is light. The Bond’s “Baby Blues” (see Market Trends) have — for the second time in as many weeks — moved above their key -80% axis: thus we look to still higher Bond prices near-term following Friday’s low of 115^09 (present price is 116^12). In looking at Market Rhythms, on a 10-test basis our current leaders for pure swing consistency are Oil’s 8hr Moneyflow, Silver’s 8hr Price Oscillator and the Spoo’s 1hr Moneyflow; the lone leader on a 24-test basis continues to the non-BEGOS Yen’s daily Price Oscillator. Nothing is due today for the Econ Baro. And with the “live” futs-adj’d P/E of the S&P now 45.2x, we’ve three days left to run in this sub-par Q3 Earnings Season.
19 November 2024 – 08:21 Central Euro Time
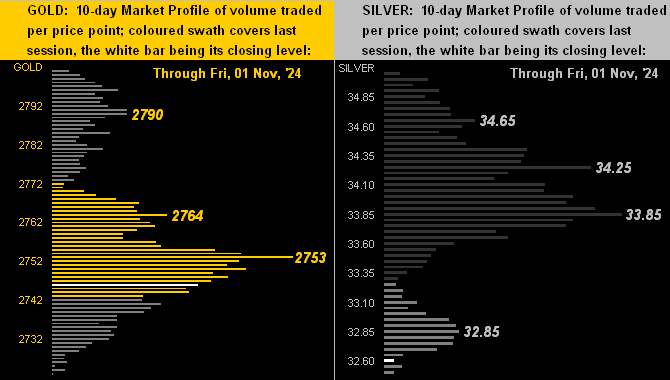
The Euro is at present below its Neutral Zone for today, whilst above same is Gold; ’tis a bit ironic given our best current correlation amongst the five primary BEGOS Markets is positive between the Euro and Gold, albeit market dynamics continually shift; session volatility is quite light. Gold has moved back above 2600, however our anticipated move lower into the 2400s remains very viable, the weekly parabolic trend being newly Short along with the negative MACD crossover; still, Gold has cleared the 2615 handle which by the Market Profile is the most dominantly-traded price of the past fortnight; mind, too, Gold’s price vis-à-vis its smooth valuation line (see Market Values): in real-time, price is presently -57 points “low”. Meanwhile, the S&P 500 continues its “textbook overbought” streak, the “live” futs-adj’d P/E now 44.8x. The Econ Baro looks to October’s Housing Starts/Permits.
18 November 2024 – 08:01 Central Euro Time
At present, all eight BEGOS Markets are in the black, with the Metals Triumvirate and Spoo currently above their respective Neutral Zones for today; session volatility is mostly moderate. The Gold Update acknowledges our anticipated pullback in price, with potentially lower levels at least near-term as the weekly MACD confirmed a negative crossing at week’s close such that the upper 2400s would not be untoward. For the Spoo, price on Friday confirmed piercing to the downside its Market Magnet, suggestive of still lower levels; by Market Values (in real-time), the Spoo shows as +140 points “high”; and despite last week’s selling, the S&P 500 itself remains “textbook overbought” through 23 of the past 27 trading days; the futs-adj’d “live” P/E is presently 44.0x. For the Econ Baro ’tis a fairly light week, beginning today with November’s NAHB Housing Index. And Q3 Earnings Season continues into its final week.
The Gold Update: No. 783 – (16 November 2024) – “ ‘Tis No Surprise, Gold’s Current Demise ”


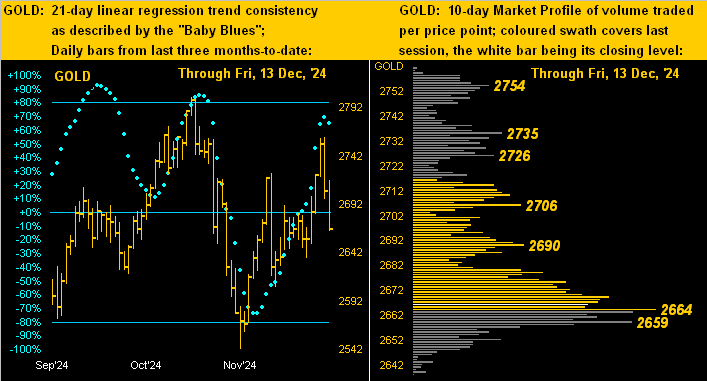
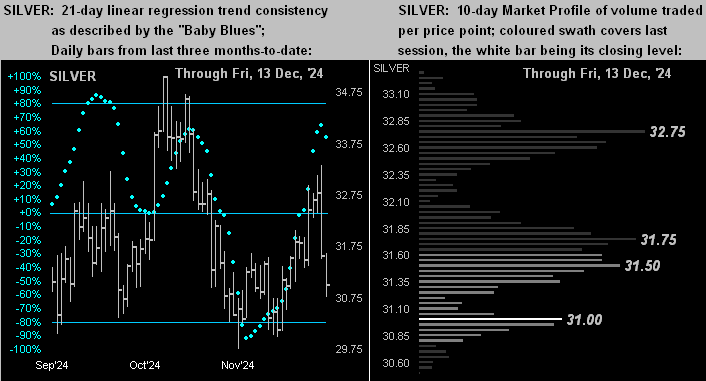
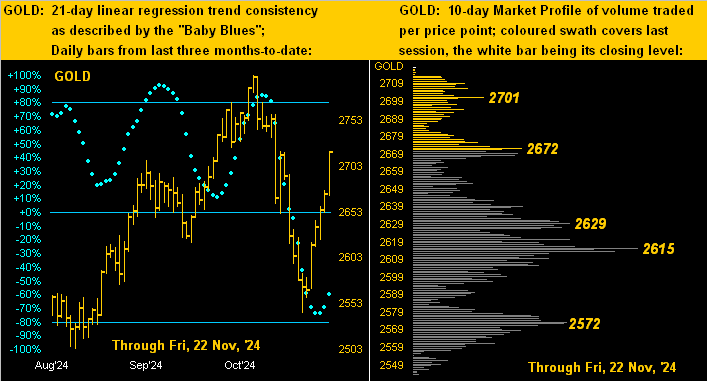
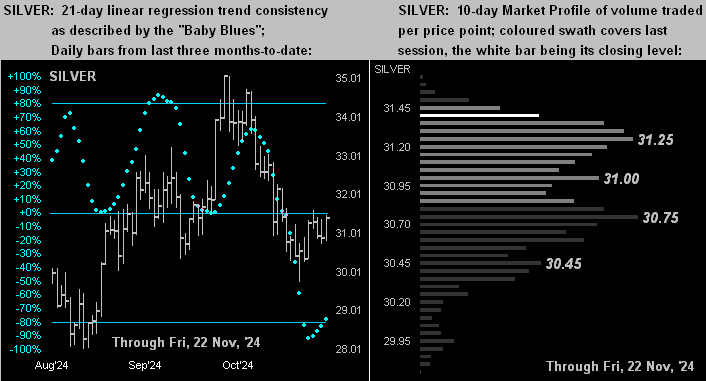
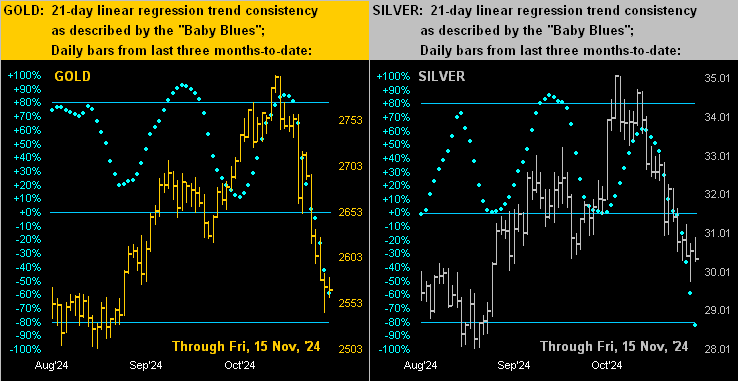
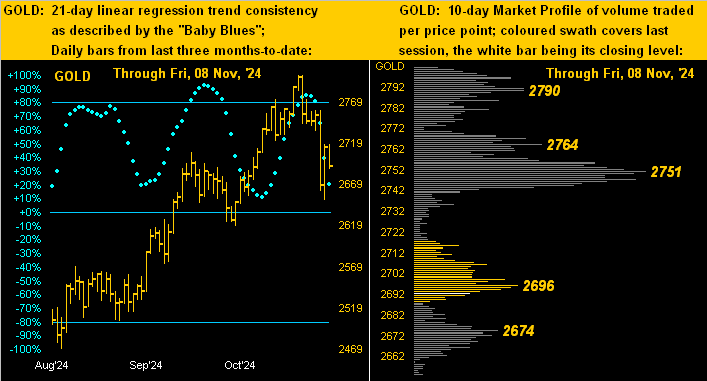
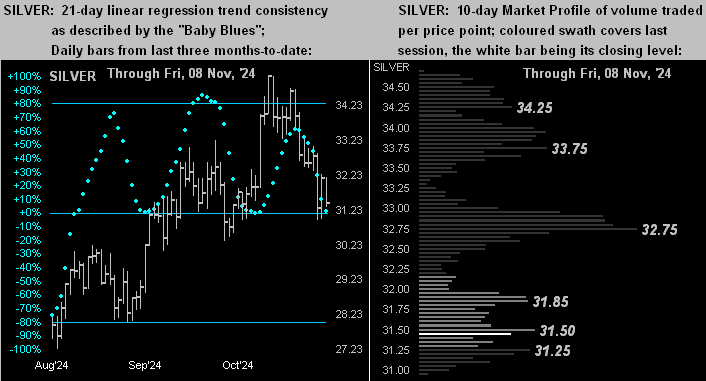
Further as noted, when the Buck gets the bids, “everything else” goes on the skids, including ‘natch the precious metals. ‘Tis not the happiest of two-panel displays, but here next are the last three months-to-date of daily bars for Gold on the left and for Silver on the right, along with their respective baby blue dots of trend consistency. Cue our lead (pun intended) conductor with ![]() “Follow the Blues instead of the news, else lose yer shoes…“
“Follow the Blues instead of the news, else lose yer shoes…“![]() :
:
And so to wrap, let’s go with The Stack:
The Gold Stack
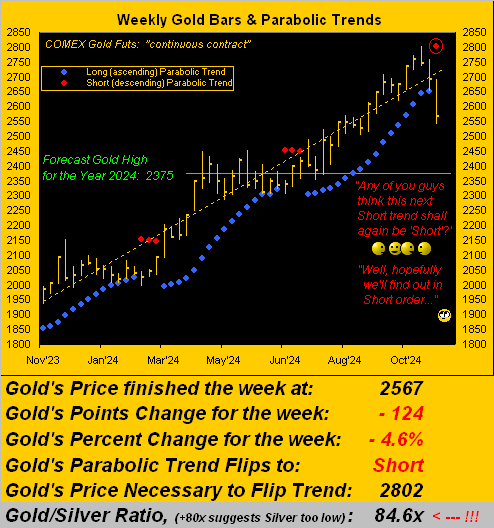
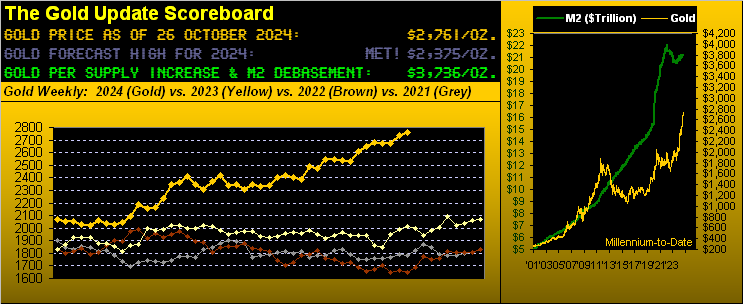
Gold’s Value per Dollar Debasement, (from our opening “Scoreboard”): 3740
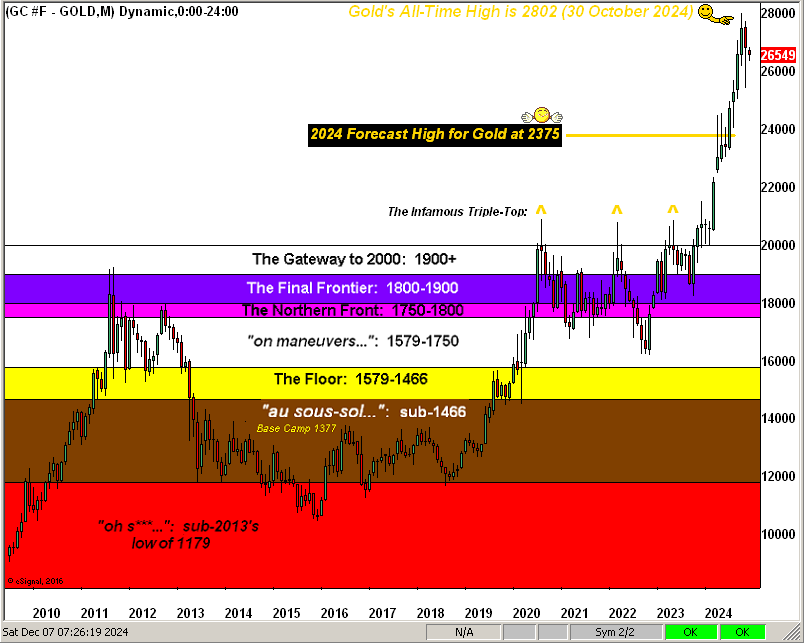
Gold’s All-Time Intra-Day High: 2802 (30 October 2024)
2024’s High: 2802 (30 October 2024)
The Weekly Parabolic Price to flip Long: 2802
Gold’s All-Time Closing High: 2799 (30 October 2024)
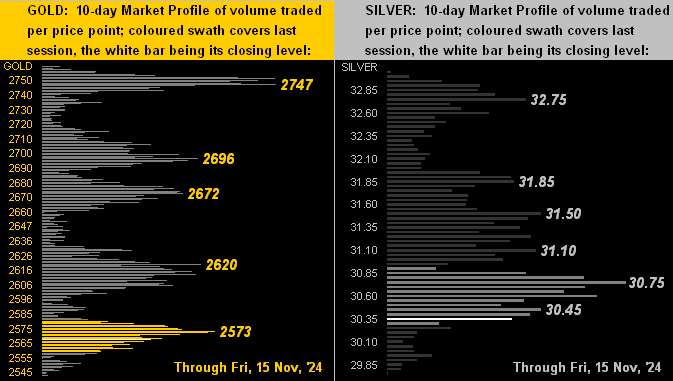
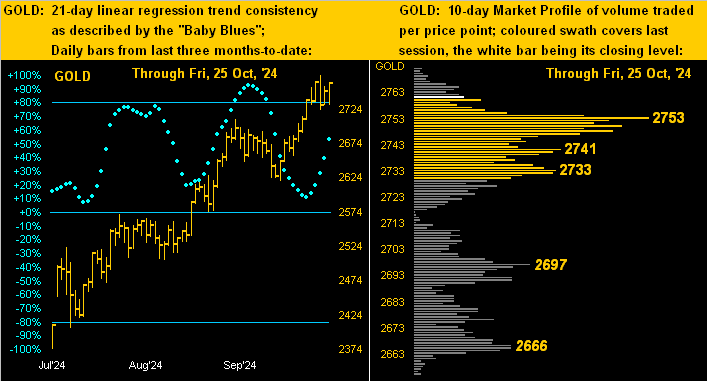
10-Session “volume-weighted” average price magnet: 2656
Trading Resistance: notable Profile nodes 2573 / 2620 / 2672 / 2696 / 2474
Gold Currently: 2567, (expected daily trading range [“EDTR”]: 43 points)
10-Session directional range: down to 2542 (from 2759) = -253 points or -7.9%
Trading Support: none notable per the Profile
The 300-Day Moving Average: 2268 and rising
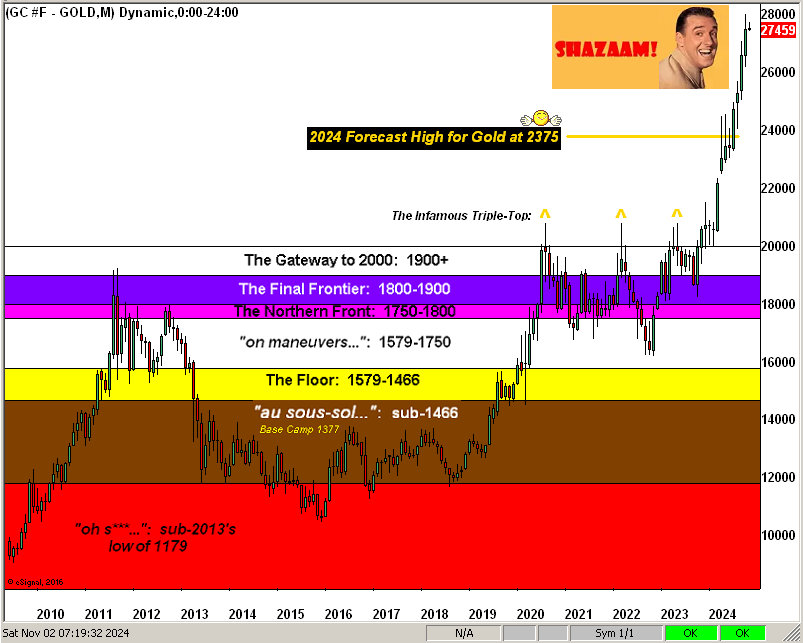
The 2000’s Triple-Top: 2089 (07 Aug ’20); 2079 (08 Mar’22); 2085 (04 May ’23)
2024’s Low: 1996 (14 February)
The Gateway to 2000: 1900+
The Final Frontier: 1800-1900
The Northern Front: 1800-1750
On Maneuvers: 1750-1579
The Floor: 1579-1466
Le Sous-sol: Sub-1466
The Support Shelf: 1454-1434
Base Camp: 1377
The 1360s Double-Top: 1369 in Apr ’18 preceded by 1362 in Sep ’17
Neverland: The Whiny 1290s
The Box: 1280-1240
‘Tis a fairly light, ensuing week for incoming Econ Baro metrics, the most attention-getting one to be the Conference Board’s compiled negative reading of October’s Leading Indicators, (which as led by the Baro we instead refer to as “Lagging”). Too, ’tis the final week of Q3 Earnings Season, which as you know (should you follow its page and/or read the Prescient Commentary) is sub-par compared to average quarterly year-over-year improvement. But as we’ve quite a bit quipped, earnings today are irrelevant to equities’ investing: else the S&P 500 would be at but half its current level.
Otherwise, notwithstanding some further near-term demise, Gold remains ever so cheap for the wise … the bottom line thus being:
Got Gold? Don’t be a chicken! Get yourself some real nuggets and win!

Cheers!
…m…
www.TheGoldUpdate.com
www.deMeadville.com
and now on “X”: @deMeadvillePro
15 November 2024 – 08:26 Central Euro Time
Ahead of a significant load of incoming Econ Baro data, we find the BEGOS Markets fairly mixed, the Euro and Swiss Franc at present above today’s Neutral Zones, whilst below same are Oil and the Spoo; session volatility is mostly moderate. Yesterday the S&P 500 — even being down — posted its 22nd of the past 26 trading days as “textbook overbought”; specific to the Spoo, (for which its all-time high is 6053 per this past Monday), price appears on a downward bent to at least test the prior 17 October high of 5927; the Spoo’s daily MACD seems headed for a negative crossing early into the ensuing week, although by Market Trends, the Spoo’s “Baby Blues” still are in ascent. Again, we’re extending our coverage of Q3 Earnings Season an extra week: thus far for the S&P, 65% of bottom lines have been better over Q3 of a year ago: that is a below-average rate of improvement. Of note, Gold yesterday reached down to the “average” adversity level of 2555 that was mused in last Saturday’s Gold Update; tomorrow brings edition No. 783. And as to the busy Baro, it looks to November’s NY State Empire Index, October’s Retail Sales, Ex/Im Prices and IndProd/CapUtil, plus September’s Business Inventories.
14 November 2024 – 08:16 Central Euro Time
‘Tis red across the board for all eight BEGOS Markets, albeit not at present below today’s Neutral Zones are both the Bond and Oil; volatility is mostly moderate. Our best current correlation amongst the five primary BEGOS components is positive between the Bond and Euro. The S&P 500 yesterday reached our “extreme” level of being “textbook overbought”, meaning price has become excessively high by its BollBands, RSI and Stochastics; and the Spoo in real-time is +228 points above its smooth valuation line (see Market Values); too by Market Trends, the Spoo is the sole market (of all eight) sporting a positive 21-day linear regression trend. The Dollar Index today has reached its firmest level (106.695) since 01 November 2023. And included in today’s incoming metrics for the Econ Baro we’ve October’s wholesale inflation (PPI), expectations there for an increase over the September data by both the headline and core readings.
13 November 2024 – 08:08 Central Euro Time
We’ve at present the Euro, Swiss Franc, Copper and Spoo all below today’s Neutral Zones; none of the other BEGOS Markets are above same, and volatility is light. The buying into the S&P 500 of late has been substantive given our MoneyFlow page: both the one week and one month differentials are positive, whilst the quarterly measure has significantly reduced its negative stance; ‘course the Index nonetheless remains vastly overvalued both fundamentally (lack of supportive earnings) and certainly so near-term (technically). Our BEGOS Market Rhythms’ leaders for best swing consistency are (on a 10-test basis) Oil’s 8hr Moneyflow, the Euro’s 30mn Moneyflow, and for Silver its 8hr and 2hr Price Oscillators, plus its 1hr Moneyflow; too (on a 24-test basis) we’ve still the non-BEGOS Yen’s daily Price Oscillator, along with Copper’s 30mn Parabolics. And October’s retail inflation (CPI) comes due for the Econ Baro as well as (purportedly) the month’s Treasury Budget.
12 November 2024 – 08:29 Central Euro Time
The elements of the EuroCurrencies and Metals Triumvirate all are at present below their respective Neutral Zones for today; the other BEGOS Markets are within same, and volatility is pushing toward moderate. As anticipated through recent weeks, Gold finally let go yesterday to the downside: price’s intra-day drop by both points (-76) and percentage (-2.8%) ranked fifth-weakest year-to-date. In turn, Gold’s weekly parabolic trend has provisionally flipped from Long to Short, whilst price has moved below its smooth valuation line (see Market Values). That for the Spoo is (in real-time) +247 points above same: the S&P 500 itself with its “live” P/E of 46.4x is now “textbook overbought” through 19 days of the past 23. We’re extending our coverage of Q3 earnings out an additional week (through 22 November) given some key constituent S&P stragglers still therein to report. Again the Econ Baro is quiet today with 14 metrics due Wednesday through Friday.
11 November 2024 – 08:33 Central Euro Time
The week’s underway with — at present — the Euro, Swiss Franc and Gold below today’s Neutral Zones; above same is the Spoo, and volatility is light. The Gold Update points to two pending negative crossings for price: should it pierce sub-2650 this week, the weekly parabolic Long trend shall flip to Short; and by Market Values, Gold in real-time is only +13 points above today’s smooth valuation line, the penetration of which then would also suggest lower levels near-term. Too, in real-time, Silver’s “Baby Blues” (see Market Trends) have provisionally moved below their 0% axis, with those for Gold within a day or so of doing same, barring a firm rally. The Econ Baro is quiet both today and tomorrow, the balance of the week highlighted by metrics for inflation and retail sales. And ’tis the final week of an on-balance below-par Q3 Earnings Season for the S&P 500, for which the “live” P/E (futs-adj’d) is presently 46.7x.
The Gold Update: No. 782 – (09 November 2024) – “Gold Trumped, Dumped”

The good news is — even upon Gold’s weekly parabolic trend eventually flipping from Long to Short — that the prior three such Short stints (since the week ending 29 September 2023) have each been but three weeks in duration: that’s it. The intervening Long trends respectively have lasted 17 weeks, 16 weeks, and the current one now 17 weeks. Perhaps a bit too much perfection there, but as crooned Steve “The Joker” Miller back in ’73 ![]() “I get my lovin’ on the run“
“I get my lovin’ on the run“![]() and certainly for Gold, such a run ’tis been!
and certainly for Gold, such a run ’tis been!
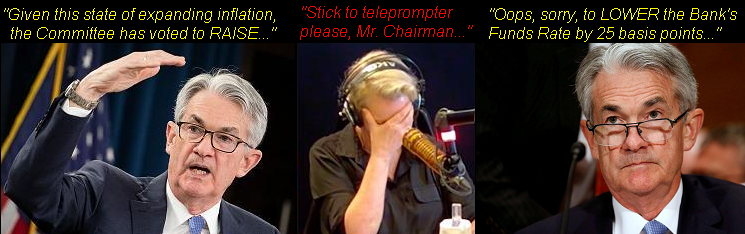
As for the StateSide economy, ’tis been on balance rather run down, albeit the Economic Barometer has bounced and since stabilized from its August low. You tell ’em there, Jay:
Trumped if not dumped, in sum, we analytically expect both Gold and Silver to weather this near-term dip. Either way, your key with them clearly is to maintain a Presidential grip!
Cheers!
…m…
www.TheGoldUpdate.com
www.deMeadville.com
and now on “X”: @deMeadvillePro
08 November 2024 – 08:39 Central Euro Time
Early on, down is the watchword across the BEGOS Markets, the sole exception being the Bond +1 pip; otherwise, only the Swiss Franc and Spoo are not at present below today’s Neutral Zones, and volatility is pushing toward moderate. With one week plus a day to run in Q3 Earnings Season, 65% of the S&P 500’s constituent’s have bettered their bottom lines from Q3 a year ago, which across the past seven years (ex-COVID’s 2020 quarters) is below the 68% improvement average. The futs-adj’d “live” P/E of the S&P at this instant is 44.4x and the yield 1.234%; the three-month U.S. T-Bill’s annualized yield is 4.420%. The Spoo, now over 6000, is by Market Values (in real-time) +226 points above its smooth valuation line. And the S&P itself is now “textbook overbought” through 17 of the past 21 trading days. The Econ Baro rounds out its week with November’s UofM Sentiment Survey.
07 November 2024 – 08:44 Central Euro Time
The BEGOS Markets are returning to a more orderly condition post-election: at present above their respective Neutral Zones for today are the Bond, Euro, Swiss Franc and Copper; the balance of the bunch are within same, and volatility — after having been extremely robust — is now moderate. Yesterday, Gold’s “Baby Blues” confirmed settling below their key +80% axis, suggestive of further near-term selling from which (as you regular readers know) had been an ongoing near-term overvalued stance: indeed by Market Values, Gold (in real-time) is but +14 points “high” above its smooth valuation line, the penetration of which would also suggest further downside, all of which we’ll assess in Saturday’s Gold Update. As for other Market Values’ deviations: the bond shows as nearly -5 points “low”, the Euro -0.018 points, “low”, Oil basically “in-line”, and the Spoo +186 points “high”. The day’s incoming Econ Baro metrics include September’s Wholesale Inventories and Consumer Credit, plus the initial read on Q3 Productivity and Unit Labor Costs. And come 19;00 GMT, the FOMC releases its Policy Statement for which expectations are a -25bp FedFunds rate cut.
06 November 2024 – 08:41 Central Euro Time
As anticipated in yesterday’s comment given the StateSide election, overnight volatility in the BEGOS Markets was both thin and very volatile: the average EDTR (see Market ranges) tracing thus far across the eight BEGOS components is an extreme 216 points. The Spoo is the sole market above today’s Neutral Zone; the other seven components are below same. Were the S&P to open at this instant, ‘twould “instantly” gap to a record-high 5891, (the current all-time high being 5878). By Market Rhythms on a 10-test basis for pure swing consistency, our leaders (through yesterday’s session) are Oil’s 8hr Moneyflow, Silver’s 8hr Price Oscillator, and Copper’s 8hr Moneyflow, (a lot of commonality there for measuring on an 8hr time frame); for the 24-test basis, we still highlight the non-BEGOS Yen’s daily Price Oscillator, plus the Euro’s 15mn MACD. Nothing is due today for the Econ Baro. And the FOMC commences its two-day meeting, their Policy Statement scheduled for release tomorrow.
05 November 2024 – 08:41 Central Euro Time
Both the Euro and Copper are at present above today’s Neutral Zones; below same is Oil, and BEGOS Markets’ volatility is light. In both our Prescient Commentary and the current edition of the Gold Update we’ve anticipated near-term rises for the Euro and Copper, and indeed that has come to pass at least to the point, the impetus being the up movements in their respective “Baby Blues” (see Market Trends) from having been below their -80% axes. Looking at correlations amongst the five primary BEGOS components, the best at present is negative between Oil and the Spoo. For the Econ Baro we’ve October’s ISM(Svc) Index and September’s Trade Deficit. Too, StateSide, ’tis Election Day, after which overnight trading conditions may be quite thin and volatile.
04 November 2024 – 08:01 Central Euro Time
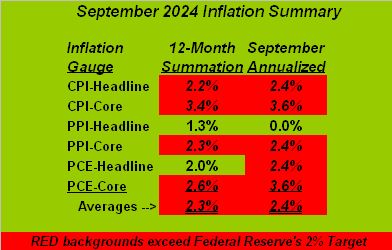
‘Tis black across the board to start the week for all eight BEGOS Markets, with seven of them at present above today’s Neutral Zones, the sole one within being Gold; volatility already is moderate-to-robust with the StateSide election (Tuesday) and FOMC Policy Statement (Thursday) in the week’s balance. The Gold Update continues pointing to the yellow metal being overvalued near-term, yet undervalued long-term; and our inflation table therein highlights the pickup in the “Fed-Favoured” Core PCE Prices Index. By Market Values, Gold (in real-time) is +99 points above its smooth valuation line. Otherwise, ’tis a fairly light week of incoming metrics for the Econ Baro, beginning today with September’s Factory Orders.
The Gold Update: No. 781 – (02 November 2024) – “Gold’s Highs; Inflation’s Rise”

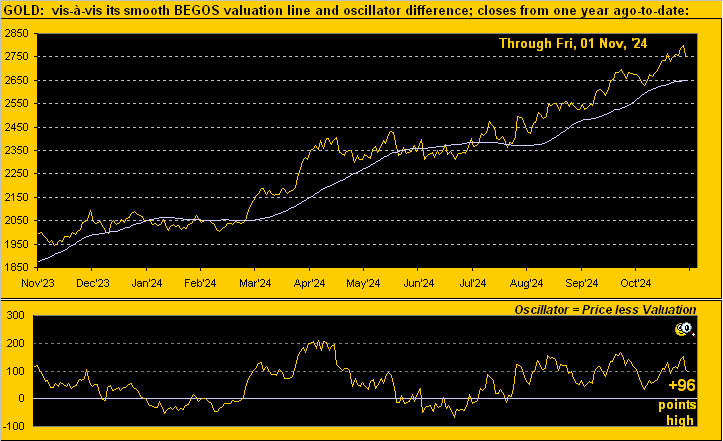
Still, we maintain that Gold’s deviation from its BEGOS valuation merely underscores the run of justly due buying. In fact, across these 16 years of producing The Gold Update, never do we recall so many folks whom we encounter on a day-to-day basis questioning us about Gold. And given its significant undervaluation relative to currency debasement, we regularly point out that — despite Gold’s run of record highs — most broadly ’tis still cheap … as is Silver relative to Gold … the white metal indeed super cheap. Updating the math there: valuing Gold at 3738 and applying the century-to-date Gold/Silver evolving average ratio of 68.5x puts Silver at  54.57! That is +67% above her present price of 32.58. Why, even applying said average ratio vis-à-vis today’s Gold level of 2746 places Silver some +23% higher at 40.09, the actual ratio at present being 84.3x. Thus we repeatedly reprise: Do not forget Sweet Sister Silver!
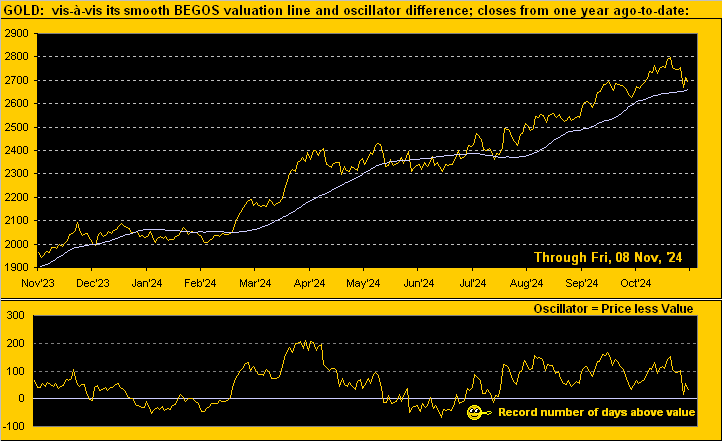
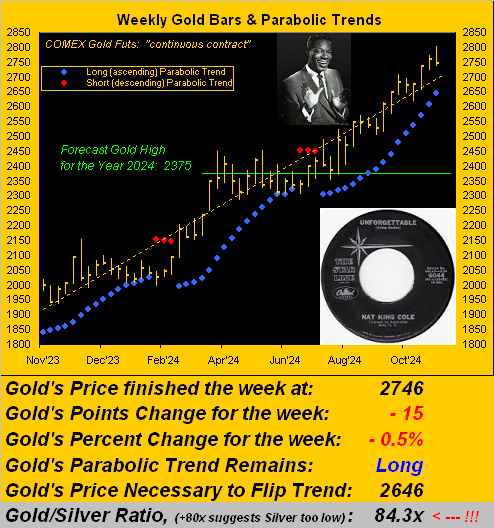
As for Gold itself, by the weekly bars from one year ago-to-date, we can only cue Nat King Cole from back in ’51 with![]() “Unforgettable…”
“Unforgettable…”![]() :
:
“The S&P has been coming back down, mmb, but to call it ‘mild’?”
Nobody tees it up better than Squire. His observance notwithstanding, the wee rightmost drop indeed is comparatively “mild” relative to the increase in the S&P year-over-year. And of even further import, here (employing “trailing 12-months earnings”) is the truthfully “live” price/earnings ratio of the S&P 500, duly including these two most recent consecutive down weeks:
At least we can offer a hat-tip to the mighty Swiss-based UBS, whose Nicolas le Roux-led strategy team just penned the bank’s expectations “…for equities to cheapen relative to bonds…” Perhaps Nico and company have been reading The Gold Update and the website’s daily Prescient Commentary both of which have gone on ad nauseum for months about same. Just in case you’re scoring at home, the all-risk S&P yield is presently 1.293% whilst no-risk U.S. debt across the maturity spectrum yields better than 4%. (Which means for you WestPalmBeachers down there … no, forget it … you’re too pre-occupied in trying to figure out how to do a ballot).
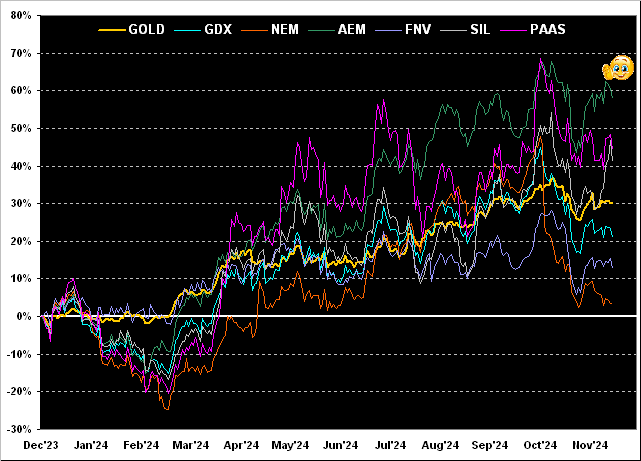
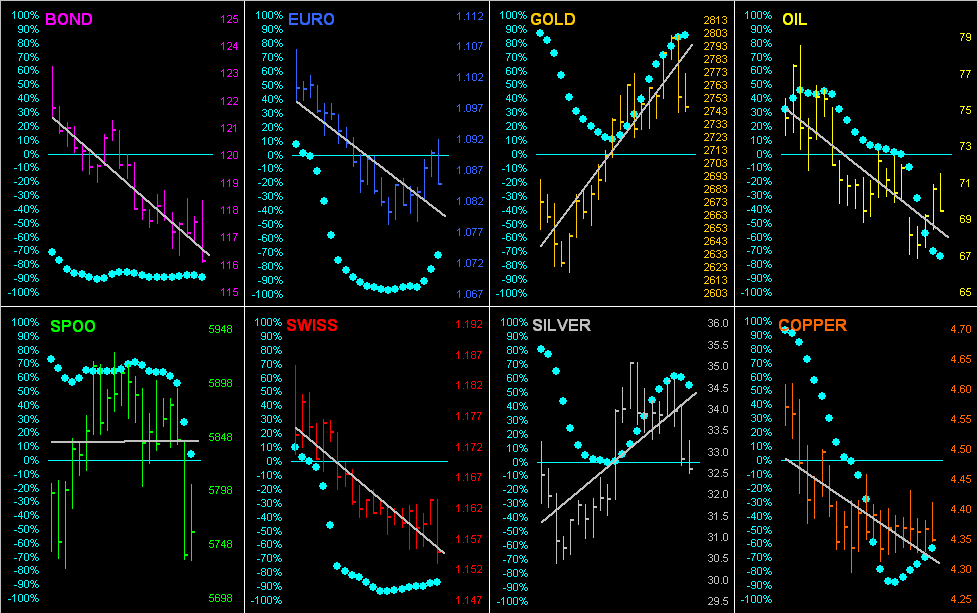
Meanwhile, it being month-end (plus one trading day), ’tis time to go ’round the horn for all eight of our BEGOS Markets from a month ago (last 21 trading days)-to-date, featuring their respective grey linear regression trendlines and “Baby Blues”, the dots denoting the consistency of said trends. Focus here ought be on both the Euro and Copper, their “Baby Blues” having curled up from beneath the -80% level, the rule-of-thumb being to then anticipate higher price levels near-term:
StateSide there’s an election next week. Just as the frequency with which we’re asked about Gold these days has been inexorably on the increase, so too are we questioned: “Who’s gonna win?”
‘Course, nobody knows, and sentiment varies based on one’s favoured sources of information, given that 99.999% of us have never actually met (let alone personally know) either the “current democrat” nor the “former democrat”.
But the one point upon which all seem to agree is — regardless of who “wins” or is “declared” the next President — there shall be an ensuance of StateSide chaos both in the markets and (hopefully still) civil society. Gold, too, could certainly get banged about a bit: again, ’tis near-term overvalued. But because ’tis long-term undervalued — be it on the left or on the right — Gold is far and away the best candidate to keep your future bright!
Cheers!
…m…
www.TheGoldUpdate.com
www.deMeadville.com
and now on “X”: @deMeadvillePro
01 November 2024 – 08:10 Central Euro Time
Both the Bond and Gold are at present above today’s Neutral Zones; the balance of the BEGOS Markets are within same, and volatility is light. ‘Twas somewhat refreshing to see yesterday’s -1.9% dip in the S&P 500, the Spoo finally coming back in line with its smooth valuation line (see Market Values) for the for time since 10 September; indeed the Spoo retraced back nearly a month’s worth of gains in a single session; ‘course more broadly, the S&P itself remains extremely expensive, the “live” (futs-adj’d) P/E presently 41.5x. Gold, too, had a bit of a hoovering, albeit price (in real-time) is still well above its smooth valuation line by +111 points; more in tomorrow’s 781st consecutive Saturday edition of The Gold Update. The Econ Baro looks to close out its busy week with October’s Payrolls Data and ISM(Mfg) Index, plus September’s Construction Spending.
31 October 2024 – 08:13 Central Euro Time
The Bond is at present above today’s Neutral Zone, whilst below same are both Gold and the Spoo; BEGOS Markets’ volatility is moderate; the non-BEGOS Yen has already traced 126% of its EDTR, (for that of the actual BEGOS components see Market Ranges); the Yen has worked all the way back up to close the gap following its fallout from last Sunday’s parliamentary election. By Market Trends, the 21-day linregs are positive for Gold, Silver and the Spoo, but are negative for the Bond, Euro, Swiss Franc, Oil and Copper: as noted yesterday however, Copper’s “Baby Blues” have moved above their key -80% axis, typically meaning a near-term up move for price. ‘Tis a busy day for the Econ Baro, incoming metric’s including October’s Chi PMI, September’s Personal Income/Spending and “Fed-favoured” Core PCE Prices as an inflation gauge, plus Q3’s Employment Cost Index.
30 October 2024 – 08:21 Central Euro Time
At present we’ve Gold as the sole BEGOS Market above its Neutral Zone for today; the balance of the bunch are within same, and volatility is light. The yellow metal today has traded above 2800 (2802) for a fresh All-Time High. And leading all 405 of our Market Rhythms for pure swing consistency on a 10-test basis is Gold by its 4hr Moneyflow. On a 24-test basis, the leader is still the non-BEGOS Yen’s daily Price Oscillator, followed by Copper’s 15mn Moneyflow: the red metal’s “Baby Blues” (see Market Trends) yesterday confirmed having moved above their -80% axis, suggestive of a near-term run from here in the 4.30s up into the 4.50s. For the Econ Baro we’ve October’s ADP Employment data, September’s Pending Home Sales, and the first peek at GDP for Q3.
29 October 2024 – 08:00 Central Euro Time
Safe havens are getting the bid early on as we’ve the Bond, Gold and Silver all at present above today’s Neutral Zones; below same are Copper and Oil, and BEGOS Markets’ volatility is pushing toward moderate. Our best current correlation amongst the five primary BEGOS components is negative between Oil and the Spoo: the best Market Rhythms therein (both on a 10-test basis for pure swing consistency) for Oil is its 8hr Moneyflow and for the Spoo its 12hr MACD. Gold’s All-Time High is 2773 (23 October) with present price 2767 and an EDTR (see Market Ranges) of 30 points; still, by Market Values, Gold near-term remains “high”, now (in real time)+123 points above its smooth valuation line. For the Econ Baro we await October’s Consumer Confidence.
28 October 2024 – 08:10 Central Euro Time
We begin the busy week finding at present the Bond, Swiss Franc, Gold and Oil below their respective Neutral Zones for today; above same is the Spoo, and volatility is moderate-to-robust, the Bond already having traced 110% of its EDTR (see Market Ranges). The Gold Update lauds the yellow metal’s near-perfect performance this year, indeed having come within $1,000/oz. of its Dollar debasement valuation for the first time in ten years; still, we warily point to Gold’s near-term overvaluation per price’s movement relative to the other primary BEGOS Markets: in real-time, Gold is +117 points above that smooth valuation line (see Market Values). Nothing is due today for the Econ Baro ahead of a slew of 17 incoming metrics as the week unfolds. And at the halfway point of Q3 Earnings Season for the S&P 500 constituents, ’tis running about average per prior year-over-year quarterly improvements (68% thus far doing better and thus 32% not so).
The Gold Update: No. 780 – (26 October 2024) – “Gold Taps a Ten-Year Frontier”
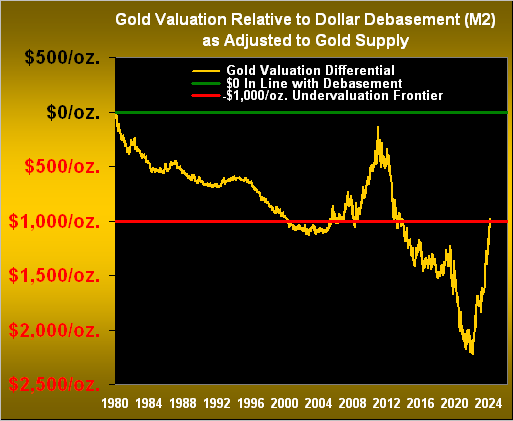
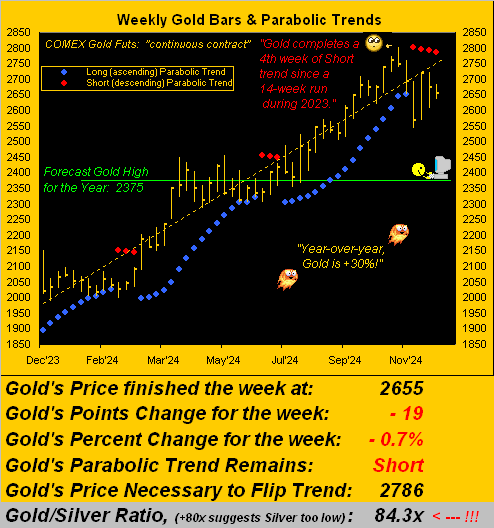
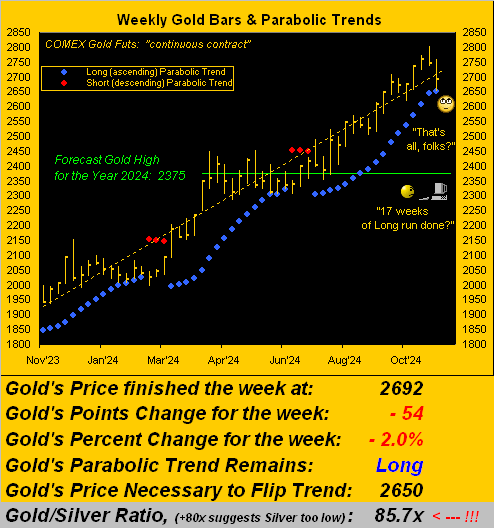
Gold’s firm rally so far this year (correctly incorporating Squire’s 37 days of All-Time Highs) has remained magnificently intact, indeed having well-exceeded our “conservative” (as ’twas couched at New Year) forecast high in 2024 of 2375.
So per the above graphic, having surpassed (at least for the moment) the -$1,000/oz. undervaluation frontier, does this mean Gold finally is en route in racing up to where it “ought be”, (i.e. at the horizontal green line)?
To be sure, Gold (cue the yucky woke word) “awareness” is certainly increasing at least per the pages of the FinMedia. But is that translating into enough substantive buying to power Gold to its proper 3700+ perch? A good many years ago on a Merrill Lynch “call to clients” in which a piece of our work was featured, the host opined that only some 5.0% of managed portfolios carried Gold exposure. Then in more recent years, (Al Gore’s invention of the internet having since extrapolatively expanded), such number has been bandied down to as low as 0.5%.
We’ve thus decided to go with something assumed to be in the modern-day know: “AI“. So in specifically querying such “Assembled Inaccuracy”, the salient part of its responding was: “…75 percent of private client discretionary investment managers have under 2.5 percent gold exposure…”, followed by the available sources “AI” scrounged, and in turn, its disclaimers.
‘Course for this to have any meaningful relevancy, we need know the status of the other 25%. Otherwise ’tis all (per The Stones from ’65): ![]() “…About some useless information, Supposed to fire my imagination, I can’t get no … Satisfaction…”
“…About some useless information, Supposed to fire my imagination, I can’t get no … Satisfaction…”![]() let alone accuracy as to managed Gold ownership.
let alone accuracy as to managed Gold ownership.
The bottom line being: as long as stocks remain “the only thing”, Gold shan’t immediately the 3700+ bell ring.
Still, one can’t argue with the golden brilliance of price’s weekly bars from a year ago-to-date, the current blue-dotted parabolic Long trend having completed its 15th week with still plenty of room (154 points) between present price (2761) and the “flip to Short” level (2607, itself now rising at a rate of some +30 points per week). Either way, wherein understanding range is critical to cash management, Gold’s expected weekly trading range is now 73 points; the daily range (see the website’s Market Ranges and/or Gold page) is currently 31 points. So notwithstanding the near-term overvaluation note therein, our Gold graphic here points as positively as one could prefer:


Then there’s next week, for which the load of incoming economic metrics is massive(!). 17 reports come due for the Econ Baro, including the “Fed-Favoured” inflation gauge of Core Personal Consumption Expenditures Prices for September. And the “consensus” expection is for it to have risen … we even read within the mist of the past week’s FinMedia the query (paraphrased) “What if the Fed instead raises rates?” come its Open Market Committee’s post-election meeting (06-07 November). We’ll be updating our inflation table for next week’s piece.
Meanwhile, creativity abounds in the headlines. Try this CNBS (truth be told) from yesterday: “In this time of uncertainty, markets seem to rely on logic.” Folks, you cannot make this stuff up, (except, they’re doing their best to so do). If markets were relying on logic, today’s S&P 500 (5808) given its ghastly P/E would be half that (2904), whilst Gold (2761) would be ’round its Scoreboard valuation (3736). True, the markets are never wrong, but misvalued opportunities abound! Especially for the precious metals all ’round!

Cheers!
…m…
www.TheGoldUpdate.com
www.deMeadville.com
and now on “X”: @deMeadvillePro
25 October 2024 – 08:03 Central Euro Time
At present, we’ve the Bond above its Neutral Zone for today, whilst below same are both Gold and Copper; BEGOS Markets’ volatility is again light. With the exception of Silver, EDTRs (see Market Ranges) have been falling for recent weeks across the BEGOS’ board; for example, specific to the Spoo, its EDTR for 08 August was at a 124-point peak: for today’s session ’tis set for 57 points. By its Market Profile, the Spoo’s most dominantly-traded handles across the past fortnight are right here at 5849, notable overhead resistors being 5863, 5886, 5897 and 5909; and in real-time, the Spoo by Market Values is +99 point above its smooth valuation line. The Econ Baro concludes its quiet week with metrics including September’s Durable Orders.
24 October 2024 – 08:01 Central Euro Time
Following a day wherein all eight BEGOS Markets finished in the red, today they all are at present in the black; currently above today’s Neutral Zones are the Bond, the Metals Triumvirate, and Oil; session volatility is light. Going ’round the Market Values horn (in real-time) for the five primary BEGOS components: the Bond vis-à-vis its smooth valuation line shows as nearly -7 points “low”, the Euro as -0.035 points “low”, Gold as +101 points “high”, Oil as fairly in line (as has been its case for almost two weeks), and the Spoo as +104 points “high” even accounting for yesterday’s selling; too, the S&P 500 itself (-0.9% yesterday) remains “textbook overbought” through a 10th day. Incoming metrics due for the Econ Baro include September’s New Home Sales.
23 October 2024 – 08:04 Central Euro Time
We’ve both the Bond and Swiss Franc at present below their respective Neutral Zones for today; the balance of the BEGOS Markets are within same, and volatility is pushing toward moderate. Gold for now a fifth-consecutive session has recorded an All-Time High, this latest thus far today being 2767; too, Silver has achieved the 35 handle for the first time since 05 October 2012; the Gold/Silver ratio is currently 79.3x, meaning Silver remains historically quite cheap relative to Gold, itself — despite new highs — still very cheap given Dollar debasement. As for Market Rhythms for pure swing consistency, on a 10-test basis for the best we’ve the non-BEGOS Yen’s 2hr Parabolics and for the Bond both its 12hr Parabolics and 2hr Moneyflow; on the 24-test basis, the non-BEGOS Yen’s daily Price Oscillator still tops the list. The Econ Baro looks to September’s Existing Home Sales; the later in the session comes the Fed’s Tan Tome for October.
22 October 2024 – 08:14 Central Euro Time
The Bond continues to work lower as yields rise, price at present below today’s Neutral Zone as is the Spoo; above same are both Gold and Silver, and BEGOS Markets’ volatility again is light. The Bond’s “Baby Blues” (see Market Trends) have not yet eclipsed above their -80% axis as the selling continues. Looking at correlations amongst the five primary BEGOS components, the best is currently negative between the Bond and Oil. The S&P 500 completed its eighth consecutive session as “textbook overbought”; the Index’s MoneyFlow, whilst coming back into line near-term, still on a quarterly basis shows the S&P as some +250 points “too high”; the futs-adj’d “live” P/E is now 44.0x, thus no substantive improvement in bottom lines relative to price as Q3 Earnings Season continues, now into its third week of six. The yield on the S&P is 1.255% vs. 4.518% annualized on risk-free U.S. three-month dough.
21 October 2024 – 08:21 Central Euro Time
At present we’ve the Euro below its Neutral Zone for today, whilst above same are Silver and Copper; BEGOS Markets’ volatility is light. Gold thus far has made a marginal All-Time High at 2748; The Gold Update cites price’s having risen even as — unusually — have the levels of the Dollar Index, yields, S&P 500, as well as the equivalent rate of the FedFundsFutures; regardless, we remain wary of Gold (by Market Values) being +110 points (in real-time) above its smooth valuation to which price inevitably reverts. ‘Tis a fairly light week for incoming Econ Baro metrics, today bringing September’s Leading (i.e. “lagging”) Indicators. Q3 Earnings Season enters its third week of six scheduled: thus far for the S&P 500: 82% have beaten estimates, but only 64% have improved over Q3 a year ago.