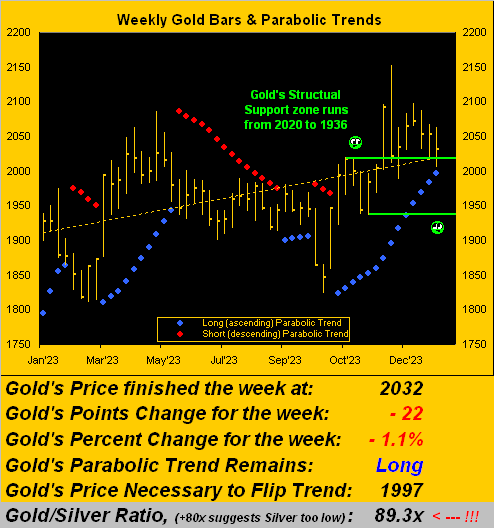
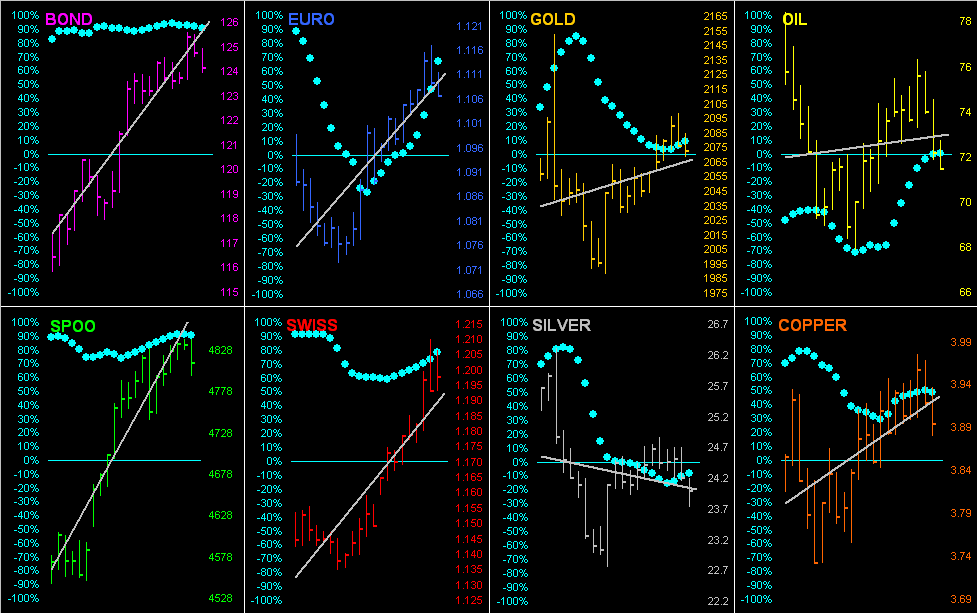
Strength in the Spoo at the moment would have the “live” P/E of the S&P leap to 50.4x at the open, (after settling last week at 49.7x): more on the S&P’s dangerous overvaluation in the current edition of The Gold Update, which also sees near-term weakness for the precious metals. Both Gold and Silver are at present below today’s Neutral Zones. BEGOS Markets’ volatility is pushing toward moderate, and Silver itself has already traced 102% of its EDTR (see Market Ranges). Currently priced 2023, we’ve marked Gold’s underlying support structure as 2020-1936. The record-setting Spoo’s 21-linreg has rotated from negative to positive (see Market Trends). The Econ Baro starts its week with December’s Leading (i.e. “lagging”) indicators.
 Mark
Mark
The Gold Update: No. 740 – (20 January 2024) – “Gold from Time Biding to Price Sliding”
“Worst start to Earnings Season in memory, mmb?“
Across our 14 years of recording earnings, Squire, we’ve never seen a start worse than this. Rightly however, as we “tweeted” (@deMeadvillePro) this past Thursday: “This may be statistically insignificant as ’tis very, very early in Q4 Earnings Season.” And yet through the balance of the week, the poor trend continued. Specific to the S&P 500: 31 companies have thus far reported, of which just a scant nine (29%) bettered their bottom lines over Q4 of a year ago. In our records, that is worse than the S&P’s worst prior all-in quarter which registered only 36% having bettered for Q2 of COVID-plagued 2020.
And yet, the Casino 500 yesterday recorded its first all-time high (4842) since that on 04 January 2022 (4819). To again reprise the late, great Vince Lombardi: “What da hell’s goin’ on out dere?!?!?”
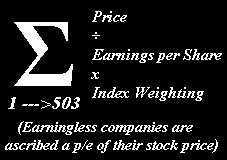
This really is becoming scary. One can be securely safe in U.S. Treasuries at triple the yield of S&P 500. But maybe that’s not considered fun. Surely it shan’t be fun should the stock market shut because the money doesn’t exist to fund folks’ stock sales. Today, obviously teaching Personal Finance at the undergraduate level is a waste of time. Remember our herein quoting Jerome B. Cohen: “In a bear market many stocks will sell at 5 to 7 times earnings, while in bull markets the average level would be about 15 to 18 times earnings.” As penned on the above Econ Baro, the “live” price/earnings ratio right now for the Casino 500 is 49.7x. If you don’t believe it, do something your broker can’t do … the math:
As for having to pass Portfolio Theory at the graduate level, forget about it: ’tis no longer needed given earnings no longer have meaning.
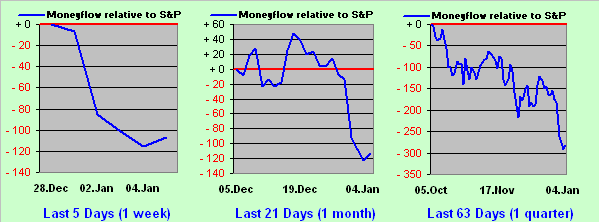
But wait, there’s more. Shame on you if not following the website’s S&P MoneyFlow page. And WOW did it whirl ’round this past week to upside. Here’s the problem: decade-to-date (the S&P’s closing span being from 3701 to now 4840) the average amount of money requisite to move the S&P up or down one point is $1,100,278 … as of yesterday the actual amount is a thin $540,068. That essentially means this “record-setting rally” is frothy and built on a lot of small trading block BS (can we print that, Mr. Editor?)
The point is: if you’re wedded to stocks, be wary to withstand having a hellova haircut. ‘Tis coming and ’twill be comprehensively butt-ugly. Or as we’ve on occasion quipped: “Market-to-market, everybody’s a millionaire; market-to-reality, they ain’t worth squat.” Write it down.
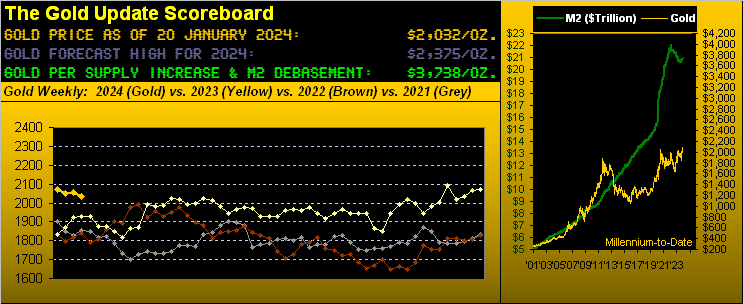
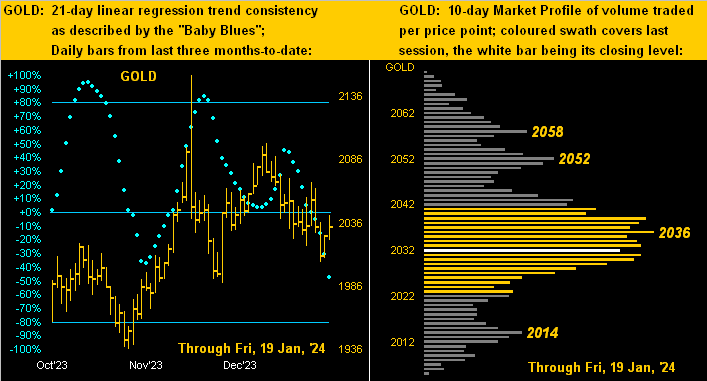
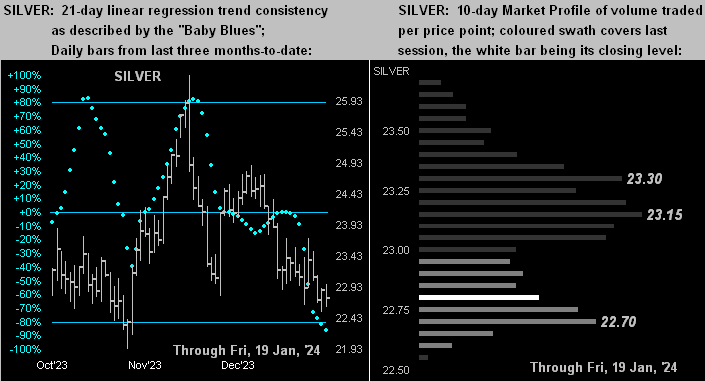
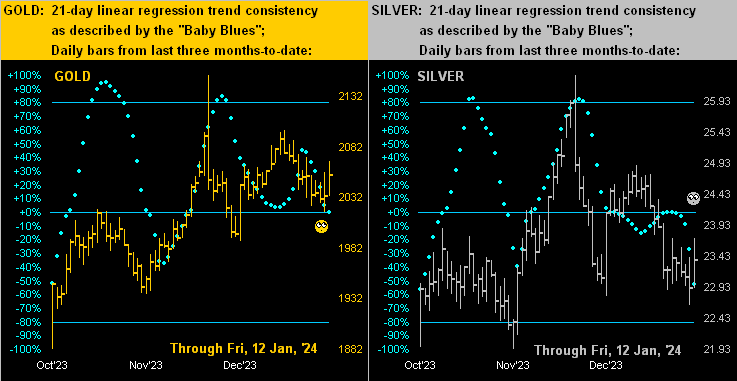
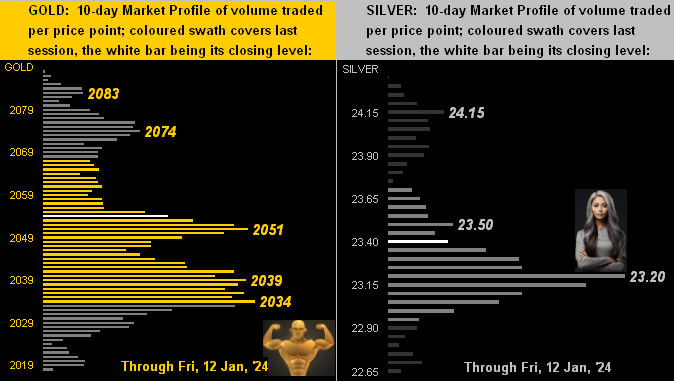
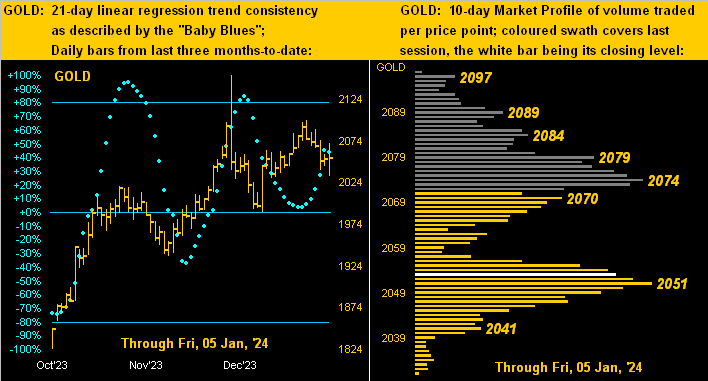
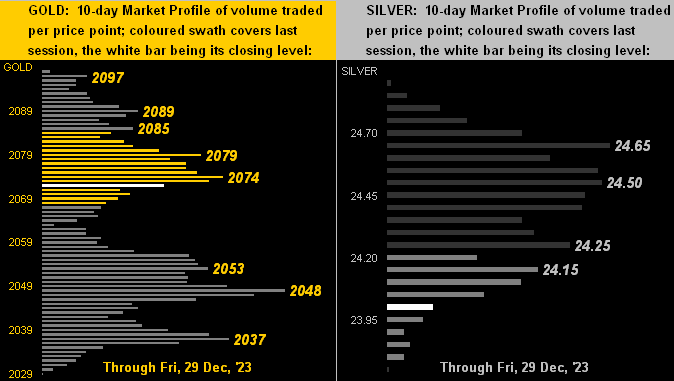
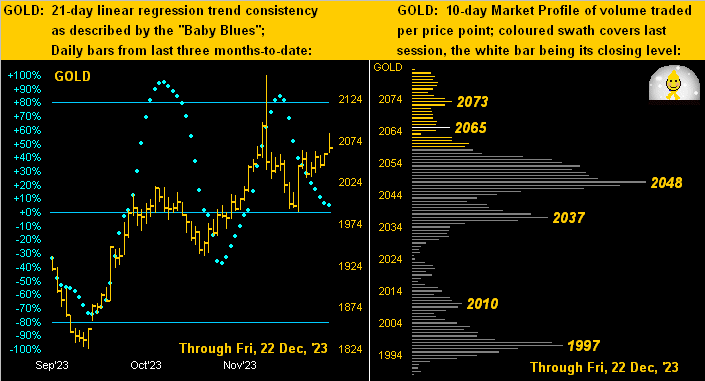
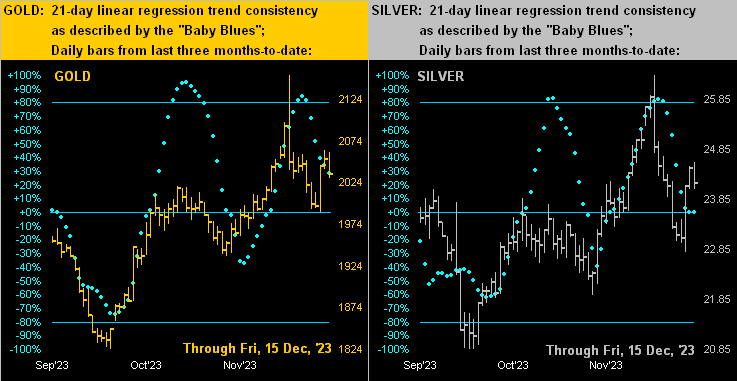
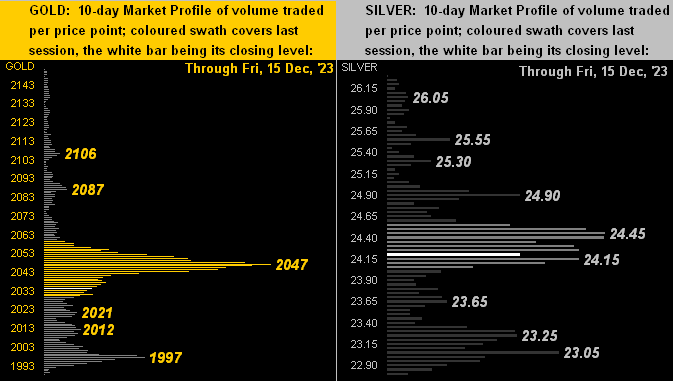
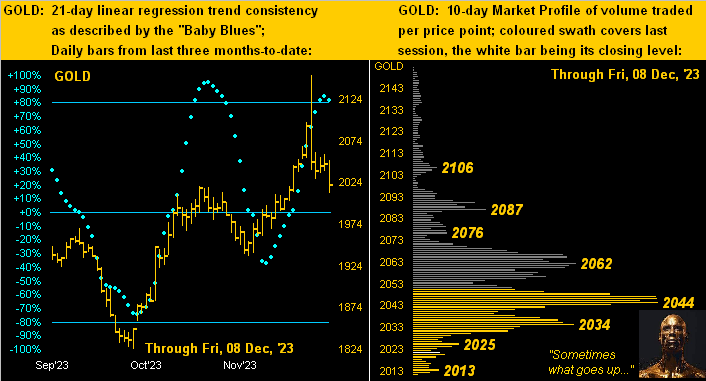
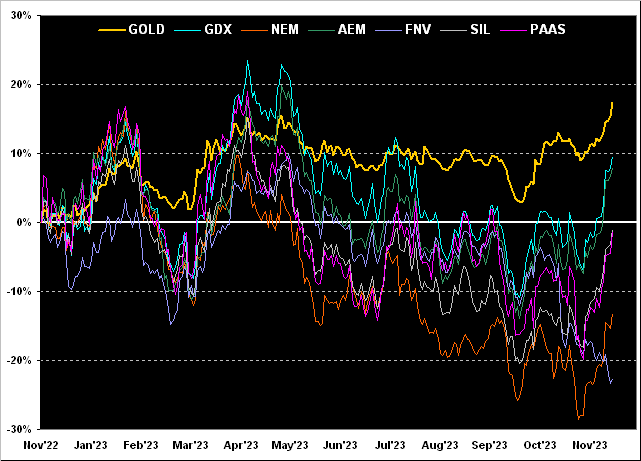
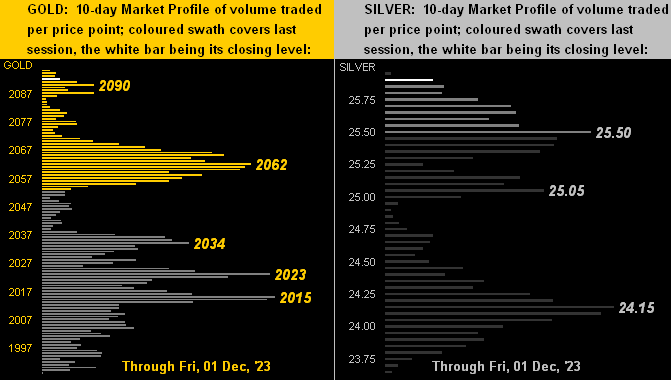
Meanwhile as cited, Gold’s price continues to be written down of late. In our two-panel graphic at left the old adage of “Follow the blues instead of the news, else lose your shoes” is in full cavort (but best not to go Short). Then at right, Gold’s 10-day Market Profile finds price rather clinging to the final bulge of support:
Before our final quip to close, let’s see what the Gold stack shows:
The Gold Stack
Gold’s Value per Dollar Debasement, (from our opening “Scoreboard”): 3738
Gold’s All-Time Intra-Day High: 2152 (04 December 2023)
Gold’s All-Time Closing High: 2092 (01 December 2023)
The 2000’s Triple-Top: 2089 (07 Aug ’20); 2079 (08 Mar ’22); 2085 (04 May ’23)
2024’s High: 2088 (02 January)
10-Session “volume-weighted” average price magnet: 2037
Trading Resistance: 2036 / 2052 / 2058
Gold Currently: 2032, (expected daily trading range [“EDTR”]: 26 points)
Trading Support: 2014
10-Session directional range: down to 2005 (from 2071) = -66 points or -3.2%
2024’s Low: 2005 (17 January)
The Weekly Parabolic Price to flip Short: 1997
The 300-Day Moving Average: 1937 and rising
The Gateway to 2000: 1900+
The Final Frontier: 1800-1900
The Northern Front: 1800-1750
On Maneuvers: 1750-1579
The Floor: 1579-1466
Le Sous-sol: Sub-1466
The Support Shelf: 1454-1434
Base Camp: 1377
The 1360s Double-Top: 1369 in Apr ’18 preceded by 1362 in Sep ’17
Neverland: The Whiny 1290s
The Box: 1280-1240
Indeed to close, let’s go to the Swiss snows at the WEF (World Elites’ Forum) wherein the “It Doesn’t Apply to Us Dept.” was in full folly, (as you may well have already heard). The “emphasis” of this year’s Davos boondoggle being “Climate Change” and “AI”, one John Forbes Kerry — THE U.S. Special Presidential Envoy for Climate (his having previously been both U.S. Secretary of State and U.S. Senator from The Commonwealth of Massachusetts, as well as having served in Viet Nam) — was media-queried in reference to the 1,000+ private jets having carbonized their way to either Zurich or St. Gallen-Altenrhein. The response: “That’s a stupid question”.
Which leads one to wonder what a Davos plat du jour was this year …
Avoid stoopid. Acquire Gold!
Cheers!
…m…
www.TheGoldUpdate.com
www.deMeadville.com
and now on “X”: @deMeadvillePro
19 January 2024 – 09:19 Central Euro Time
As was the case yesterday at this time, all eight BEGOS Markets are presently within their respective Neutral Zones for today, and volatility thus again is quiet. The amount of money it takes to move the S&P 500 one point is literally but half was it was just back in November, a “warning sign” as to just how frothy the S&P has become; too, with the “live” P/E at 48.5x, the Index remains on very unsteady footing. That noted, the S&P’s MoneyFlow has been on the upside go notably these last two trading days. The Econ Baro concludes its week with January’s UofM Sentiment Survey and December’s Existing Home Sales.
18 January 2024 – 09:16 Central Euro Time
The BEGOS Markets are at present quiet with all eight components inside today’s Neutral Zones; volatility is light. At Market Trends, the Spoo’s 21-day linreg has rotated to negative leaving just the Swiss Franc still (barely) in a positive stance. By Market Rhythms, our most consistent study on a 10-test swing basis is Copper’s 30mn Parabolics, whilst on a 24-test swing basis ’tis the Euro’s 4hr Parabolics. Per Market Values, the most extreme appearance by deviation from its smooth valuation line is Gold which shows (in real-time) as -50 points “low”. The Econ Baro’s incoming metrics for today include January’s Philly Fed Index and December’s Housing Starts/Permits.
17 January 2024 – 09:12 Central Euro Time
Whilst yesterday’s S&P Moneyflow was actually positive (+0.9%), the Index itself fell -0.4%, but by our broadest measure (quarterly) the Flow still is suggestive of lower Index levels. Earnings Season is off to a poor start; however with just 30 companies having reported (of some 2,000 expected), this may not yet be statistically significant: 80% having beaten estimates … but just 40% have improved their bottom lines over Q4 a year ago. At present, Silver, Copper and the Spoo are below their respective Neutral Zones for today; none of the other BEGOS Markets are above same, and volatility is pushing toward moderate. Cac volume for Oil is moving from February into March. And ’tis a big day for the Econ Baro with January’s NAHB Housing Index, December’s Retail Sales, Ex/Im Prices, and IndProd/CapUtil, plus November’s Business Inventories. Too, we receive the Fed’s Tan Tome for January.
16 January 2024 – 09:16 Central Euro Time
Into the second day of the BEGOS Markets’ two-day session we’ve now the Bond, EuroCurrencies and Spoo all to the weak side; Copper is the sole component at present above its Neutral zone. Volatility is moderate-to-robust given it being a double-session, the Swiss Franc leading the ranginess with a 109% tracing of its EDTR (see Market Ranges). Quietest of the bunch is Gold, thus far with just a 51% tracing: again per the current edition of The Gold Update, the yellow metal is biding its time within a broader rising price environment. At Market Trends the following are now sporting negative 21-day linregs: the Bond, Gold, Silver, Copper and Oil, and it remains that the “Baby Blues” of trend consistency are all in descent. The Econ Baro’s week begins with January’s NY Empire State Index.
15 January 2024 – 09:15 Central Euro Time
Given the StateSide holiday, the BEGOS Markets are into a two-day session (for Tuesday settlement). At present we’ve the Bond below its Neutral Zone for the session, and Copper above same; volatility is expectedly light. The Gold Update cites the December dichotomy between an inflationary CPI and a deflationary PPI, and that Gold on balance is biding its time these days, its broader measures of trend still quite positive. Q4 Earnings Season for 2023 is in the banks’ results phase: of the six having reported this past Friday, four bottom lines were worse than for Q4 of 2022. Still, the S&P 500 remains near its 4819 all-time high, the futs-adj’d opening at this instant for tomorrow being 4787, and the “live” P/E thus 46.6x. The “all-to-risk” S&P now yields 1.465% and the “risk-free” 3-month T-Bill an annualized 5.198%. The Econ Baro awaits a week with 15 incoming metrics.
The Gold Update: No. 739 – (13 January 2024) – “Gold Biding Time; Bitcoin Prime Time”

“And now for something completely different” –[Monty Python, ’71]. Rarely do we bring up bits**t…
“Now, now, mmb…”
…yes, Squire, ok, “Bitcoin”. But it did take prime time billing this past week in anticipated –and in turn — approval of 11 exchange-traded funds now tradable (including from some high-level names such as Franklin Templeton, Blackrock, and Fidelity). And whereas with both Gold and the Casino 500 we’ve mathematical extremes vis-à-vis price and valuation (the former priced way too low and the latter way too high), with Bitcoin price is valuation given ’tis something based on nothing beyond a fixed supply. Reprise: “The market is never wrong”; ’tis where the traders have placed Bitcoin: thus ’tis priced right at valuation, pure and simple. Through transactional growth should Bitcoin gain further acceptance toward supplementing worthless fiat currencies, the price ought materially rise ![]() “as time goes by…”
“as time goes by…”![]() –[Herman Hupfeld ’31].
–[Herman Hupfeld ’31].
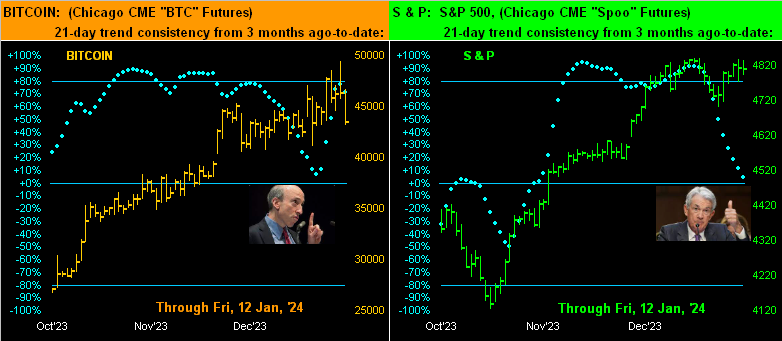
Either way, we decided to take a peek at “The Now” for Bitcoin. Since the SEC’s cautionary “Gensler Granting” of the ETFs this past Thursday, Wall Street treated Bitcoin as essentially it does “all things” anticipated: the rumour having been bought, the news then was sold. ‘Tis depicted here (at left) across the past three months-to-date, the rightmost two days evident of the peak (futs 49,435) and subsequent sell (futs now 43,425). The “Baby Blues” nicely captured the consistency of the recent run up before pipping down on Friday. For the present, the strength of the broader trend across the panel is encouraging, however there’s that unfilled gap from 04 December (39,640 to 40,325); still, because Bitcoin spot trades ’round the clock, such unfilled gap may be mere talk. But not so much mere talk are the S&P futures (at right), the “Baby Blues” therein extending their descent. “Got stock?” Sorry to hear that:
Thus there we are for this week as Gold bided its time whilst Bitcoin saw prime time … at least for a bit. Directionally near-term for Bitcoin, we’re clueless. Broadly for Gold we’ve no concerns. But for the Casino 500, we’re worried the whole roulette wheel could fly right off the spindle (given we do the earnings — or lack thereof — math). Regardless with respect to the latter, the children’s writing pool over at the once-mighty Barron’s ran this past week with “Why S&P 500 Pain Could Turn to Gains”. What pain? There’s been no S&P pain since the January-October “owie” back in 2022. Which in turn (save for the brief COVID crash and dash) pales in comparison to the last real pain from the 2007-2009 FinCrisis. But through generational turnover in today’s “stocks never go down” bubblesphere, this is to where we’ve arrived. And when the fear sets in that upon selling one’s stock, one might not actually receive the proceeds, the stock market rather than crashing might instead simply shutdown … just a passing thought.
GOT GOLD???

Cheers!
…m…
www.TheGoldUpdate.com
www.deMeadville.com
and now on “X”: @deMeadvillePro
12 January 2024 – 09:20 Central Euro Time
The Metals Triumvirate and Oil are the BEGOS Markets’ winners at present; the other components are within today’s Neutral Zones, and volatility is again mostly light. Last Saturday’s (and still current) edition of The Gold Update introduced the notion that inflation may not be cooling, and we saw evidence of that in yesterday’s CPI data for December; today the Econ Baro looks to the wholesale level of inflation via December’s PPI. Gold (presently 2043) has thus far seen the session’s low at 2034 which is the most dominantly-traded Market Profile price across the past two weeks. Q4 earnings ought get more notice through these next several trading days as financial institutions’ results begin to arrive, (see too the website’s Earnings Season page for the overall picture).
11 January 2024 – 09:09 Central Euro Time
Early on we’ve strength in the Bond, the Metals Triumvirate and the Spoo; none of the other BEGOS Markets are below their Neutral Zone, and volatility is mostly light. At Market Trends, Copper’s linreg has rotated to negative, joining Silver also in that stance; however as noted yesterday, the “Baby Blues” of trend consistency are falling for all eight components. Our best Market Rhythm by swing results (on a 10-test basis) currently is Gold’s 8hr MACD and (on a 24-test basis) the Euro’s 4hr Parabolics. Included in today’s metrics for the Econ Baro are December’s CPI along with the (occasionally elusive) Treasury Deficit.
10 January 2024 – 09:15 Central Euro Time
The BEGOS Markets are at present quiet, all eight components within their respective Neutral Zones for today; volatility is light across the board. The Swiss Franc per our Market Trends page confirmed its “Baby Blues” of trend consistency having fallen below the key +80%, suggestive of lower prices near-term; currently, our favoured Market Rhythm for the Swiss Franc is its 4hr MoneyFlow. Yesterday the S&P got a bit of a MoneyFlow boost; however the tide of the Spoo continues to weaken as its 21-day linreg trend continues to rotate toward turning negative, (again see Market Trends). November’s Wholesale Inventories come due for the Econ Baro.
09 January 2024 – 09:10 Central Euro Time
The precious metals are rebounding this morning, both Gold and Silver at present above today’s Neutral Zones; the other BEGOS Markets are within same, and volatility is mostly light, save for the precious metals having already traced in excess of 50% of their EDTRs (see Market Ranges). At Market Values, all five primary BEGOS components are fairly near their respective smooth valuation lines. Meanwhile at Market Trends, it remains that all the markets are in linreg uptrends save for Silver: however in all eight cases, their “Baby Blues” are in decline, exemplary of the uptrends losing their consistency. For the Econ Baro we’ve November’s Trade Deficit; and Q4 Earnings Season is underway which you can track here at the website.
08 January 2024 – 09:25 Central Euro Time
The precious metals and Oil are weak this morning; BEGOS Markets volatility is pushing toward moderate as the year’s first full trading week begins. The Gold Update is somewhat wary of the early-year inflation trading push out of the Bond and into the Dollar, Gold in turn getting the “conventional wisdom” sell. For the S&P 500, the MoneyFlow page is decidedly negative such that lower Index levels ought be in the offing; specific to the Spoo, its “Baby Blues” (see Market Trends) are (in real-time) accelerating their fall, and by Market Values the Spoo looks to a negative crossing below its smooth valuation line, barring a firm rally this week: confirmation of such crossing would, too, suggest lower price levels. Late in the session for the Econ Baro we’ve November’s Consumer Credit.
The Gold Update: No. 738 – (06 January 2024) – “Gold Stumbles into New Year as the Dollar Gets into Gear”

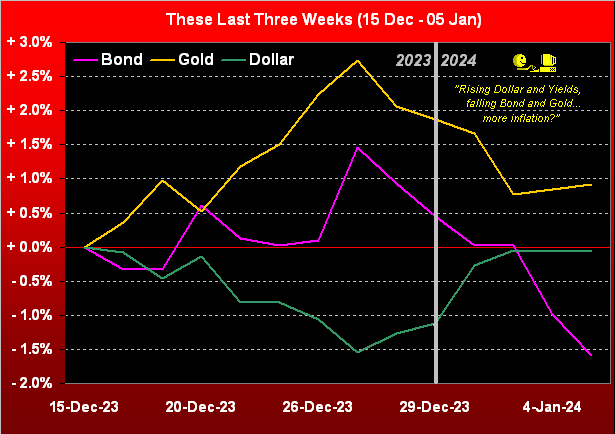
Hardly is renewed inflation a firm forecast. Yet curiously, the Buck and the Bond appear early on as inflation anticipative; and as is our wont to say: “…the market is never wrong…”
“But as you also always say, mmb, it can be really misvalued…”
True enough, Squire, the two most glaring examples (per our honestly performed math) being the S&P 500 priced +76% above earnings valuation and Gold priced -45% below debasement valuation. As for ![]() “How long has this been going on…”
“How long has this been going on…”![]() –[Ace, ’74], the S&P’s valuation above mean and Gold’s valuation below same extend back a good dozen years. “…tick tick tick goes the means reversion clock…”
–[Ace, ’74], the S&P’s valuation above mean and Gold’s valuation below same extend back a good dozen years. “…tick tick tick goes the means reversion clock…”
But as to inflation anticipation: between now and the Fed’s end-of-January confab, StateSide there’re four key incoming data sets on inflation: the Consumer Price Index, Producer Price Index, Export/Import Prices, and the “Fed-favoured” Personal Consumption Expenditures Index. And on this side of the Pond as the year begins, we’re weathering an +8% increase in the cost of our morning café crème/croissant … ouch!
Why? Because “the club” (oh yes) says ’tis responding to price increases in what it now pays per kilo of coffee. So we decided to check: and ICE Coffee futures for March delivery have increased in the last few months by as much as +41% (10 October low to 19 December high). However, the good news for you caffeine heads out there is Dow Jones Newswires having run yesterday (Friday) with “Eurozone Inflation Rose Less Than Expected, Keeping Rate-Cut Talk on Track” in turn easing our inflative coffee cost concerns … whew!
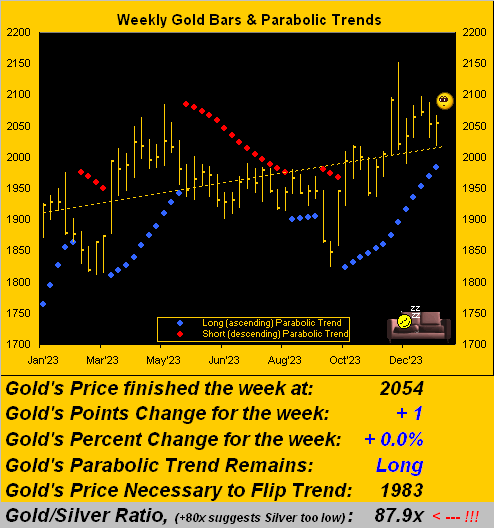
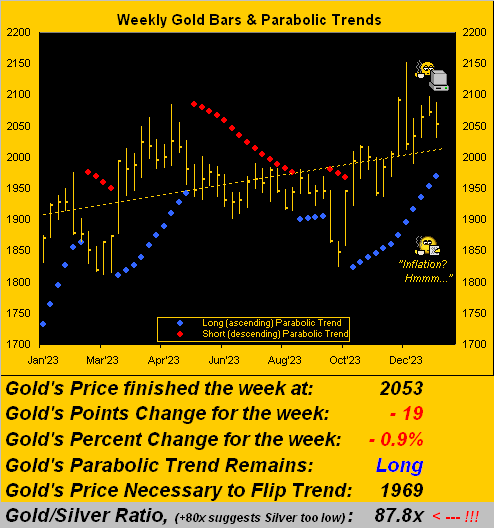
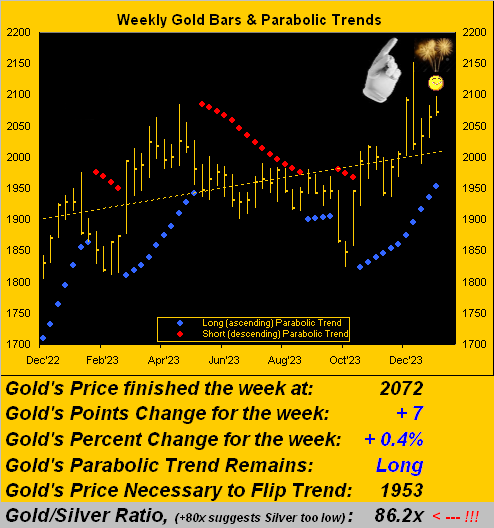
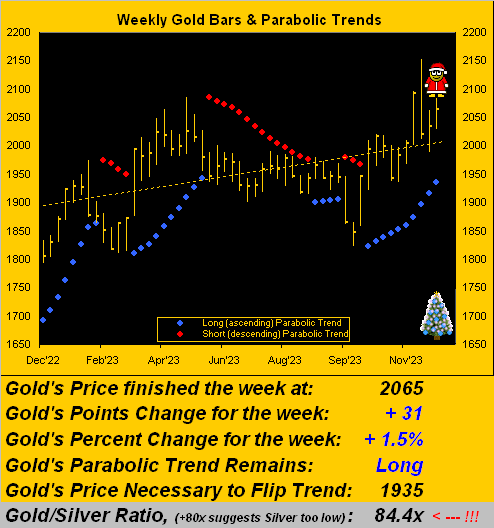
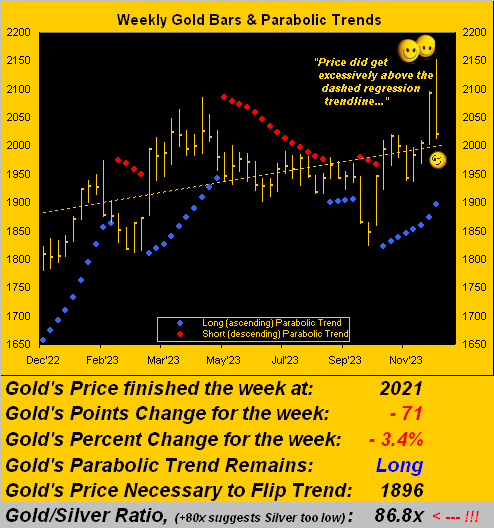
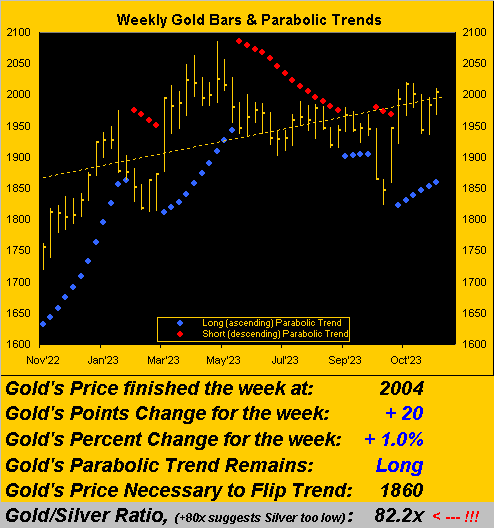
But as this is not “The Coffee Update”, let’s get on to Gold, which indeed has stumbled thus far into New Year, price having sported its first down week since that ending 08 December in settling yesterday at 2053, albeit a still comfy +84 points above the parabolic trend’s flip-to-Short level at 1969. And at the foot of this weekly bars graphic we’ve the Gold/Silver ratio now 87.8x, its highest end-of-week level since that ending last 10 March, (the century-to-date average but 67.9x):
We opened in musing on inflation: reporting thereto ranks significant in the first full trading week of 2024 with December’s CPI due Thursday (11 January) followed by the PPI on Friday (12 January). Shall such metrics renew the inflation scare? Or instead remain benign over which we’ve nothing to care? As a great friend and financial colleague remarked over this morning’s inflated coffee: “This is not going to be an easy year.” Indeed with valuations so out of whack, it may not be an easy several years. “Well, ya gotta buy the dip”, they say. Ok, you go first, Conway. We’ll hedge with Gold for the Long way!
Cheers!
…m…
www.TheGoldUpdate.com
www.deMeadville.com
and now on Twitter(“X”): @deMeadvillePro
05 January 2024 – 09:23 Central Euro Time
We’ve weakness this morning in the Bond and EuroCurrencies; the other BEGOS Markets are at present within today’s Neutral Zones, and volatility is again light. As did the Spoo on Wednesday, the Bond has now confirmed its “Baby Blues” (see Market Trends) having crossed below their key +80% axis: currently priced at 122^15, we can see a near-term run down into the 120 handle. The leading MoneyFlow for the S&P 500 continues to deteriorate more swiftly than the downside change in the Index itself, even as the “textbook overbought” condition concluded with a 39-trading-day streak. And for the Econ Baro, ’tis Payrolls day for December, along with the month’s ISM(Svc) Index, plus November’s Factory Orders.
04 January 2024 – 09:09 Central Euro Time
The BEGOS Markets are quiet, at present all eight components within their respective Neutral Zones for today; obviously, volatility is light. Despite the S&P 500 having recorded two down days to commence the year, it nonetheless is entering what would be a 40th consecutive trading day as “textbook overbought”: having settled yesterday at 4704, an up session today would likely maintain that condition, else a down day would finally nix it. Too for the Spoo, its “Baby Blues” (see Market Trends) confirmed settling below their +80% axis yesterday, suggestive of still lower price levels ahead: whilst this is a highly reliable leading near-term indicator, the prior such occurrence failed to produce anything materially to the downside. Today’s Econ Baro metrics include December’s ADP Employment data.
03 January 2024 – 09:02 Central Euro Time
At present we’ve weakness in the Bond and Copper, and strength in the Euro; BEGOS Markets volatility is light. As tweeted [@deMeadvillePro], whilst the S&P dropped -0.6% to start the year, the MoneyFlow regressed into S&P points fell -2.1%: as this is a leading indicator, we look to still lower S&P levels near-term, especially as the Index itself is now 38 consecutive trading days “textbook overbought”. Debt yields and the Dollar rose in beginning 2024, counter to FinMedia expectations of their “Fed pivot”. The Econ Baro awaits December’s ISM(Mfg) Index; too, we’ve the FOMC Minutes from the 12-13 December meeting.
02 January 2024 – 09:14 Central Euro Time
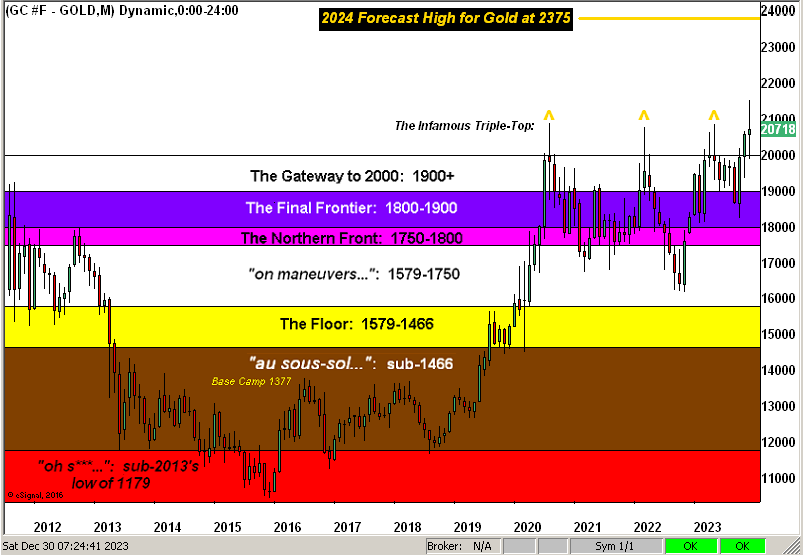
Early on the New Year we’ve weakness in the Bond and EuroCurrencies, and strength in Gold, Silver, Oil and the Spoo. The Gold Update targets a “conservative” high in 2024 for 2375 as detailed in the write-up. The S&P 500’s “textbook overbought” condition ranks in the 97th percentile of all such conditions across the past 44 years, the “live” P/E settling 2023 at 46.3x, an 82% increase from its inception a dozen years ago, purely reflective of earnings not keeping pace with price. In real-time, the Spoo is 193 points above its smooth valuation line (see Market Values). The Econ Baro kicks off the year with 10 incoming metrics this week, including due today November’s Construction Spending.,
The Gold Update: No. 737 – (30 December 2023) – “Gold – We Conservatively Forecast 2375 for 2024’s High”


In transiting through New Year, one wonders how much longer the S&P 500 can withstand trading at nearly double its earnings valuation and Gold at nearly half of its currency debasement valuation. Ours indeed is to reason why — to seek reversion — for at some point it shall be nigh. And historically, ’tis always arrived.
But now for the present, ’tis time to imbibe! Thus from the entire deMeadville crew, a most Golden New Year to All of You!

Santé !
…m…
www.TheGoldUpdate.com
www.deMeadville.com
and now on Twitter(“X”): @deMeadvillePro
29 December 2023 – 09:17 Central Euro Time
Early on in the year’s final session we’ve at present the Swiss Franc, Gold and Copper above their respective Neutral Zones for today, whilst Silver is below same; volatility for the BEGOS Markets is light, with only the Swiss Franc having thus far exceeded 50% (now 56%) of its EDTR (see Market Ranges). By Market Trends, the “Baby Blues” for both the Bond and Spoo remain fairly glued to the ceiling. The S&P 500 (4783) is a day’s range from an all-time high (4819): despite the FinMedia rooting for such high, the Index obviously continues its fundamental trek as extremely overvalued by earnings (the “live” P/E now 46.7x), and the technical track is now 36 days (“textbook overbought”). The Econ Baro concludes its year with December’s Chi PMI. Gold appears firm in the upper 2000 handle: tomorrow’s 737th edition of The Gold Update gives our forecast high price for next year. Indeed: Happy New Year!
28 December 2023 – 09:41 Central Euro Time
The EuroCurrencies and Gold are at present above today’s Neutral Zones, whilst the Bond is below same; BEGOS Markets volatility is mostly light. The Swiss Franc is trading above 1.20 for the first time (save for its brief Euro-decoupling spike in January of 2015) since September of 2011. Gold is again teasing the 2100 level, the session high to this point being 2098: by Market Rhythms on a 10-test basis, various Gold studies populate the top of the consistency stack, notably for the 4hr, 6hr, 8hr and 12hr timeframes; and by Market Values, Gold (in real-time) is +51 points above its smooth valuation line. For the week’s light Econ Baro calendar, today’s metrics include Pending Home Sales for November.
27 December 2023 – 09:23 Central Euro Time
Both the Bond and Copper are at present above today’s Neutral Zones; the other BEGOS Markets all are within same, and volatility is again light. The S&P 500 is -44 points below its 4819 all-time high; the EDTR (see Market Ranges) for the Spoo is coincidentally 44 points; (for the S&P itself ’tis 38 points); the S&P is entering its 35th consecutive “textbook overbought” trading session, and the Spoo (in real-time) is +256 points above its smooth valuation line; (extreme too is the Bond now better than +7 points above same). The “live” P/E of the S&P is 46.3x and the yield 1.468% vs. 5.203% for three-month U.S. dough. By Market Trends, both Silver and Oil remain the only two components in 21-day linreg downtrends, albeit the latter’s “Baby Blues” are swiftly rising. Again the Econ Baro remains quiet until tomorrow.
26 December 2023 – 09:17 Central Euro Time
Into the shortened trading week we go with Gold at present above its Neutral Zone, as too are Silver, Copper and the Spoo; the balance of the BEGOS Markets are within same, and volatility is light. The Gold Update details an historically-based case for Gold to reach 2500 in the ensuing year. The S&P 500 looks to open higher toward entering its 34th consecutive trading day as “textbook oversold”; the “live” P/E adjusted to the futures is presently 45.7x. For tracking the Spoo, currently our best market rhythm for consistency (10-test basis) is the 8hr Moneyflow and (on a 24-test basis) the 15mn Parabolics. The Econ Baro has just three incoming metrics for this week, none due until Thursday.
The Gold Update: No. 736 – (23 December 2023) – “A Great Gift for Gold as It Climbs into Christmas”
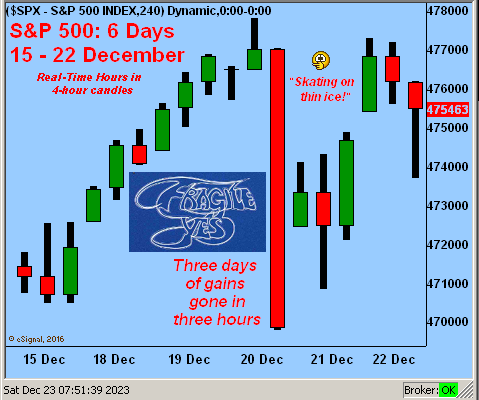
And therein note ole St. Nick pointing down at the top of the S&P. We’ve documented beyond ad nauseam the bazillion reasons for a major S&P correction, (e.g. “Stocks Suicide Mission” from just a week ago). Further, we witnessed on Wednesday (as tweeted @deMeadvillePro) a microcosm of how swiftly it can go. From Friday (15 December) into Wednesday (20 December) the S&P 500 garnered three successive days of “higher highs” … then late-session Wednesday, those three days of gains were gone in just three hours. Deeper into the numbers: the pace at which stocks hit downside bids was nine times the pace they’d previously been hitting upside offers. That is a fear-filled, comparatively monstrous downside pace. True, it didn’t last long, and the S&P then rather messily tried to recover to close its week. But it shows us just how thin is the ice on which the S&P is now skating. Or to cue the popular Yes album from back in ’71: ![]() “Fragile”
“Fragile”![]() Oh yes, indeed:
Oh yes, indeed:
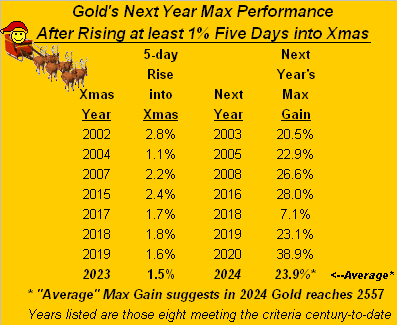
Thus there we are with but four trading days remaining in 2023. And as entitled, Gold’s pre-Chirstmas five-day gain at least by historical comparison is a great gift for the yellow metal going into next year. ‘Course, next week we’ll be here with our wrap for the year and as to how 2024 may well appear.
So with a tip of the cap to our IT crew for voluntarily creating this lovely card from us…

…as they say ’round these parts: “Joyeux Noël !” And give the gift of Gold!
Cheers!
…m…
www.TheGoldUpdate.com
www.deMeadville.com
and now on Twitter(“X”): @deMeadvillePro
22 December 2023 – 09:57 Central Euro Time
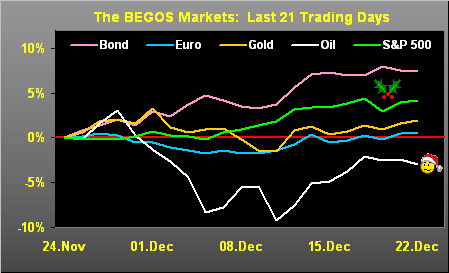
Oil is the only BEGOS Market at present outside (above) its Neutral Zone for today; session volatility is light. By Market Trends, six of the eight components are in 21-day linreg uptrends components, (the two downtrends being for Silver and Oil). Per Market Rhythms, our most consistent on a 10-test is Gold’s 8hr MACD whilst on a 24-test basis ’tis the Yen’s (not yet a BEGOS Market) 2hr MACD. The Econ Baro concludes its busy week with November’s Personal Income/Spending, “Fed-favoured” Core PCE, Durable Orders, New Homes Sales, and revision to December’s UofM Sentiment Survery. Merry Christmas to everyone everywhere!
21 December 2023 – 18:04 Central Euro Time
Apologies, we just noted that this morning’s post obviously didn’t “make the trip”. The thrust therein was the S&P 500 yesterday giving up the prior three days’ gains in just three hours. The Index is trying to firm today, but is coming off as we type. Still, save for the Bond and Oil, the balance of the other six BEGOS Markets are higher today. The Econ Baro took a dip today on weakness in Jobless claims, Q3 GDP revision, Philly Fed and Leading Indicataors.
20 December 2023 – 09:10 Central Euro Time
Both the Bond and Copper are at present above today’s Neutral Zones; below same is the Euro, and volatility is quite light, the largest EDTR (see Market Ranges) to this point being that of the Euro at 48%. Going ’round the Market Values horn of the five primary BEGOS Markets (in real-time): the Bond is better than +8 points “high” above its smooth valuation line, the Euro less than +0.01 points “high”, Gold +38 points “high”, Oil -3.24 points “low”, and the Spoo +298 points “high”, the Index itself having recorded its 30th consecutive trading day as “textbook overbought”. For the Econ Baro we’ve December’s Consumer Confidence, November’s Existing Home Sales and Q3’s Current Account Deficit. –> We sadly learned yesterday of the passing of Bob “MeBob” Falk, a fine and well-known trading colleague over many years as far back as the 1990s at Avid Trader. He shall be missed, and we extend our sincere condolences to his entire family.
19 December 2023 – 09:38 Central Euro Time
At present we’ve the Bond, Euro and Copper above today’s Neutral Zones; the other BEGOS Markets are within same, and volatility remains light, (save for non-BEGOS Yen which already has traced 121% of its EDTR [see Market Ranges for the BEGOS components]). At Market Ranges we continue to watch for the Bond’s “Baby Blues” to let go to the downside: however, they’ve remained pasted to the ceiling for better than a full month as price continues to rise. The “live” P/E of the S&P 500 (fut’s-adj’d) is 45.8x and the Index’s “textbook oversold” condition now enters its 30th consecutive trading day. The Econ Baro looks to Novembers’ Housing Starts/Permits.
18 December 2023 – 08:59 Central Euro Time
Both the Euro and Spoo are at present above their respective Neutral Zones for today; the balance of the BEGOS Markets are within same, and volatility is again light. The Gold Update emphasizes the dangerously high level of the S&P 500 by a whole host of measures; whereas Gold itself whilst weathering some post All-Time-High pullback nonetheless remains in a more broadly bullish stance. At Market Rhythms, the most consistent on a 10-test basis is Gold’s 8hr MACD, and a 24-test basis the Yen’s (not yet an official BEGOS Market) 2hr MACD. The Econ Baro begins its busy week (17 incoming metrics!) with December’s NAHB Housing Index.
The Gold Update: No. 735 – (16 December 2023) – “Gold’s Upside Fruition; Stocks’ Suicide Mission”

Yes, ’tis The Gold Update, but we’re compelled (as occasionally is our wont) to start with stocks’ suicide mission, given Gold in upside fruition (albeit still vastly undervalued) is doing just fine, thank you very much.
What is with this stock market, eh? As a great friend (with a long stint at basically the very top of a household-name investment bank … but we’ll maintain anonymity in this case) here recently remarked: “The stupidest people on Wall Street are the pension fund managers.”
Ya think? Pros and rubes alike are throwing money like Pavlov’s drooling dogs on steroids into an S&P 500 index that is so beyond overvalued, further adjectives escape us. ‘Course as we’ve tweeted (@deMeadvillePro): mind the website’s S&P 500 MoneyFlow page to assess if the buying actually has substance.
Still, we hear that apps with names like “Robinhood” allow for incredibly easy stock market access such that everyone’s gonna keep on buying and thus stocks shall only go even higher. To us that sounds more like being “robbed in the hood” as when the selling starts, the compounding of such shall overwhelm anything Wall Street and the World have ever seen. Because as you regular readers know: “The money isn’t there.”
By the numbers:
- A dozen years ago in 2011, the market capitalization of the S&P 500 exceeded the U.S. liquid “M2” Money Supply by +29%; as of yesterday, that excess is +100%, the market cap now $41.3T versus an M2 of but $20.7T. (Wanna cause The Crash? Fax that last sentence over to CNBS for all the rubes watching their boob tubes).
- Per yesterday’s (Friday’s) S&P settle at 4719, ’tis precisely -100 points (or just -2.1%) below the all-time intraday high of 4819 set on 04 Janaury 2022; the current “expected daily trading range” for the S&P is now 34 points, meaning a new all-time high can be reached within 3 trading days, just in time for Christmas.
- The number of consecutive trading days the S&P has been “textbook overbought” (a 44-year concoction of John Bollinger’s Bands, along with Relative Strength and Stochastics) is now 28 which is in the 93rd percentile of all such overbought conditions since the year 1980.
- Present all-risk S&P 500 annualized dividend yield: 1.475%. Present no-risk U.S. 3-Month annualized T-Bill yield: 5.225%. (Why is this so hard to grasp?) “Because, mmb, T-Bills aren’t gonna double in price…” Just like stock’s can’t get halved, eh Squire? (‘Preciate the tee-up).
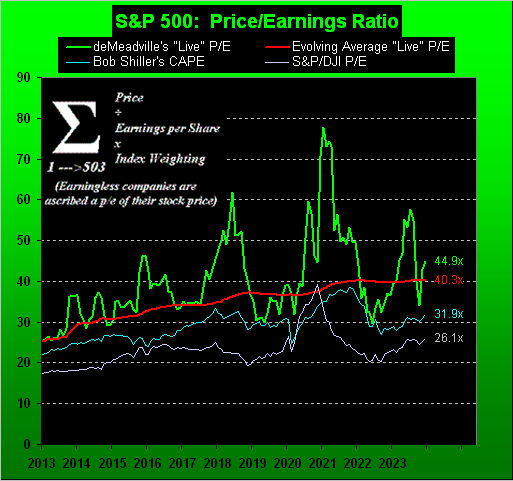
- The “live” price/earnings ratio of the S&P settled the week at 44.9x; that is essentially double the 66-year average P/E of 22.8x (Shiller “CAPE” into deMeadville post-2012) and +77% up from when our “live” deMeadville version was instituted those 11 years ago at 25.4x:
- Next, too, we’ve the S&P’s 50-year regression channel as plotted from 1973 up to COVID (the red vertical line) from which the channel’s trend is extended-to-date, suggesting the S&P “ought” today be at best sub-3000 rather than the current 4719:
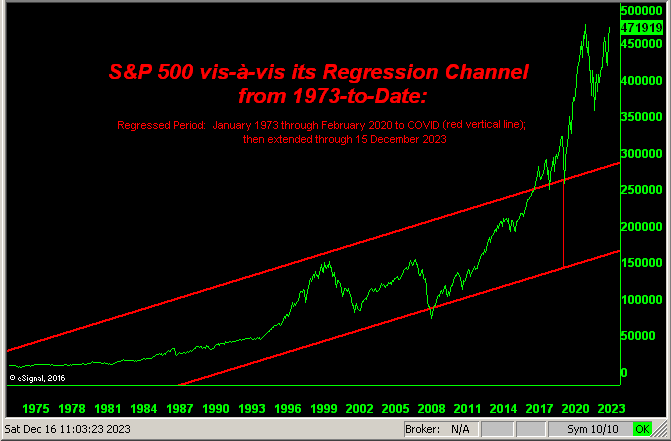
By the numbers indeed, the most daunting being lack of price-supportive earnings — and far worse — the lack of money when it all goes wrong.
The good news is: irrespective of the S&P’s ominous (understatement) overvaluation, the market is never wrong. The bad news is: the market always reverts to its broadest measures of mean. And should your use your trusty Pickett slide rule to do such reversion math, an S&P “correction” of -50% wouldn’t be untoward a wit. We merely await the FinMedia coming up with the catalyst, of which there are a multitude from which to choose, (see our 09 July missive that cited “Stocks’ 10 Crash Catalysts”), or to quote Bill Cowper from away back in 1785: “Variety is the spice of life”. And our sense remains “Look Ma! No Money!” shall be the ultimate crash driver. The Federal Reserve can then double the money supply to cover what the investment banks cannot credit to you after having sold your stock, the price of Gold at least doubles beyond where it already “ought” be (see the opening Gold Scoreboard), and on we go.
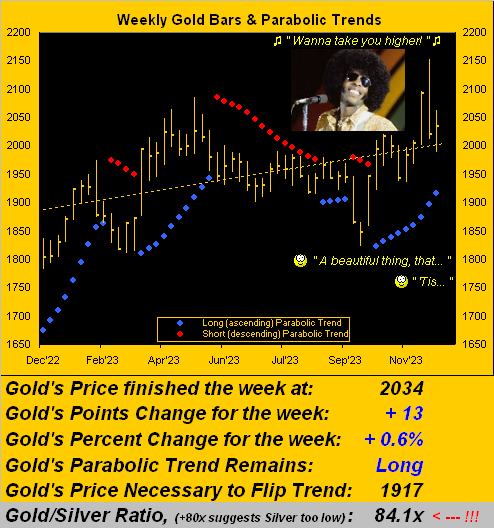
And thus to Gold let’s Go! In settling this past week at 2034, Gold is -118 points below its 04 December All-Time High of 2152. Regardless, price just completed its fourth up week of the last five, such fruition from the foresight to be “in” rather than face being fried upon stocks’ suicide. Here we’ve Gold’s weekly bars from one year ago-to-date, the current parabolic Long trend now nine weeks in duration. But don’t worry, should you deem that as too long: the longest such Long trend this century lasted 26 weeks back in 2005, which was preceded by a like 25-week stint in 2004 and later by a 24-week run in 2019. In fact from the year 2001-to-date, Gold has recorded eight parabolic Long trends of 20 or more weeks. Which is why we say: “When Gold goes, it Goes!” To the graphic with Sly we go:
But wait, there’s more: for can the Economic Barometer also go higher? Hat-tip Media Research Center in canvassing ABC News to discover that we’re wrong, for President Biden’s economy “is really wonderful” … even as the StateSide Treasury Deficit for November alone rocketed +26% “on higher interest costs”. Do we again cue BTO’s ![]() “You Ain’t Seen Nothing Yet”
“You Ain’t Seen Nothing Yet”![]() –[’73]? How about the month’s core retail inflation increasing from a +0.2% clip in October to now +0.3%? Fortunately favouring the Fed’s rate cut musings, the New York State Empire Index faceplanted from November’s +9.1 reading to -14.5 for December: “Smunch!” Here’s the Econ Baro representing the whole bunch:
–[’73]? How about the month’s core retail inflation increasing from a +0.2% clip in October to now +0.3%? Fortunately favouring the Fed’s rate cut musings, the New York State Empire Index faceplanted from November’s +9.1 reading to -14.5 for December: “Smunch!” Here’s the Econ Baro representing the whole bunch:
Time we go to wrap with:
The Gold Stack
Gold’s Value per Dollar Debasement, (from our opening “Scoreboard”): 3704
Gold’s All-Time Intra-Day High: 2152 (04 December 2023)
2023’s High: 2152 (04 December)
Gold’s All-Time Closing High: 2092 (01 December 2023)
The 2000’s Triple-Top: 2089 (07 Aug ’20); 2079 (08 Mar ’22); 2085 (04 May ’23)
Trading Resistance: 2047 / 2087 / 2016
10-Session “volume-weighted” average price magnet: 2042
Gold Currently: 2034, (expected daily trading range [“EDTR”]: 33 points)
Trading Support: 2021 / 2012 / 1997
10-Session directional range: down to 1988 (from 2152) = -164 points or -7.6%
The Weekly Parabolic Price to flip Short: 1917
The 300-Day Moving Average: 1909 and rising
The Gateway to 2000: 1900+
2023’s Low: 1811 (28 February)
The Final Frontier: 1800-1900
The Northern Front: 1800-1750
On Maneuvers: 1750-1579
The Floor: 1579-1466
Le Sous-sol: Sub-1466
The Support Shelf: 1454-1434
Base Camp: 1377
The 1360s Double-Top: 1369 in Apr ’18 preceded by 1362 in Sep ’17
Neverland: The Whiny 1290s
The Box: 1280-1240
And please do not fall afoul of the following … ’tis coming:

Go with your Gold!
Cheers!
…m…
www.TheGoldUpdate.com
www.deMeadville.com
and now on Twitter(“X”): @deMeadvillePro
15 December 2023 – 09:29 Central Euro Time
The Euro is at present below today’s Neutral Zone whilst above same are both Copper and the Spoo; BEGOS Markets volatility is mostly light. The S&P 500 looks to open at about 4730, some -90 points below the all-time high (4819); the “live” P/E (fut’s-adj’d) is now 45.0x. ‘Tis volume rollover today from December to March for the EuroCurrencies. Looking at Market Values for the five primary BEGOS components: the Bond shows as nearly 9 points “high” above the smooth valuation line; the Euro is about -0.01 points “low”; Gold is +47 points “high”; Oil is -7 points “low”, and the Spoo is (deep breath) +310 points “high”. The Econ Baro wraps its week with December’s NY State Empire Index along with November’s IndProd/CapUtil.
14 December 2023 – 09:07 Central Euro Time
The Bond, Copper and Spoo are at present above today’s Neutral Zones; the other BEGOS Markets are within same, and volatility is moderate. Yesterday’s S&P 500 rally again did not have full MoneyFlow support (Index +1.4% vs. Flow +1.0%); too the S&P is now quite frothy as the Flow factor to move the S&P by 1 point is notably diminishing. Gold’s firm up push yesterday moved our top three Market Rhythms for consistency (10-test basis) as follows (all for Gold): the 12hr Parabolics, 6hr Price Oscillator and same study for 4hr. Oil’s cac volume is moving from January into that for February. The Econ Baro looks to November’s Retail Sales and Ex/Im Prices, plus October’s Business Inventories.
13 December 2023 – 09:13 Central Euro Time
The Bond at present is above today’s Neutral Zone; both Copper and Oil are below same, and BEGOS Markets volatility is again light with the FOMC’s Policy Statement in the balance. The S&P 500 completed its 25th consecutive trading day as “textbook overbought”; the “live” P/E (futs-adj’d) is 44.5x; at 4644, the Index stands -174 points (-3.8%) below its 4819 all-time high (04 January 2022); the Spoo (including the recent +55 points of fresh March premium) is nonetheless +260 points above its smooth valuation line (see Market Values). Ahead of the Fed comes November’s wholesale inflation per the PPI.
12 December 2023 – 09:03 Central Euro Time
We’ve strength this morning in the Bond and EuroCurrencies, with session volatility notably light, save for the Swiss Franc having already traced 53% of its EDTR (see Market Ranges). Both the Swiss Franc and Gold confirmed their “Baby Blues” (see Market Trends) slipping below their +80% axes, suggestive of still lower prices near-term. Despite yesterday’s +0.4% rise in the S&P 500, its MoneyFlow (regressed into S&P points) fell -0.8%, reflected in the developing negative slant we’re seeing at the MoneyFlow page; too, the Index is now “textbook overbought” through the past 24 trading days. The Econ Baro awaits November’s CPI and Treasury Budget.
11 December 2023 – 09:08 Central Euro Time
Save for Oil (+0.6% at 71.67), the other seven BEGOS Markets are all at present in the red; session volatility is light. The Gold Update sees safe downside for the yellow metal toward 1975 without causing any concern for the overall uptrend(s); still by Market Trends, Gold’s “Baby Blues” are in real-time dropping below their key +80 axis, warranting a price move sub-2000. Of greater concern is misfortune in the making for the S&P which remains inanely overextended both fundamentally (unsupportive earnings) and technically (beyond “overbought”). Spoo volume today is rolling from the December cac into that for March, with an additional +52 points of fresh premium. The Econ Baro is quiet, albeit with an ample load of metrics as the balance of the week unfolds.
The Gold Update: No. 734 – (09 December 2023) – “Gold-Record’s Calamity; Stocks’ Stark Misfortune-to-Be”

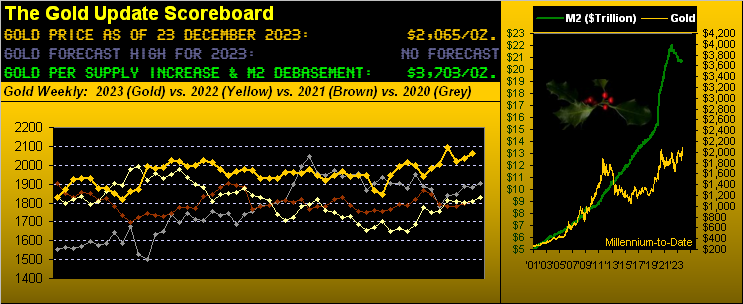
We’ll close it here with another FinMedia bemusement. The once-mighty now ratings-floundering CNN ran on Gold’s record-high Monday with: “Gold has never been this expensive.” With all due respect to the network’s writers and editorial staff, Gold remains extraordinarily cheap. “Expensive” was back in 2011 when Gold’s price growth was outpacing U.S. Dollar debasement, (recall our then writing about “Gold having gotten ahead of itself”). But for the chump news-droolers out there, the price of Gold last Monday reached its highest level ever at 2152 … yet valued today at 3705, Gold is cheap! What’s inanely “expensive” (understatement) is the stock market. And thus we wrap with this favourite graphic:
Stay with your Gold!
Cheers!
…m…
www.TheGoldUpdate.com
www.deMeadville.com
and now on Twitter(“X”): @deMeadvillePro
08 December 2023 – 09:12 Central Euro Time
‘Tis StateSide November Payrolls day for the Econ Baro, and at present seven of the eight BEGOS Markets are within their Neutral Zones, the only outlier being Oil above same; the latter appears trying to firm ’round the 70 handle. Session volatility is light, (except again for the non-BEGOS component Yen which has traced 119% of its EDTR as the BOJ interest rate play continues). The S&P 500 is now “textbook overbought” through the past 22 trading days and the “live” P/E is 43.3x; however, the recent MoneyFlow deterioration has (for the moment) righted itself, indicative of money being thrown at a terrifically expensive stock market. In addition to jobs data, the Baro also looks to December’s UofM Sentiment Survey.
07 December 2023 – 09:11 Central Euro Time
The Bond is at present below its Neutral Zone for today, whilst above same is Copper; BEGOS Markets volatility is again mostly light with the non-BEGOS exception of the Yen which already has traced 145% of its EDTR (see Market Ranges for the standard BEGOS components). Gold has calmed from its wild Monday ride: currently 2047, by the Market Profile we’ve resistance notably in the 2062-2065 zone, with supports right round current price, plus at 2036-2034, 2023 and 2014. A day ahead of Payrolls data for the Econ Baro, today’s metrics include October’s Wholesale Inventories and Consumer Credit.
06 December 2023 – 09:13 Central Euro Time
Gold, Copper and the Spoo are at present above today’s Neutral Zones; the other BEGOS Markets are within same, and volatility is mostly light. Going ’round the horn for the five primary BEGOS components at Market Values, we’ve (in real-time): the Bond +6.5 points “high” above its smooth its smooth valuation line, the Euro “in line”, Gold +57 points “high”, Oil -9.5 points “low” and the Spoo +206 points “high”. The S&P 500 is now “textbook overbought” through the last 20 trading days; the “live” P/E is 42.3x. For the Econ Baro we’ve November’s ADP Employment data, October’s Trade Deficit, and the revision to Q3’s Productivity and Unit Labor Costs.
05 December 2023 – 08:59 Central Euro Time
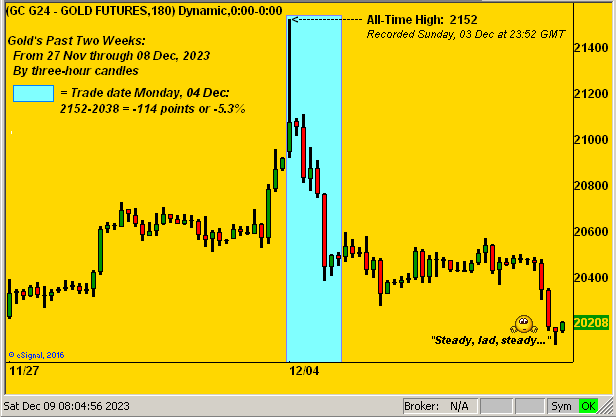
After achieving an All-Time High yesterday at 2152, Gold’s subsequent -113 intraday points drop ranks 5th-worst century-to-date; however the -5.3% drop ranks just 34th worst intraday. At present, the Euro, Copper and Spoo are below today’s Neutral Zones; none of the other BEGOS Markets are above same, and volatility has returned to mostly light. Our most consistent Market Rhythm at present (10-test swing basis) is Gold’s 4hr Price Oscillator. As anticipated, the Euro’s “Baby Blues” (see Market Trends) confirmed falling below the key +80% axis, indicative of lower prices near-term. And the Econ Baro looks to November’s ISM(Svc) Index.
04 December 2023 – 09:12 Central Euro Time
After setting an All-Time High on Friday (to 2096, settle 2092), Gold spiked overnight some +50 points, only to since return below Friday’s settle. At present ’tis red across the board for all eight BEGOS Markets, and volatility is robust. More details on to where the yellow metal can go near-to-medium term in The Gold Update, (which too outlines the case for an S&P “crash”). Note at the website the S&P 500 Moneyflow differential beginning to weaken, oft a precursor to lower price levels. Due for the Econ Baro is October’s Factory Orders.
The Gold Update: No. 733 – (02 December 2023) – “Gold: Finally!”
If you caught last Tuesday’s tweet (@deMeadvillePro, Gold then 2042) you saw where this was going: “Santa clearly is contemplating a new all-time Gold high by Christmas. ‘Twould be 2075 spot a/o 2089 FebFuts. (On verra…)”
And so for Gold, as the expression goes, “Santa came early this year.” In settling the week yesterday (Friday) at 2092, February Gold (the current “front month”) en route traded to as high as 2096, +7 points above the prior “front month” 2089 All-Time High that had been in place since 07 August 2020. Spot Gold, too, exceeded its prior All-Time High of 2074 in trading as high as 2076. Finally! ‘Tis a beautiful thing.
‘Course, you astute readers of The Gold Update fully realize that this year we did not forecast a specific high price, (which for you WestPalmBeachers down there is why the above Gold Scoreboard has stated “No Forecast” throughout 2023). Nonetheless, early in the year we expressed our anticipation of Gold by year-end at least achieving a new All-Time High: ![]() “Whoomp! (There It Is)”
“Whoomp! (There It Is)”![]() –[Tag Team, ’93]
–[Tag Team, ’93]
To wit, as herein penned back on New Year’s Day: “…how do we forecast a high for 2023? Linearly we don’t … as for uncharted territory above Gold’s All-Time High (2089 of 07 August 2020) that’s for the Fibonacci-obsessed.”
True, we from time-to-time dabble in “fib retracement” for establishing trading targets. However, we avoid the Sybilistic art of future “fib extension”: for us ’tis too Timothy Leary, to whom President Nixon in ’70 purportedly referred as “the most dangerous man in America”, (only to then to nix the Gold standard a year later). That from the “Now Look Who’s Talkin’ Dept.” … but we digress.
Given Gold’s fresh All-Time High is finally in hand, let’s take a realistic crack at “How high from here?” for the yellow metal. After all, new highs in major financial markets tend to draw in the “mo-mo” crowd, albeit for Gold, its notorious triple top across the past three years ain’t drawn squat. And let’s be honest: Gold’s new high at present is marginal at best.
“But it’s only been one day, mmb…”
‘Twouldn’t be a landmark missive without our beloved Squire. Still, such marginal high can cue the Gold Shorts, which from the “Party Pooper Dept.” may swiftly remind us that following the aforementioned 2089 high came the 2079 high on 08 March 2022 and then the 2085 high this past 04 May. Thus in the Shorts’ words, “There’s nothing to see here” in their anticipation of it again all going wrong for Gold.
Yet as we’ve oft quipped of late, “triple tops are meant to be broken”. And marginally or otherwise, that just happened. Moreover as herein penned one week ago regarding December’s monthly net changes: “…the last six [have been]: +2.6%, +4.5%, +3.4%, +6.4%, +2.9% and +3.8% from 2017 through 2022 respectively…” That is an average net December change of +3.9%, which from November’s 2056 futures settle would bring 2136 by New Year.
But wait, there’s optimistically more. Century-to-date Gold has recorded 5,767 trading days, 252 of which have elicited All-Time Highs. Now obviously it doesn’t “feel” like Gold averages a new high every 23 trading days: indeed therein the standard deviation is 155 days, the longest stint between All-Time Highs being 2,237 days from 06 September 2011 to 27 July 2020 (whew!) even as the U.S. Money Supply (“M2”) simultaneously increased +90.2% (whoa!)
Nevertheless to our point: for those 252 All-Time High days, the average maximum increase in the price of Gold within the enusing three months is +8.9%; or if you prefer, the median maximum price increase is +7.9%. Either way, “in that vacuum” from the present 2092 level would put Gold in the 2257-2278 range by February’s end, (just in case you’re scoring at home). ‘Course, hardly is “average” reality, but it at least gives us some measure of reasonable upside guidance for Gold through these next three months.
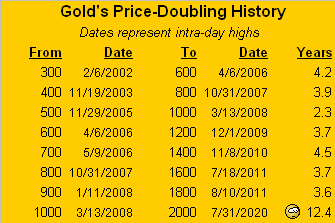
Of greater import however is that Gold’s new high remains peanuts vis-à-vis its currency debasement valuation, depicted in the opening Scoreboard as now 3707, i.e. +77% above here, even accounting for the increase in the supply of Gold itself. Which got us to question: how long does it typically take for the price of Gold to double? Here’s the answer from one price’s “century mark” to the next:
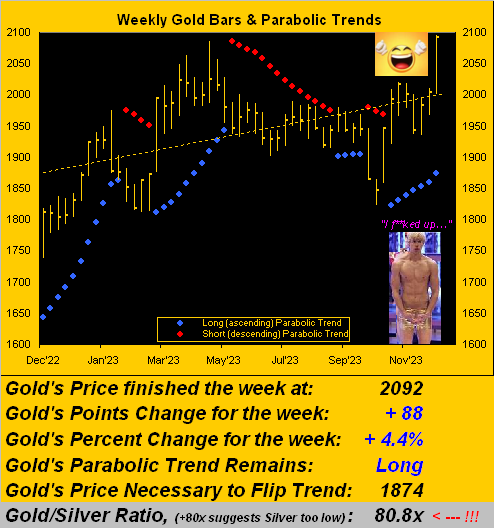
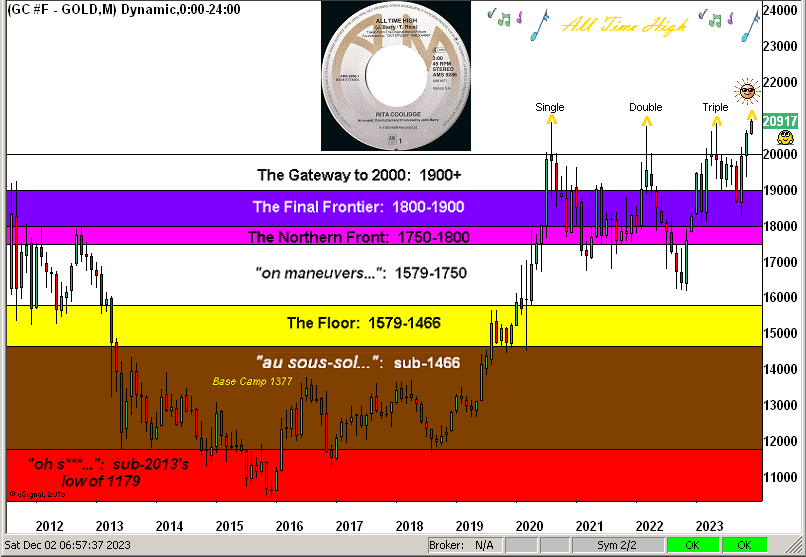
Naturally it being month-end plus a December day, here is Gold’s Structure by the monthly bars for the past 12 years. And yes, Virginia, just as there is a Santa Claus, so too as noted are triple tops meant to be broken. Et voilà. Thus in turn Gold is at an![]() “All Time High”
“All Time High”![]() –[Rita Coolidge, ’83]:
–[Rita Coolidge, ’83]:
To wrap this rather epic edition of The Gold Update, “We have breaking news…”
“Bring it on, mmb…”
Thank you, Squire. Direct from the “We’re Completely Gobsmacked Dept.” here ’tis:
Last evening we were all eyes on Gold when at precisely 18:28 GMT price recorded the new All-Time High of 2089.3, surpassing 2089.2 which as you well-know had been in place as the prior high since 07 August 2020. Some three-and-one-half hours later at 22:00 GMT price settled also at an All-Time Closing High of 2091.7.
Curious as to how our FinMedia friends would portray this great event, we went to Bloomy’s home page, obviously expecting it to be the lead story. But it wasn’t there. Worse, it was no where to be found their home page! So we instead zoomed over to Dow Jones Newswires’ Marketwatch home page. It must be at the top, right? Wrong! Rather, the lead stories were on “The Dow”, “Bitcoin” and “GameStop”. Where is the Gold story? We enabled a MW home page search for “Gold”: first find was Goldman; second find was again Goldman; third find was “Gold” … buried deep down the page amongst the “click-bait” ads for chumps, with the barest of mention of the new high.
But we really and truly learned something from this: Gold now is of no material media importance whatsoever. Who cares, right? The sad part is: when they finally figure it out (upon everyone morphing from marked-to-market millionaires to marked-to-reality impoverisheds) ’twill be too late.
Still, perhaps the late Leary would have gotten it:

“But his was of the Acapulco type, mmb…”
Likely the case there, Squire. As for the real thing, ’tis at an All-Time High and yet it remains unspeakably undervalued. That’s really all you need to know.
Got Gold? Got Silver? Got a wealth-preserved Future!
Cheers!
…m…
www.TheGoldUpdate.com
www.deMeadville.com
and now on Twitter(“X”): @deMeadvillePro
01 December 2023 – 09:16 Central Euro Time
All eight BEGOS Markets are at present within their respective Neutral Zones for today, and volatility is light. Gold appears rather hesitant just below record-high territory: FedFuts are 2060; the record high is 2089; but by Market Values, price is (in real-time) +73 points above its smooth valuation line; still by Market Trends, Gold is firmly in an uptrend, the “Baby Blues” therein continuing to climb; again a comprehensive assessment in tomorrow’s Gold Update. The S&P 500 is now “textbook overbought” through 17 consecutive trading sessions: the “live” P/E is a futs-adj’d 43.0x. The Econ Baro concludes its week with November’s ISM(Mfg) Index and October’s Construction Spending.
30 November 2023 – 09:21 Central Euro Time
At present, just Copper is the only BEGOS Market outside (above) its Neutral Zone for today; volatility again is light-to-moderate. As tweeted (@deMeadvillePro) on Tuesday: “Santa clearly is contemplating a new all-time Gold high by Christmas. ‘Twould be 2075 spot a/o 2089 FebFuts. (On verra…)” Price since has reached 2073 (FebFuts); more in this coming Saturday edition of the Gold Update. Looking at Market Rhythms, the most consistent at present are (on a 10-test basis) the Yen’s (not yet an official BEGOS component) 1hr Price Oscillator and 2hr Moneyflow, and Gold’s 4hr Price Oscillator; on a 24-test basis we’ve the Yen’s 15mn MACD along with Gold’s 30mn MACD and 30mn Price Oscillator. ‘Tis a busy day for the Econ Baro, including November’s Chi PMI, plus October’s Pending Home Sales, Personal Income/Spending, and the “Fed-favoured” Core PCE Index.
29 November 2023 – 09:17 Central Euro Time
The Bond is the sole BEGOS Market at present outside (above) its Neutral Zone; session volatility is light-to-moderate. After flipping from Long-to-Short, the Bond’s daily parabolics whip-sawed back to Long: however, we’re minding the Bond’s “Baby Blues” (see Market Trends) for their breaking below the key +80% axis. Going ’round the Market Values horn for the primary BEGOS components, in real-time we’ve the Bond nearly +6 points “high” above the smooth valuation line, the Euro +0.0316 points “high”, Gold +64 points “high”, Oil -7.17 points “low”, and the Spoo a whopping +253 points “high”. The Econ Baro awaits the second peek at Q3 GDP. And late in the session comes the Fed’s Tan Tome.
28 November 2023 – 09:15 Central Euro Time
All eight BEGOS Markets are at present within their respective Neutral Zones for today; session volatility is light. Gold’s cac volume is rolling from December into February, with +20 points of premium; other rollovers in process include Silver, Copper and the Bond, all from December into March. As anticipated, the Bond’s “Baby Blues” (see Market Trends) are teasing their +80% axis: confirmation below that level is suggestive of weaker prices near-term; too, the Bond’s daily Parabolics confirmed flipping from Long to Short effective today’s open. For the Econ Baro we’ve November’s Consumer Confidence.
27 November 2023 – 09:17 Central Euro Time
Both Gold and Silver are at present above today’s Neutral Zones: the white metal, (which has been lagging Gold’s performance), has provisionally flipped its weekly parabolic from Short to Long; confirmation should come at next Friday’s settle. The Spoo is at present below its Neutral Zone. And BEGOS Markets volatility is again moderate. The “textbook overbought” streak of the S&P itself is now through 13 sessions. The Gold Update (brief as planned) is price-bullish, especially given the yellow metal having recorded net gains for the six past Decembers. The Econ Baro starts a week of 12 incoming metrics with October’s New Home Sales.
The Gold Update: No. 732 – (25 November 2023) – “Basking Under Gold”

So there we are ever so briefly — yet hopefully saliently — for this week. Mind too your favourite Gold information at the website: simple select “Gold” under the BEGOS Markets menu and all the price-leading information is there: Gold’s Market Value, Trend, Profile, Magnet, Range, and the currently-highlighted Market Rhythm featuring the 12-hour parabolic study. We’ll therefore see you in a week’s time with the usual graphics-rich end-of-month edition. Until then:

Bask under your Gold!
Cheers!
…m…
www.TheGoldUpdate.com
www.deMeadville.com
and now on Twitter(“X”): @deMeadvillePro
24 November 2023 – 08:35 Central Euro Time
The second day of the otherwise abbreviated trading session finds the Bond at present below its Neutral Zone; the rest of the BEGOS Markets are within same, and volatility is moderate. The Bond’s “Baby Blues” appear poised to begin their descent in the ensuing week; and by Market Values, the Bond in real-time is nearly +5 points above its smooth valuation line. As for the Spoo, ’tis +265 points above same, and the fut’s-adj’d live P/E of the S&P is 44.2x. We’ve early closures today across all the components and the Econ Baro is complete for the week.
22 November 2023 – 07:13 Central Euro Time
Just brief and early this morning, (our going into motion across the next few days): only Copper is at present outside (below) its Neutral Zone for today; BEGOS Markets volatility is light. Yesterday’s S&P 500’s down move nonetheless maintains a “textbook overbought” rating for the Index, however now “moderate” rather than “extreme”; (such condition can take days, even weeks, to unravel). And metrics to close out the week for the Econ Baro include October’s Durable Orders. Happy T-Day to you StateSiders and fellow USAers ’round the globe.