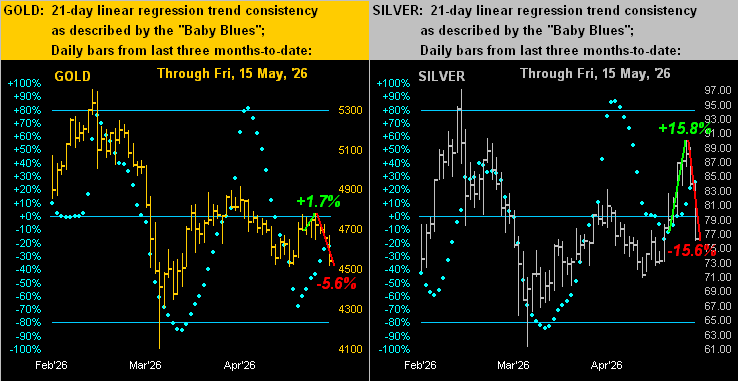
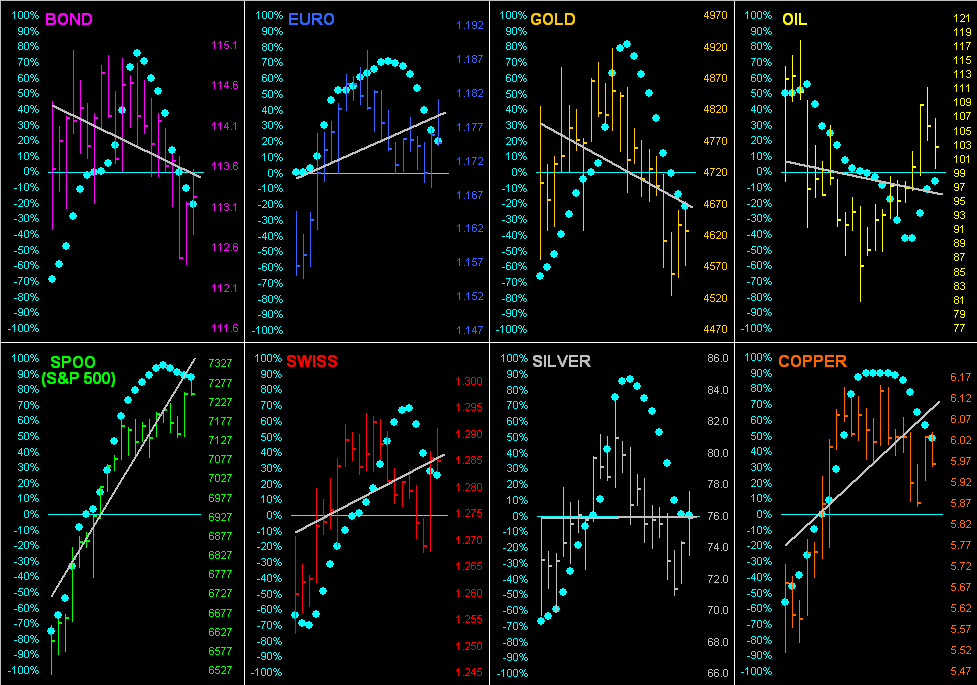
Both Copper and the Spoo are at present above today’s Neutral Zones; the balance of the BEGOS Markets are within same, and session volatility into “Getaway Friday” is quite light. As this week has unfolded, the S&P 500’s daily Parabolics and MACD have taken on negative readings; too, the Spoo’s “Baby Blues” (see Market Trends) for linreg consistency have in real-time dropped another notch to +83%, their key line-in-the-sand being +80%. Going ’round the horn for the five primary BEGOS components’ Market Values in real-time: we see the Bond -3^21 points “low” vis-à-vis its smooth valuation line, the Euro -0.023 points “low”, Gold -240 points “low”, Oil in line with its Market Value, and the Spoo +351 points “high”. For the Econ Baro we’ve the revision to May’s UoM Sentiment Survey, plus April’s Leading (i.e. “lagging”) Indicators. And ’tis the final day of Q1 Earnings Season. Tomorrow comes the 862nd consecutive Saturday edition of The Gold Update. Monday brings limited trading hours for the BEGOS Markets given Memorial Day StateSide and Pentecost on this side of The Pond.
 Mark
Mark
21 May 2026 – 08:48 Central Euro Time
Copper is at present the sole BEGOS Market outside (below) its Neutral Zone for today; session volatility is again mostly light. Copper at 6.2835 is trading below its most volume-dominant Market Profile price (6.3050) through which it fell yesterday; too by Market Trends, Copper’s linreg remains positive as ’tis been since 13 April, but is now lacking puff; (as previously noted, that for the Spoo too remains positive, but the upside consistency is becoming less so); Copper’s best Market Rhythm for pure swing consistency on both the 10-test and 24-test bases has been the 30mn Price Oscillator: indeed per the last 16 swings, price by that Rhythm (with the benefit of hindsight) as achieved intra-trade profit of at least 0.048 points ($1,200/cac) 13 times. The Econ Baro looks to metrics including May’s Philly Fed Index and April’s Housing Starts/Permits.
20 May 2026 – 08:36 Central Euro Time
Silver is at present above its Neutral Zone for today, whilst below same is Oil; volatility for the BEGOS Markets is mostly light. The Spoo yesterday settled below its Market Magnet (7416), suggestive of still lower prices near-term; as noted, we’re minding the Spoo’s “Baby Blues” of linreg consistency (see Market Trends) for the Blues to break below the key +80% which now looks to occur as soon as tomorrow, following which price ought further fall; the Blues have not produced a signal for the Spoo since the Long suggestion back on 02 April, price opening that day at 6619. Amongst the five primary BEGOS components, our best correlation remains negative between the Bond and Oil. Nothing is due today for the Econ Baro. And late in the session comes the FOMC Minutes from its 28/29 April meeting.
19 May 2026 – 08:41 Central Euro Time
The Bond, Euro, Swiss Franc, Silver and Copper are all presently below their respective Neutral Zones for today; the other three BEGOS Markets are within same, and volatility is light-to-moderate. At Market Trends, we’re minding the Spoo’s “Baby Blues” of linreg consistency: whilst they remain well-above the key +80% axis, they are nonetheless in the early signs of decline, barring the Spoo racing back up towards its all-time high (7540 v.s current 7409); by Market Rhythms the Spoo’s best for pure swing consistency on a 10-test basis has been the 15mn Price Oscillator, whereas on a 24-test basis ’tis been the 2hr Price Oscillator; and by its Market Profile, the Spoo’s most volume-dominant price of the past fortnight is 7421, which is about the midpoint of today’s trading range thus far. The sole incoming metric today for the Econ Baro is April’s Pending Home Sales.
18 May 2026 – 08:36 Central Euro Time
Presently, the Bond, Copper and Spoo are below today’s Neutral Zones, whilst above same is Oil; BEGOS Markets’ volatility is moderate. The Gold Update sees price’s downtrend as remaining in force, be it by the near-term 21-linreg trend (see Market Trends) or the broader-term weekly Parabolics, the prior week’s rally thus having been one of “relief”. The Spoo appears en route to recording a second consecutive down day, which across the prior 33 trading days (from 31 March) has only twice occurred; the S&P 500 itself of course remains technically overbought through the last 27 trading days as well as fundamentally overvalued, indeed vastly so via the “live” futs-adj’d P/E at this instant of 47.9x. Due for the Econ Baro is the NAHB Housing Index for May. And this is the final week of Q1 Earnings Season.
The Gold Update: No. 861 – (16 May 2026) – “Gold’s Recent Trend Not Much of a Friend”
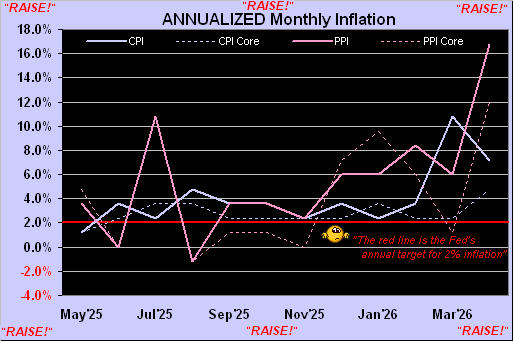
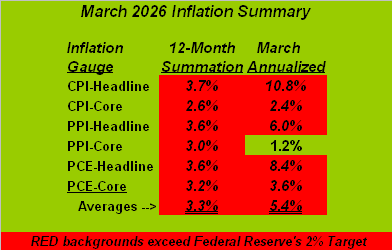
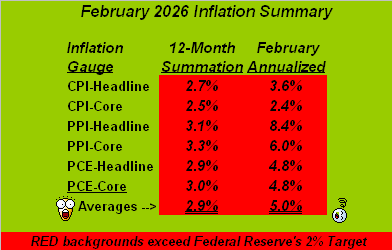
And as is the rule (albeit 2004-2006 was an exception), higher rates make the Dollar more attractive at the conventional-wisdom expense of Gold, (which simplified for you WestPalmBeachers down there means Gold goes down when rates go up). ‘Course, we all know that “Big Oil” et alia are getting the blame; yet inflation was already on the move pre-war, and moreover by the above graphic — assuming that neither do you eat nor drive — the “core” rates themselves are way above the Fed’s targeted +2% shelves. ![]() “Oh Well”
“Oh Well”![]() –[Fleetwood Mac, ’69].
–[Fleetwood Mac, ’69].
Too, we’ve the Economic Barometer, for which nine of last week’s 15 incoming metrics improved period-over-period, notably therein Industrial Production for April at +0.7%, its month-over-month swing (from -0.3% in March) the best since that for August 2024. But March’s Business Inventories backed up quite a bit for a second consecutive month. Is the moving of product slowing given inflation is growing? (Do we dare again utter the “s” word?) Perhaps not just yet as the Baro is still uptrending:
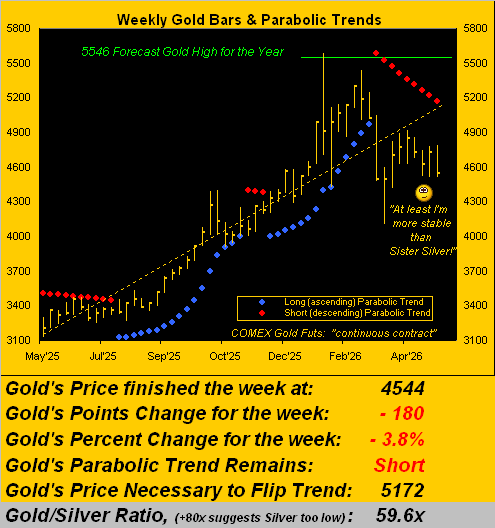
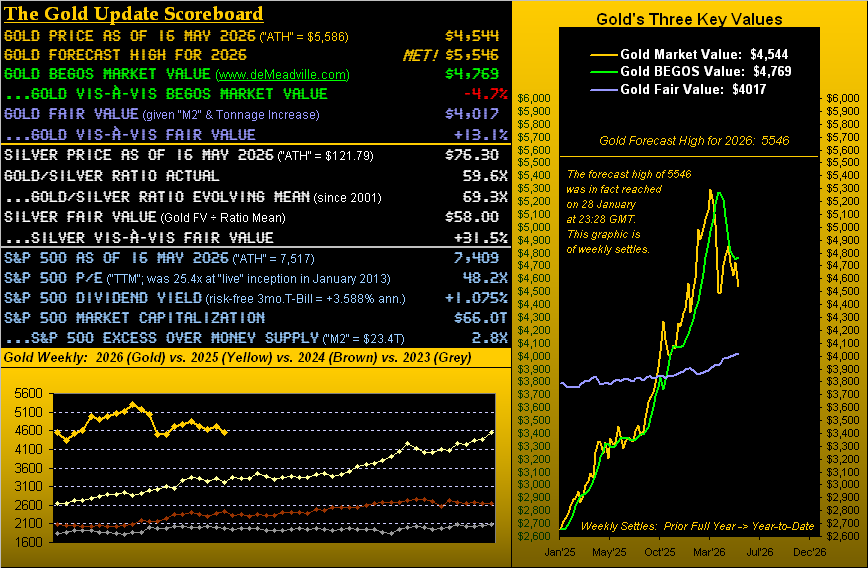
Here’s how it all stands for Gold in the stack.
The Gold Stack (continuous contract pricing):
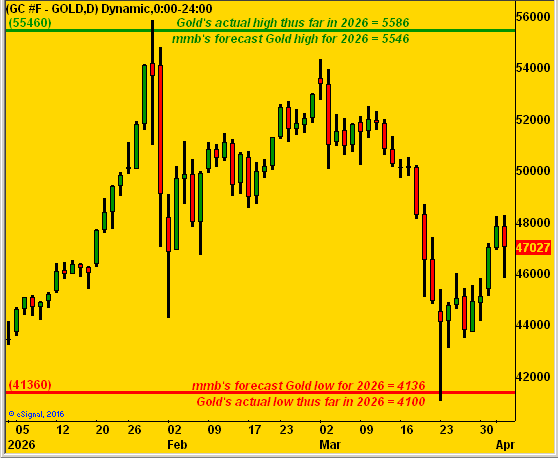
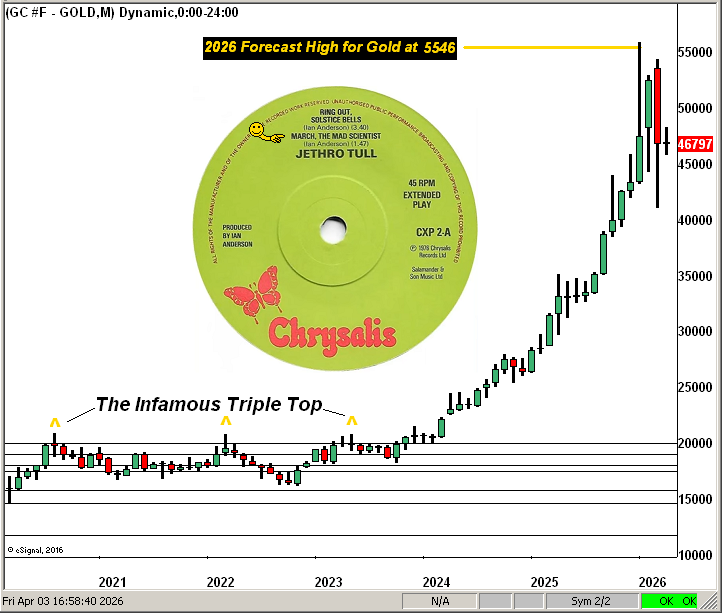
Gold’s All-Time Intra-Day High: 5586 (29 January 2026)
2026’s High: 5586 (29 January)
Gold’s All-Time Closing High: 5411 (28 January 2026)
The Weekly Parabolic Price to flip Long: 5172
10-Session directional range: up to 4983 (from 4510) = +273 points or +6.1%
Gold’s BEGOS Market Value (from our opening “Scoreboard”): 4769
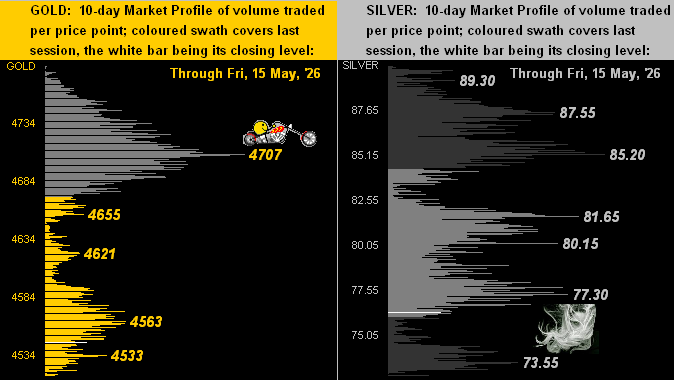
10-Session “volume-weighted” average price magnet: 4667
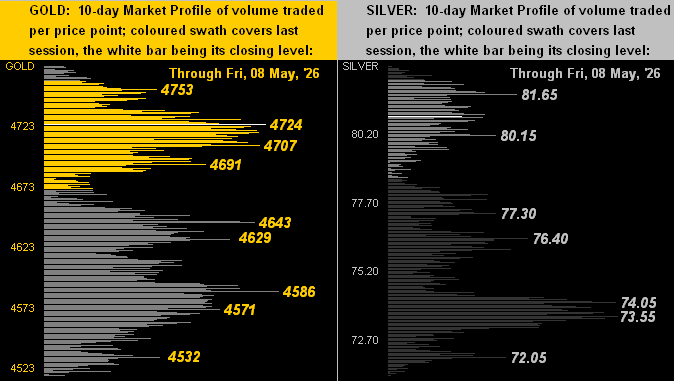
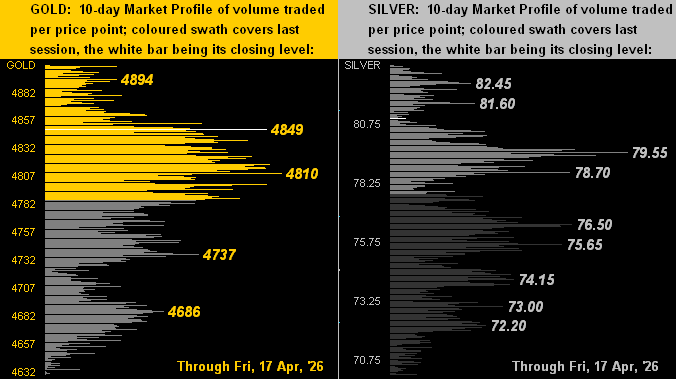
Trading Resistance: Market Profile notables: 4563 / 4621 / 4655 / 4707
Gold Currently: 4544, (expected daily trading range [“EDTR”]: 107 points)
Trading Support: per the Market Profile: 4533
2026’s Low: 4100 (23 March)
Gold’s Fair Value per Dollar Debasement, (from our opening “Scoreboard”): 4017
The 300-Day Moving Average: 3980 and rising
The 2000’s Triple-Top: 2089 (07 Aug ’20); 2079 (08 Mar’22); 2085 (04 May ’23)
The Gateway to 2000: 1900+
The Final Frontier: 1800-1900
The Northern Front: 1800-1750
On Maneuvers: 1750-1579
The Floor: 1579-1466
Le Sous-sol: Sub-1466
The Support Shelf: 1454-1434
Base Camp: 1377
The 1360s Double-Top: 1369 in Apr ’18 preceded by 1362 in Sep ’17
Neverland: The Whiny 1290s
The Box: 1280-1240
Of non-geopolitical interest in the ensuing week is the Wednesday release of the FOMC’s 28/29 April Meeting Minutes. A bit more hawkish than usual perhaps? We’ll see who’s been really paying attention to the math. And Friday brings for April the Conference Board’s Leading (i.e. “lagging”) Indicators, which have not mustered a positive reading since last July, even as the Econ Baro has essentially risen throughout. ‘Course, ’tis said The Board can go a bit “woke” in its assessments…

Go with the Gold!
Cheers!
…m…
www.TheGoldUpdate.com
www.deMeadville.com
and now on “X”: @deMeadvillePro
15 May 2026 – 08:44 Central Euro Time
The Dollar’s firm week has it up to its highest level (99.110) since 01 April; thus ’tis no surprise to see the BEGOS Markets (save for Oil) working lower: at present, the Bond, EuroCurrencies, Metals Triumvirate and Spoo are all below today’s Neutral Zones; Oil is above same, and its cac volume is rolling from June into that for July at a -4.20 points discount. Gold’s 21-day linreg remains negative (see Market Trends) and the weekly parabolic Short trend looks to complete its ninth week as we’ll see in tomorrow’s 861st consecutive Saturday edition of The Gold Update. The S&P 500 closed above 7500 yesterday for the first time, the intra-day high (7517) finding the “live” P/E at 49.9x; the yield on the Index is 1.066% vs. 3.588% annualized on the “risk-free” U.S. three-month T-Bill. The Econ Baro finishes its week with May’s NY State Empire Index and April’s IndProd/CapUtil. And there remains one week still to run in Q1 Earnings Season.
14 May 2026 – 08:46 Central Euro Time
Inflation is running sufficiently “hot” such that under just-appointed FedHead Warsh the FOMC “ought” raise rates per its next Policy Statement (17 June); on verra… At present, we’ve Copper as the sole BEGOS Market outside (below) its Neutral Zone for today, and session volatility is again light. The Spoo yesterday moved well-above volume-dominant Market Profile resistance at 7421: its current 7488 price is (in real-time) +516 points above its BEGOS Market Value, such equating the P/E of the S&P 500 to 49.5x, the Index itself yesterday completing a 25th consecutive session as “textbook overbought” whilst posting a record high at 7460. Our best correlation amongst the five primary BEGOS Markets is negative between the Bond and Oil. For the Econ Baro we await metrics including April’s Retail Sales and Ex/Im Prices, plus March’s Business Inventories.
13 May 2026 – 08:37 Central Euro Time
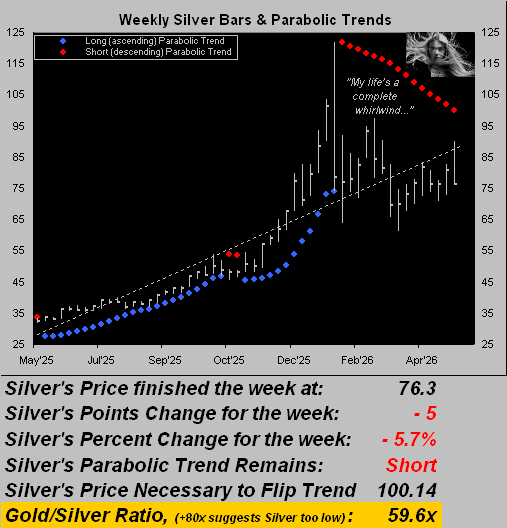
Presently, both the Euro and Oil are below their respective Neutral Zones for today, whist the Spoo is above same; BEGOS Markets’ volatility is light. Over the past couple of years we’ve in The Gold Update said that the Fed need raise rates: that may soon come to pass given the continued ramping up of inflation; (the next FOMC Policy Statement is due 17 June). Looking at Market Rhythms for pure swing consistency, our top three (10-test basis) have been Gold’s daily Moneyflow, the non-BEGOS Yen’s 30mn Moneyflow and the Bond’s 1hr MACD; too (on a 24-test basis) they are the Euro’s 30mn Moneyflow, Oil’s 2hr MACD and Silver’s 30mn Parabolics. Silver has been firmly breaking out to the upside, indeed +25% across just the past 11 trading days low-to-high inclusive. And the Econ Baro awaits wholesale inflation for April via the PPI.
12 May 2026 – 08:36 Central Euro Time
Seven of the eight BEGOS Markets are at present in the red, six of which are below today’s Neutral Zones; the lower Bond is within same and Oil is the sole up component at 99.45 and above its Neutral Zone; session volatility is again mostly moderate. The Bond (112^23) yesterday failed to hold Market Profile volume-dominant support at 113^06, and price moved beneath the Market Magnet; by Market Rhythms for pure swing consistency, the Bond’s best on a 10-test basis has been its 1hr MACD and on a 24-test basis the 15mn Price Oscillator. For the Precious Metals, at Market Trends Gold’s 21-day linreg still is negative, however that for Silver has rotated to positive, even as price is lower thus far today. April’s CPI and Treasury Budget come due for the Econ Baro.
11 May 2026 – 08:43 Central Euro Time
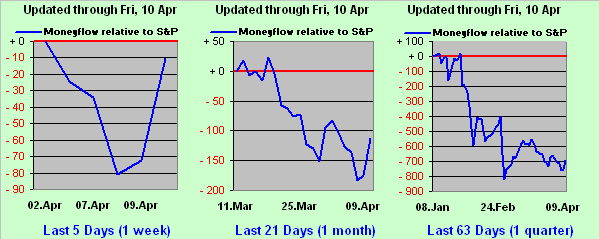
The Bond, Euro, Swiss Franc and Gold all are at present below today’s Neutral Zones; above same are Copper and Oil, and BEGOS Markets’ volatility is mostly moderate. The Gold Update queries if last week’s rally was one of “relief” given the 21-day linregs for both Gold and Silver remain negative, but less so as the “Baby Blues” of trend consistency are rising (see Market Trends); cited too is our long-ongoing concern of the S&P 500’s extreme overvaluation; by the Spoo’s BEGOS Market Value in real-time, ’tis +532 points above the smooth valuation line and the S&P’s “live” (futs-adj’d) P/E is 48.1x. That stated, substantive money has been getting thrown into the S&P: per our MoneyFlow page, all three time gauges (weekly, monthly and quarterly) suggest the S&P can continue higher still by a few hundred points, (barring this being a “blow-off top”). ‘Tis a busy week for the Econ Baro with 15 incoming metrics scheduled, beginning today with April’s Existing Home Sales.
The Gold Update: No. 860 – (09 May 2026) – “Gold: Relief Rally or Downtrend Finale? (and S&P Wary)”

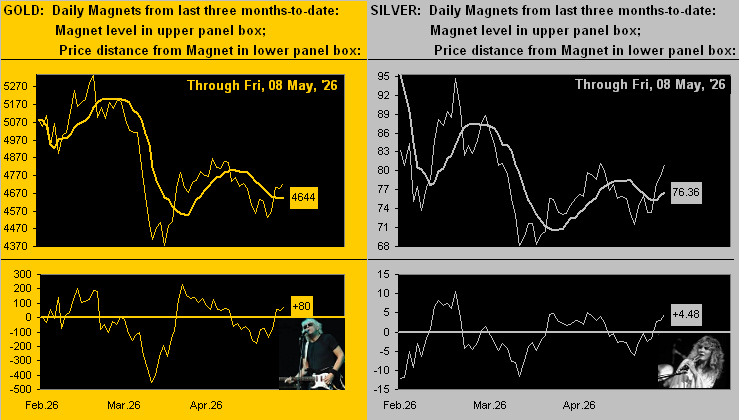
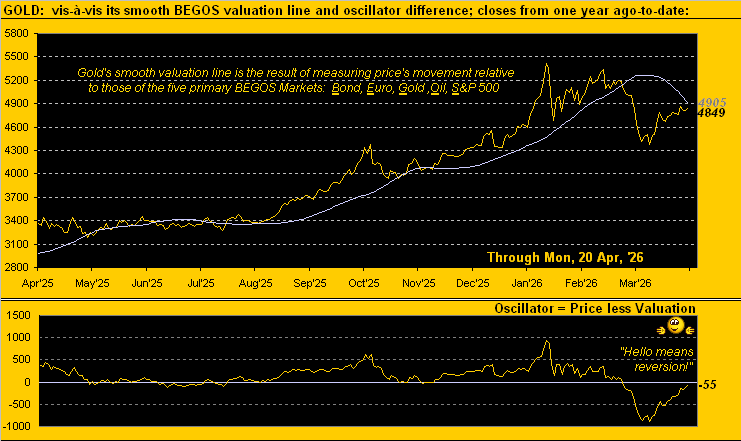
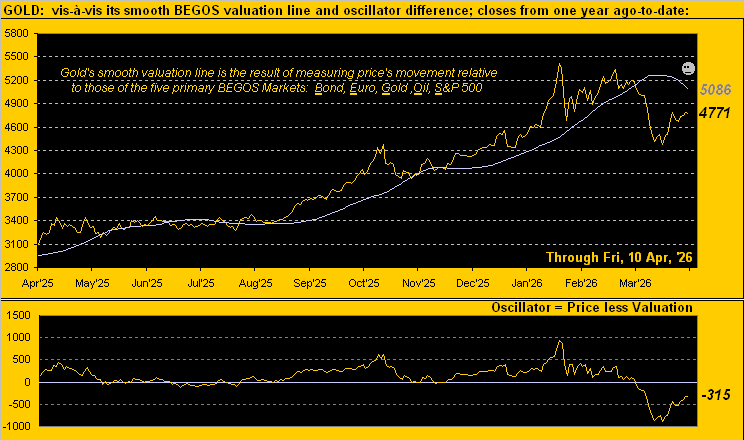
The lower Gold levels we’d anticipated two weeks ago (price having dropped from our 25 April penning at 4725 by as much as -4.6% to 4510 this past Monday) clearly panned out. Since that low, Gold has recovered all of such loss and then some, climbing on Thursday to as high as 4775 in settling the week yesterday (Friday) at 4724. And by the above Scoreboard, the combination of Gold recovering contra to its declining BEGOS Market Value* (now 4748) puts those two levels relatively near one another. As we oft quip: “Means reversion is a beautiful thAng”. However (as also therein depicted), given Gold’s Fair Value (now 4011), price remains notably overvalued by +17.8%.
*Gold’s value based on its movement relative to those of BEGOS: Bond, Euro, Gold, Oil, S&P 500
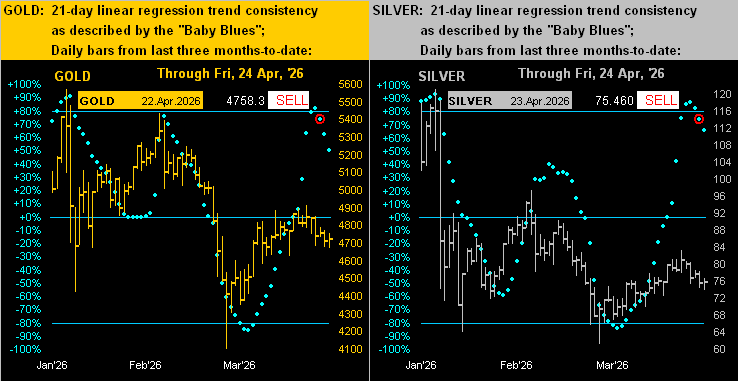
Still, per our title’s query: is Gold in just a relief rally, or did the recent downtrend reach its finale? Let’s have a look. Et voilà, our latest view, along with that for Silver too, their respective pink 21-day linear regression trends still negatively skewed. Cue Edith Piaf from ’45: ![]() “La Vie en Rose”
“La Vie en Rose”![]()
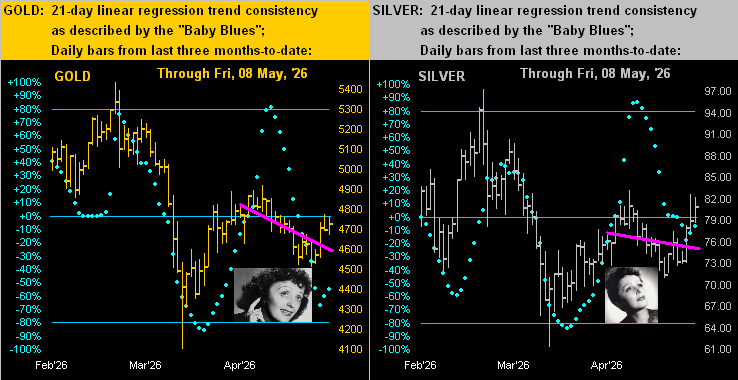
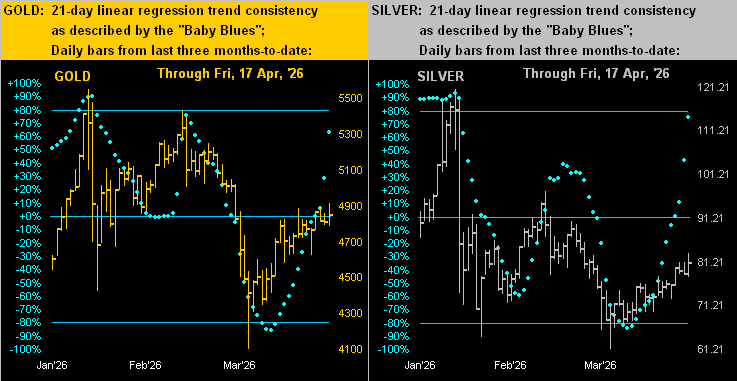
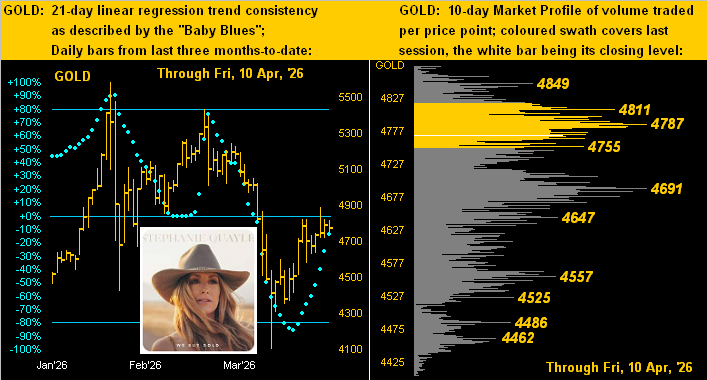
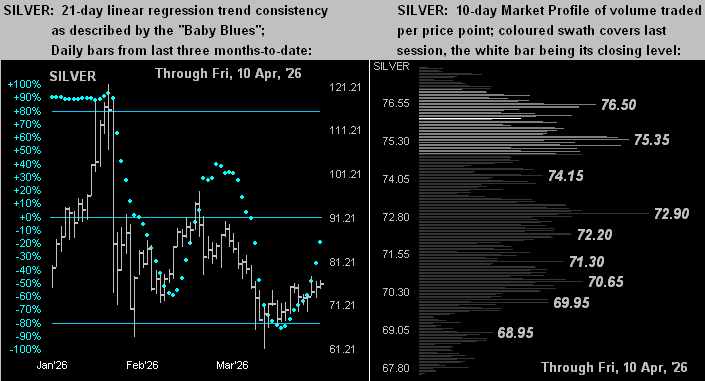
‘Course (save for those WestPalmBeachers down there), market participants know ’tis the tendency of technicals to lag price. And those trendlines for Gold and Silver are losing their downside consistency because the baby blue dots — at least for the past three trading days — are on the rise. As these “Baby Blues” tend to lead price, we may see such trends rotate from negative to positive over the next week or two, (the blue dots then having crossed back above their respective 0% axes).
But wait, there’s more: let’s go to the Market Magnets for both precious metals. Note the steely upside crossovers of price above Magnet. As described on the website: “…being ‘attracted’ to and crossing the Magnet, we expect price to continue in the same direction. But when the price gets too far away from the Magnet, we anticipate price to be re-attracted to the Magnet…” Cue Walter Egan with Stevie Nicks from ’78: ![]() “Magnet and Steel”
“Magnet and Steel”![]()
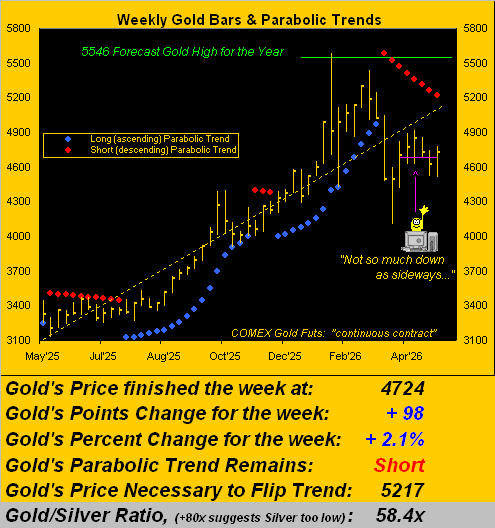
Sideways notwithstanding, for Gold in the ensuing week to flip its parabolic trend from Short to Long, price need rise +493 points such as to eclipse the noted 5217 level. As of now, the expected weekly trading range is “only” 335 points, (last’s week’s actual range being “just” 265 points), and the daily 107 points. Thus barring the long-bankrupt U.S. Treasury actually acknowleding bankruptcy (or some other momentous market-moving event), Gold’s Short trend likely has more than a week before reaching its end, even should price continue to ascend.
Meanwhile: shall there ever be an end to the meteoric rise in the S&P 500? Our wariness is beyond extreme. ‘Round here, the high-level finance folks with whom we’re humbly honoured to engage all ‘know’ that “The Crash!” is coming. (‘Tis been re-hashed time and again now for some three years). Regardless, recall in our 18 April missive that for the S&P’s practically non-existent dividend yield to match that of the annualized three-month U.S. T-Bill, the Index need decline -64%. (That won’t be on CNBS). And perhaps such demise is near, for as a fine friend the other day said: “It’s different now.” That thus stated, we’ve repetitively learned that ’tis never different.
To be sure, the S&P’s Q1 Earnings Season has exhibited excellent year-over-year growth; but as we’ve regularly underscored, the actual level of earnings remains too poor to maintain price, especially given more than triple the yield in the “risk-free” T-Bill.
So, here’s the quintessential question to pose for equities chasers in this Investing Age of Stoopid. The price of an investment into which you want to pile on along with all the lemmings is $48.20. Your trusty stockbroker tells you that if you buy today at that price, one year from now your value will be — including dividend yield — $49.72. Gonna buy it? Of course not. A +3.15% gain is boring! No. You want stocks that triple several times a year, ’cause that’s what everybody else has.
“Well, what exactly is that $48.20 stock, mmb?”
‘Tis not a stock, Squire. Rather, ’tis proportionally the “price” and “return” of the S&P 500 today. The price/earnings ratio settled this past week at 48.20x. That means you are willing to pay $48.20 for something that in a year shall earn $1.00, putting the price (per retained earnings) at $49.20. Add in the amazing yield of 1.080% for another 52¢ and there’s your all-in value a year hence of $49.72 … just in case you’re scoring at home.
Looking to gain even less? By the same proportional math for some specific S&P constituents, buying Tesla (TSLA) equates to paying $358 for something that earns $1. CoStar Group (CSGP)? $536 to gain $1. Or ![]() “How much is that doggie in the window?”
“How much is that doggie in the window?”![]() –[Patti Page, ’53] Datadog (DDOG) $647 to earn $1. Then of course, one can do a full face-plant with CrowdStrike Holdings (CRDW) by paying an actual $528 for something that earns nothing. Have a great day. The Economic Barometer continues to have its share of them…
–[Patti Page, ’53] Datadog (DDOG) $647 to earn $1. Then of course, one can do a full face-plant with CrowdStrike Holdings (CRDW) by paying an actual $528 for something that earns nothing. Have a great day. The Economic Barometer continues to have its share of them…
We’ll wrap it here with this updated image from “A Picture is Worth a Thousand Words Dept.”, or in this case, perhaps just one word: “YIKES!”
Here’s a better word: “GOLD!”
Cheers!
…m…
www.TheGoldUpdate.com
www.deMeadville.com
and now on “X”: @deMeadvillePro
08 May 2026 – 08:48 Central Euro Time
The EuroCurrencises, Metals Triumvirate and Spoo are all presently above today’s Neutral Zones; below same is Oil, and session volatility for the BEGOS Markets runs from mild for the Bond to robust for Copper, the latter having thus far traced 169% of its EDTR (see Market Ranges). Copper’s best Market Rhythm for pure swing consistency is (on a 10-test basis) the 30mn Moneyflow and (on a 24-test basis) the daily MACD; too, the daily MACD in swinging has reached at least 0.10 targeted (in hindsight) points across the last 10 swings in-a-row. Gold (4740) has moved well-up from its Monday low of 4510: more on the precious metals in tomorrow’s 860th consecutive Saturday edition of The Gold Update. Today the Econ Baro awaits April’s Payrolls data, May’s UoM Sentiment Survey, and March’s Wholesale Inventories.
07 May 2026 – 08:46 Central Euro Time
Record highs continue for the S&P 500, yesterday achieving 7369: the futs-adj’d “live” P/E at this moment is 46.7x and the yield is down to 1.076%. Presently, both Gold and Silver are above today’s Neutral Zones; otherwise, the rest of the BEGOS Markets are within same, and volatility is light. By Market Trends, we’ve positive 21-day linregs for the Swiss Franc, Copper, Oil and the Spoo; thus they are negative for the Bond, Euro, Gold and Silver. Oil yesterday settled below its Market Magnet for the first time since 20 April as well as below its smooth valuation line for the first time since 27 April, both suggestive of still lower prices near-term; Oil’s best Market Rhythm for pure swing consistency is its 30mn Moneyflow. The Econ Baro’s incoming metrics include March’s Consumer Credit and Construction Spending, plus the latter’s (delayed) for February, and the initial read of Q1’s Productivity and Unit Labor Costs.
06 May 2026 – 08:43 Central Euro Time
‘Tis a moderate-to-robust volatile start to Wednesday with seven of the eight BEGOS Markets at present above their day’s respective Neutral Zones, the sole component below being Oil. Gold is up better than +100 points, however by Market Trends the “Baby Blues” of linreg consistency are still falling, as are those for Silver; since The Gold Update’s (25 April) anticipation for lower Gold prices, the yellow metal has dropped by as much as -4.6%, notwithstanding this second session of “relief rally”; currently 4677, Gold’s most volume-dominant overhead resistor is 4725 (see Market Profiles). The S&P 500 continues to make record highs (7273) even as the Index is now 19 consecutive trading days “textbook overbought”: by Market Values in real-time, the Spoo is +505 points “high” above its smooth valuation line. For the Econ Baro we’ve April’s ADP Employment data.
05 May 2026 – 10:11 Central Euro Time
A bit tardy this morning given an internet “slowdown”. For the moment, we’ve all three elements of the Metals Triumvirate above today’s Neutral Zones, as is the Spoo. The other BEGOS Markets are within same, and volatility is light-to-moderate. The precious metals’ recovery thus far today is not enough to stem the “Baby Blues” of linreg consistency from further falling in real-time, (see Market Trends). As to our best Market Rhythms for pure swing consistency, the 10-test leaders have been Gold’s daily Moneyflow, the Euro’s 30mn Moneyflow and Copper’s 8hr Moneyflow; for the 24-test basis they are Silver’s 15mn for both its Moneyflow and MACD, plus the Bond’s 1hr Moneyflow. The Econ Baro awaits April’s ISM(Svc) Index, March’s Trade Deficit and New Home Sales, plus the latter (delayed) for February.
04 May 2026 – 08:35 Central Euro Time
The Bond, Gold and Oil are all at present below today’s Neutral Zones; above same are the Euro and Spoo, and session volatility for the BEGOS Markets is mostly moderate. The Gold Update takes a mildly cautious stance on the precious metals, both of which though Friday are up +6.8% year-to-date, having of course been substantially higher in late January; at Market Trends, Gold’s “Baby Blues” of linreg consistency continue to drop, whereas those for Silver are momentarily hesitant; by Market Values, Gold is (in real-time) -158 points below its smooth valuation line; too by the deMeadville EMAs, the 21-day has crossed beneath the 89-day, plus the daily Parabolics, MACD, Price Oscillator and Moneyflow are all negatively positioned. The Spoo for the moment would elicit a higher open later today for the S&P 500. And ’tis a busy week for the Econ Baro beginning with March’s Factory Orders.
The Gold Update: No. 859 – (02 May 2026) – “Gold’s Year-to-Date Gain Nearly Gone”

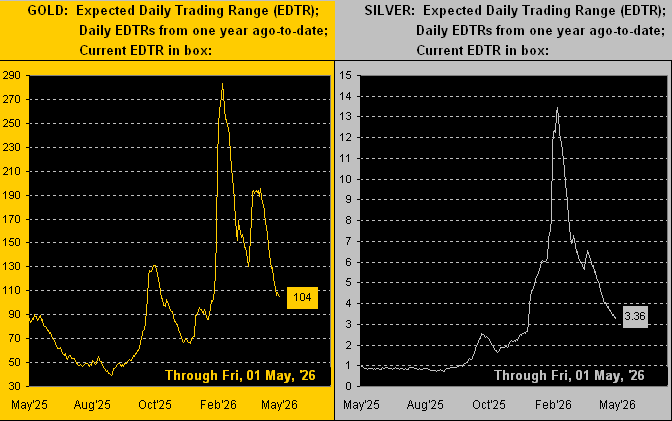
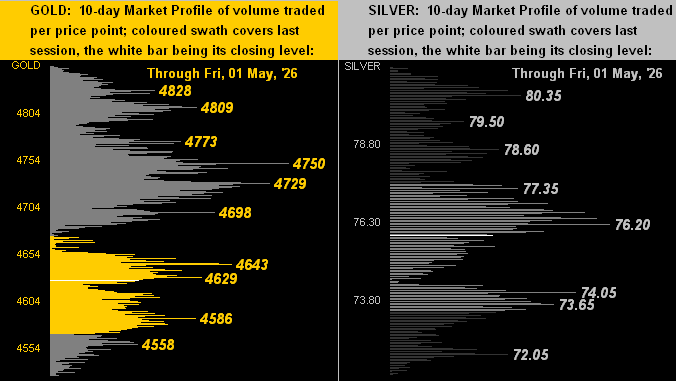
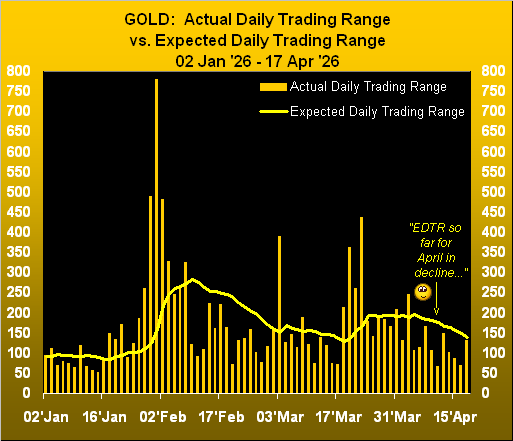
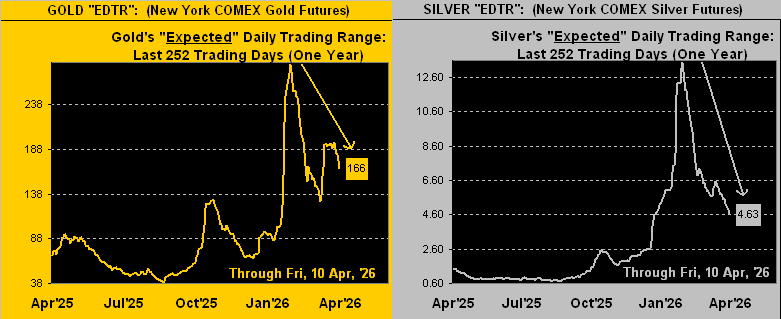
As thereon depicted in the two boxes, Gold’s EDTR going into Monday is now 104 points, only 37% of the expectation for 283 points back its peak on 09 February, and that for Silver is now 3.36 points, just 25% of the 13.46 sought for that same date. As to achieving/exceeding the EDTRs, across the past 28 trading days, Gold has only so done six times and Silver seven. Also notable is a reduction in trading activity: Gold’s average daily contract volume in April was but a scant 65% of that for March, and for Silver ’twas 76%. Cue Pink Floyd’s: ![]() “The Narrow Way”
“The Narrow Way”![]() –[’69].
–[’69].
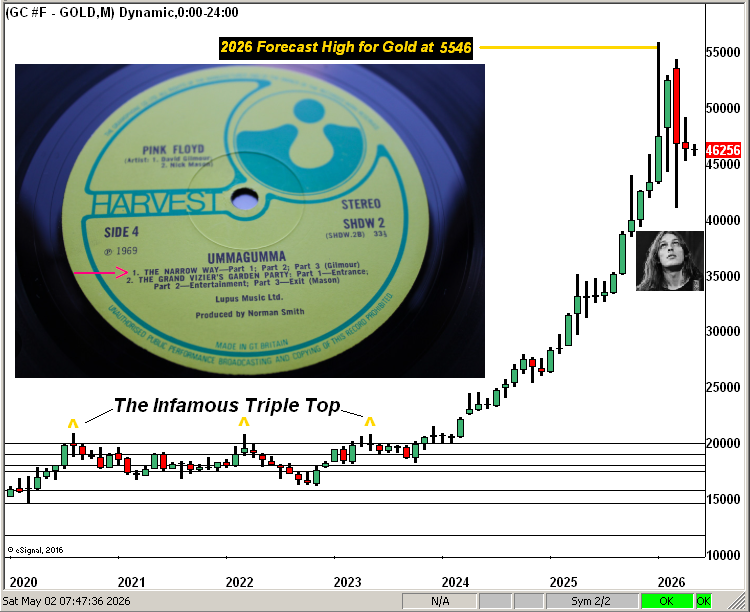
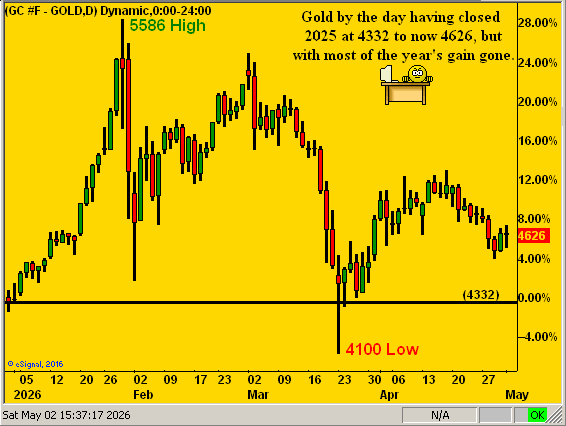
Thus in further review, Gold has given back most of what had been a substantive gain by 29 January of 5586 (+28.9%) to now a vastly reduced +6.8%, albeit having since nicely recovered from March’s 4100 low. To wit, this day-to-day graphic of Gold’s percentage ride since the 4332 (black line) close in 2025, the “lower highs” of both 02 March and 17 April giving at least technical cause for concern:
However, we do not take fundamental pause. Yes, Gold is currently +15.5% above the Gold Scoreboard’s Fair Value of 4005, and could well revisit that level. But hardly shall we allow debasing currency us dishevel!
Cheers!
…m…
www.TheGoldUpdate.com
www.deMeadville.com
and now on “X”: @deMeadvillePro
01 May 2026 – 08:44 Central Euro Time
The Bond, Swiss Franc, Gold and Copper all at present are below their respective Neutral Zones for today; above same is Oil, and BEGOS Markets’ volatility is light. As anticipated, Silver’s linreg (see Market Trends) has joined Gold in rotating from positive to negative; more on the metals’ expectedly down week in tomorrow’s 859th consecutive Saturday edition of The Gold Update. Going ’round the the Market Values horn in real-time for the five primary BEGOS components: we’ve the Bond -2^16 points “low” beneath its smooth valuation line, the Euro -.005 points “low”, Gold -166 points “low”, Oil +7.09 points “high” and the Spoo +475 points “high”, the S&P itself now 16 trading days “textbook overbought”. Were StateSide equities to open at this instant, they’d be a bit higher, and we expect there’ll be much near-term FinMedia babble regaining “Dow 50k”, (as it first briefly had in February), barring it all going wrong. The Econ Baro completes its busy week with April’s ISM(Mfg) Index.
30 April 2026 – 08:41 Central Euro Time
Following three straight days of decline, both precious metals are presently above today’s Neutral Zones, as is Oil; the balance of the BEGOS Markets are within same, and session volatility is moderate. By Market Trends as suggested yesterday, Gold’s linreg has (in real-time) rotated to negative, whilst that for Silver looks to so do by tomorrow despite both metals being up today. Looking at Market Rhythms for pure swing consistency, our Top Three by the 10-test basis are Gold’s daily Moneyflow, Copper’s 8hr Parabolics, and again Gold’s 30mn MACD, whereas per a 24-test basis we’ve Copper’s 30mn Parabolics, the Swiss Franc’s 1hr MACD, and the Spoo’s 1hr Parabolics. Nine metrics come due today for the Econ Baro, including April’s Chi PMI, March’s Personal Income/Spending,“Fed-Favoured” PCE data and Leading Indicators, plus the first peek at Q1 GDP and the Employment Cost Index.
29 April 2026 – 08:44 Central Euro Time
Presently, the Euro is below its Neutral Zone for today, whilst above same are both Copper and Oil; BEGOS Markets’ volatility is light. As we’d already seen for Silver, Gold too yesterday traded down into the “Golden Ratio” retracement zone as noted in The Gold Update: Gold’s low thus far in the week is 4568 whilst that for Silver is 71.93; ‘twould appear by week’s end, both precious metals linregs shall have rotated from positive to negative (see Market Trends); as well, Copper’s “Baby Blues” of trend consistency confirmed dropping below the +80% axis, indicative of lower prices near-term. The S&P 500 is now 14 consecutive trading sessions as “textbook overbought”; and the Spoo by its Market Value is (in real-time) +427 points above its smooth valuation line. There are varying sources for today’s incoming Econ Baro metrics: to be sure, we’ll get March’s Durable Orders, and maybe a combination of February and March data for Housing Starts/Permits, plus perhaps same for New Home Sales, albeit they also are scheduled for next week … on verra… Then at 18:00 GMT comes the FOMC’s “no change” Policy Statement.
28 April 2026 – 08:45 Central Euro Time
The Euro, Swiss Franc, and all three elements of the Metals Triumvirate are presently below their respective Neutral Zones for today; above same is Oil, and session volatility for the BEGOS Markets is moderate, noting therein that Silver already has traced 101% of today’s EDTR (see Market Ranges). Too, Silver’s cac volume is rolling from May into that for July. At Market Trends, the “Baby Blues” of regression trend consistency continue to fall for the precious metals; indeed Silver has today reached down into the “Golden Ratio” retracement range as cited in the current edition of The Gold Update; as well, both Gold and Silver are now trading below the bottom of their 10-day Market Profiles. The S&P 500 has again recorded closing (7174) and intra-day (7179) highs, and is now 13 consecutive trading days “textbook overbought”; the “live” (futs-adj’d) P/E is 48.8x. The Econ Baro awaits Consumer Confidence for April.
27 April 2026 – 08:40 Central Euro Time
Early on we’ve the Bond at present below its Neutral Zone for today, whilst above same is Oil; volatility for the BEGOS Markets is light-to-moderate. The Gold Update points to last week’s decline in the “Baby Blues” of regression trend consistency for both precious metals such that lower price levels are likely in the near-term offing. The S&P 500 concluded Friday at an all-time closing high of 7165, the intra-day high having been a record 7169; by the Spoo, today’s S&P opening ought be mildly lower; per the Spoo’s 10-day Market Profile, price (currently 7188) has its most volume-dominant Profile support at 7162. Copper’s cac volume is rolling from May into that for July. And whilst nothing is due today for the Econ Baro, ’tis a busy week with 14 scheduled metrics, plus the “no change” FOMC Policy Statement on Wednesday.
The Gold Update: No. 858 – (25 April 2026) – “Likely Lower Levels for the Precious Metals”

“Ahh, the breaking down of the ‘Baby Blues’, right mmb?”
Exactly so, Squire. The baby blue dots of 21-day linear regression trend consistency have been a favoured leading indicator of deMeadville for many years. (As a valued reader wrote to us better than a decade ago: “Let me not forget to tip my hat to the Baby Blues – they have made my trading far more successful and less stressful!”)
And specific to the above case for both Gold on the left and for Silver on the right, their respective “Baby Blues” have fallen through the key +80% axis per the red-encircled dots, the rule there being likely lower levels near-term.
To wit, the fine team from our “There’s No Holy Grail Dept.” assembled this table of “Baby Blues” sell signals for both Gold (four) and Silver (five) from a year ago-to-date, even as we hasten to state that “Shorting Gold is a bad idea.” The maximum points and monetary losses/contract within the ensuing 21 trading days (one month) are therein compiled, the two new fresh signals with “???”:
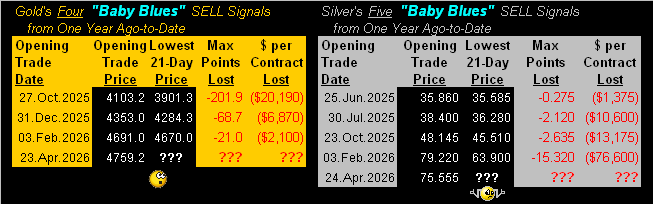
Thus, as an appropriate musical ditty: ![]() “Where Do We Go From Here?”
“Where Do We Go From Here?”![]() –[Chicago, ’70]
–[Chicago, ’70]
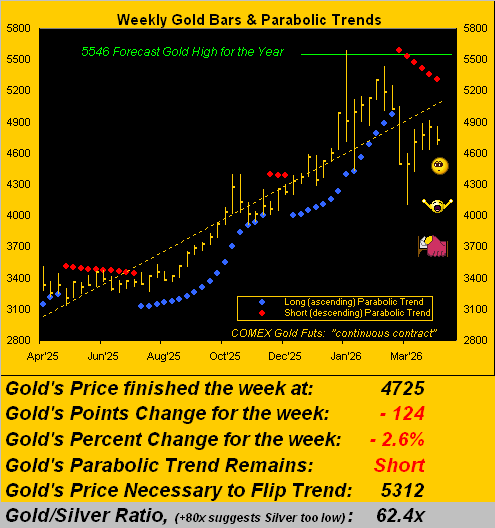
‘Course, ’tis unknown as to how low the precious metals shall go, if at all. And by price structure, we don’t see anything helpfully tangible. So we went instead to ol’ Leonardo “Fibonacci” Bonacci to find some reasonable expectation for the downside. And here’s what “The Fibster” found:
- For Gold (June contract): it settled yesterday (Friday) at 4725. The dominant recent low was 4129 (22 March) and dominant high 4918 (17 April). Thus the Golden Ratio retracement range spans from 4616 (-38.2%) down to 4430 (-61.8%).
- For Silver (May contract): it settled yesterday (Friday) at 75.69. The dominant recent low was 61.21 (likewise on 22 March) and dominant high 83.25 (likewise on 17 April). Thus the Golden Ratio retracement range spans from 74.21 (-38.2%) down to 69.63 (-61.8%).
All that, just in case you’re scoring at home. Preferably however, Gold and Silver simply resume higher. Yet, ad nauseam we repeat: “Follow the Blues instead of the news, else lose yer shoes.”
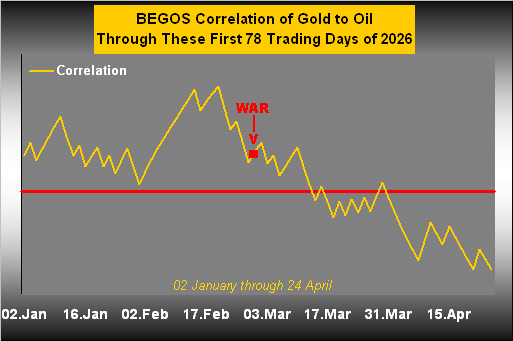
Either way, to be sure, Gold and “Big Oil” have been in a war phase of negative correlation. Restrain the transit of Oil and the price rises. In turn, the demand for Dollars with which to purchase Oil also rises. And whilst we’ve on occasion demonstrated over the years that “Gold plays no currency favourites”, in these warring times, the knee-jerk reaction is to sell Gold given the oxymoronic condition known as “Dollar strength”, which on balance (albeit not very consistently) been the case since the USA/IRN war commenced on 28 February. Indeed in the past week alone, the Buck made “higher daily highs” each of Monday through Thursday, although the “war-high” Dollar Index level of 100.500 remains above the current 98.340 level.
But the point is: rising Oil has led to declining Gold as we look at their BEGOS Markets (Bond / Euro / Gold / Oil / S&P 500) correlation through these first 78 trading days of 2026. Note the red square marking the war’s commencement, (Gold then 5296 vs. 4725 today, i.e. -10.8%). Beneath the red axis indicates negative correlation:
Toward closing, on a nightly basis for the website we run 405 Market Rhythm studies across all of the BEGOS Markets. And whilst nothing works in perpetuity for any market study, that which has been best for Gold through its last 10 swings is the four-hour Price Oscillator, (which is a “canned” study supplied by high-level data providers). In running this particular study through the deMeadville number-crunching, we found it to have reached an “in hindsight“ profit objective of at least 56 points 10-times in-a-row, (from 05 February-to-date with an average duration per swing of five calendar days). At $100/point/contract, here’s that “in hindsight“ profit picture:
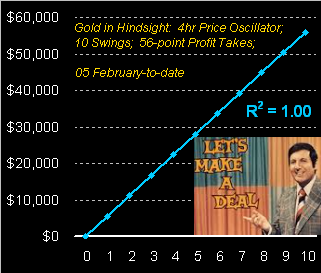
Again we emphasize the above results are “in hindsight“.
“Yeah, but still, mmb, ten times back-to-back is amazing!”
Squire, this is where — again — cash management is of critical concern. You may recall the French Revolution survivor Pierre-Simon, Marquis de Laplace. Per his infamous “Rule of Succession”, in this case for something having occurred ten consecutive times, the probability of an eleventh like occurrence is mathematically 91.67%. HOWEVER (emphasized), in the reality of trading, the actual probability is 50.00%. Period. Do try not to get carried away.
But should precious metals near-term slip away, ‘tis good to still have Gold along the way!
Cheers!
…m…
www.TheGoldUpdate.com
www.deMeadville.com
and now on “X”: @deMeadvillePro
24 April 2026 – 08:40 Central Euro Time
Into week’s end we’ve at present Gold, Silver and Oil below today’s Neutral Zones; the other five BEGOS Markets are within same, and volatility for the session is light. Following (per yesterday’s comment) Gold having confirmed on Wednesday the “Baby Blues” of linreg consistency having moved below their key +80% axis, price since has dropped to as low as 4672; too, Silver’s “Baby Blues” yesterday confirmed moving below their +80% axis; more of course in tomorrow’s 858th consecutive Saturday edition of The Gold Update. The S&P 500 made a marginal record intraday high yesterday to (precisely) 7147.78, (the prior such high being on 17 April at 7147.52); the Index is now 11 consecutive days “textbook overbought”. The Econ Baro concludes its quiet week with the revision to April’s UofM Sentiment Survey.
23 April 2026 – 08:48 Central Euro Time
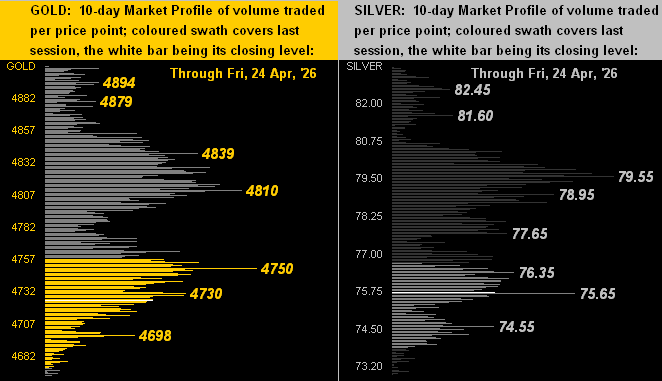
The Bond, Gold, Silver, Copper and the Spoo are all presently below today’s Neutral Zones; only Oil is above same, and BEGOS Markets’ volatility is mostly moderate, noting that Copper already has traced 103% of today’s EDTR (see Market ranges). By Market Trends, ironically Oil is the sole BEGOS component in negative linreg, as today at 94.23 price is well-down from 117.63 peak of three weeks ago. Thus Gold’s linreg is positive, however, its “Baby Blues” of trend consistency confirmed settling below the key +80% level yesterday such that still lower prices “ought be” in the near-term offing. Currently 4733, the mid-4600s would seem a reasonable destination, below which there is trading congestion through 4600-4400 zone; for pure swing consistency, Gold’s best Market Rhythms have been the daily Moneyflow (10-test basis) and the 15mn Moneyflow (24-test basis). For the Econ Baro we’ve just the usual Initial Jobless Claims from the prior week.
22 April 2026 – 08:42 Central Euro Time
All three elements of the Metals Triumvirate are at present above their respective Neutral Zones for today, whilst below same is Oil; volatility for the BEGOS Markets is mostly light, the largest EDTR tracing to this point being Oil at 49% (see Market Ranges). Oil’s best Market Rhythm for pure swing consistency on a 10-test basis is the 1hr MACD, whilst on a 24-test basis ’tis the 15mn Parabolics; Oil’s 21-day linreg trend is slightly becoming more negative as the “Baby Blues” of trend consistency have fallen below the 0% axis (see Market Trends); and by its Market Profile, Oil (currently 88.77) is trading below its most volume-dominant price for the past fortnight of 89.70. Nothing is due today for the Econ Baro. And Q1 Earnings season for the S&P 500 continues to run at an above-average pace: with 53 constituents thus far having reported, 44 (83%) have improved their quarterly year-over-year bottom lines; at issue, however, remains the dangerously high (futs-adj’d) P/E of 48.2x.
21 April 2026 – 08:44 Central Euro Time
Presently we’ve both precious metals below today’s Neutral Zones; otherwise, the balance of the BEGOS Markets are within same, and volatility is light. From an intra-day standpoint since the past week or two, the markets can best be characterized as “messy”. Regardless, let’s go ’round the horn (in real-time) for the Market Values of the five primary BEGOS components: the Bond is just -0^10 points “low” beneath its smooth valuation line, the Euro 0.013 points “high”, Gold -63 points “low”, Oil -6.16 points “low” (having reverted all the way back to its BEGOS valuation after having been some +34 points “high” at the beginning of April), and the Spoo +457 points “high”, the S&P 500 having completed a fifth consecutive session as extremely “textbook overbought”; too, by our MoneyFlow page (quarterly basis), the S&P “ought be” -597 points lower than ’tis. The Econ Baro looks to March’s Retail Sales and Pending Home Sales, plus Business Inventories for February.
20 April 2026 – 08:46 Central Euro Time
With events in the Middle East taking a negative turn, the BEGOS Markets today featured various “gap” openings, notably Oil which settled Friday at 85.57 opened up at 88.15, Gold from 4849 down to open at 4812 and the Spoo from 7164 down to open at 7103. At present, the Bond, Gold, Silver and Spoo are below today’s Neutral Zones, whilst Oil is above same, and session volatility is mostly moderate. The Gold Update points to price having nearly reverted back up to its BEGOS Market Value, whereas the S&P 500 having set a record high on Friday remains vastly overvalued by earnings (fundamental) as well as extremely “textbook overbought” (technical). Nothing is due today for the Econ Baro with a very light load in the week’s balance of just six incoming metrics. However, Q1 Earnings Seasons really starts to ramp up as its third week gets underway.
The Gold Update: No. 857 – (18 April 2026) – “Gold’s Means Reversion; S&P’s Record Excursion”

Moreover, in each trading day’s Prescient Commentary we cite the stance of the BEGOS Markets relative to their “Neutral Zones”: be a market higher or lower, if its price is within that day’s Neutral Zone, we deem the day as essentially “unchanged”. And across Gold’s past 10 trading days, five have concluded within the Neutral Zone.
“It’s kinda like that Chris Isaac song, right mmb?”
Squire is referring to the ’95 tune about the girl with dirty blonde hair wearing a taupe miniskirt whilst standing with her overnight case in the Greyhound bus station: ![]() “Goin’ Nowhere”
“Goin’ Nowhere”![]() .
.
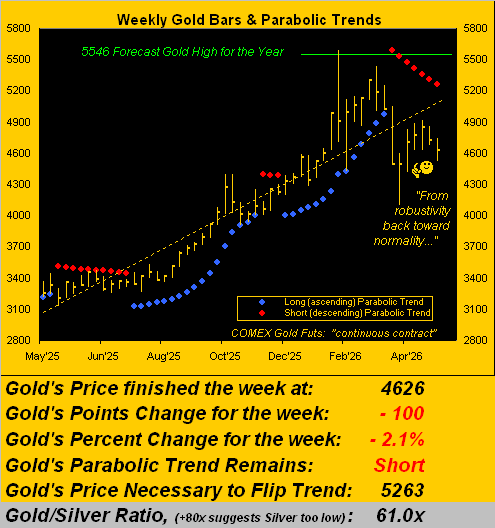
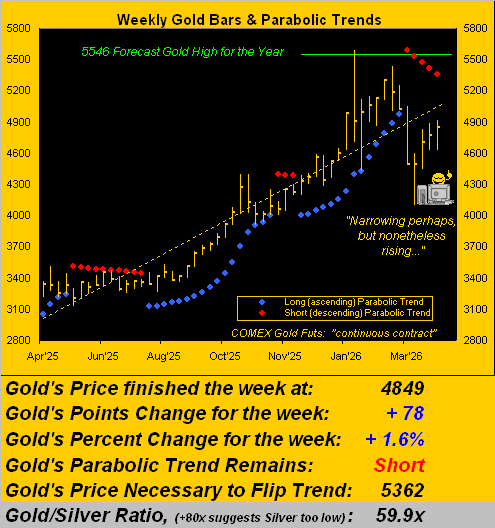
Not that Gold’s hasn’t gone anywhere. Price year-to-date has spanned from 5586 (our forecast high 5546) down to 4100 (our forecast low 4136), a range of -1486 points (-26.6%). ‘Course, with 179 trading days remaining in 2026, ’tis far too soon to “take credit” that we “nailed it”. But range has been nonetheless narrowing. Both of the past two weeks have recorded notably narrower trading ranges (262 and 292 points chronologically) than those of the three prior (571, 501 and 413 chronologically). So to Gold’s weekly bars we go, the red-dotted parabolic Short trend having completed its fifth week, such stance having commenced back on 16 March when priced opened at 5010:
Now we just made reference to the S&P 500, the mighty Index overvalued, overbought and overhyped beyond belief.
“Well, mmb, they say the war is winding down…”
Squire, it puts us in mind of the old saying “There’s been a sudden breakout of peace”, albeit so called “cease fires” carry a rather temporary tone. And now we’ve just learned the Straits of Hormuz have again been “closed”.
Regardless, ’twas but seven missives ago on 28 February that we penned “… in setting this morning to write our 850th consecutive Saturday missive, we’ve just learned of the commencement of USA/ISR attacks on IRN…” The S&P then was 6879, Oil 67.29 and Gold 5296. Today, Gold is -8% lower at 4849, Oil +27% higher at 85.57 (and at one point was +75% higher at 117.63) and the S&P now +4% higher at the record closing high of 7126. Were not higher energy prices to wreak havoc on corporate earnings?
To be sure, only the single war month of March is included in this Q1 Earnings Season, which whilst still quite young for the S&P 500 has thus far been excellent: 30 constituents have reported, of which 25 — that’s 83% — have bettered their bottom lines over Q1 of a year ago. Going as far back as 2017, the average quarterly year-over-year improvement is 66%. ![]() “Happy Days Are Here Again”
“Happy Days Are Here Again” ![]() –[Ager/Yellen, ’29]. However, problematic as we’ve time and again mentioned is that the nominal level of earnings need really to double toward supporting the stratospherically high level of the S&P; the median increase thus in Q1 earnings Season far is “only” +20% — which actually is great — but ’tis not the +100% “requisite” to get earnings in line with price.
–[Ager/Yellen, ’29]. However, problematic as we’ve time and again mentioned is that the nominal level of earnings need really to double toward supporting the stratospherically high level of the S&P; the median increase thus in Q1 earnings Season far is “only” +20% — which actually is great — but ’tis not the +100% “requisite” to get earnings in line with price.
Yet, so happy are the S&Pers that they’ve driven up the Index to now being (by our technical cocktail of Relative Strength, Stochastics and John Bollinger’s Bands) extremely “textbook overbought”, the price/earnings ratio a laughable 48.7x, with a pitifully puny yield of 1.127%, whereas noted in the opening Gold Scoreboard, the three-month annualized U.S. T-Bill yield is 3.600%. Again, that’s more than triple the S&P’s dividend return and you shan’t lose your money … at least not until the U.S. Treasury defaults and/or the Buck gets nixed as the world ‘s reserve currency. For you WestPalmBeachers down there, that is why you want to own Gold.
Meanwhile, to the suddenly sagging Econ Baro we go, ignored ‘natch by an S&P all aglow, the high P/Es list pulled from the website you know:
Toward our wrap, here’s the stack:
The Gold Stack (continuous contract pricing):
Gold’s All-Time Intra-Day High: 5586 (29 January 2026)
2026’s High: 5586 (29 January)
Gold’s All-Time Closing High: 5411 (28 January 2026)
The Weekly Parabolic Price to flip Long: 5362
10-Session directional range: up to 4908 (from 4628) = +280 points or +6.1%
Gold’s BEGOS Market Value (from our opening “Scoreboard”): 4905
Trading Resistance: vis-à-vis the Market Profile, 4880 – 4910
Gold Currently: 4849, (expected daily trading range [“EDTR”]: 135 points)
Trading Support: vis-à-vis the Market Profile, the lower 4800s
10-Session “volume-weighted” average price magnet: 4785
2026’s Low: 4100 (23 March)
Gold’s Fair Value per Dollar Debasement, (from our opening “Scoreboard”): 3937
The 300-Day Moving Average: 3863 and rising
The 2000’s Triple-Top: 2089 (07 Aug ’20); 2079 (08 Mar’22); 2085 (04 May ’23)
The Gateway to 2000: 1900+
The Final Frontier: 1800-1900
The Northern Front: 1800-1750
On Maneuvers: 1750-1579
The Floor: 1579-1466
Le Sous-sol: Sub-1466
The Support Shelf: 1454-1434
Base Camp: 1377
The 1360s Double-Top: 1369 in Apr ’18 preceded by 1362 in Sep ’17
Neverland: The Whiny 1290s
The Box: 1280-1240
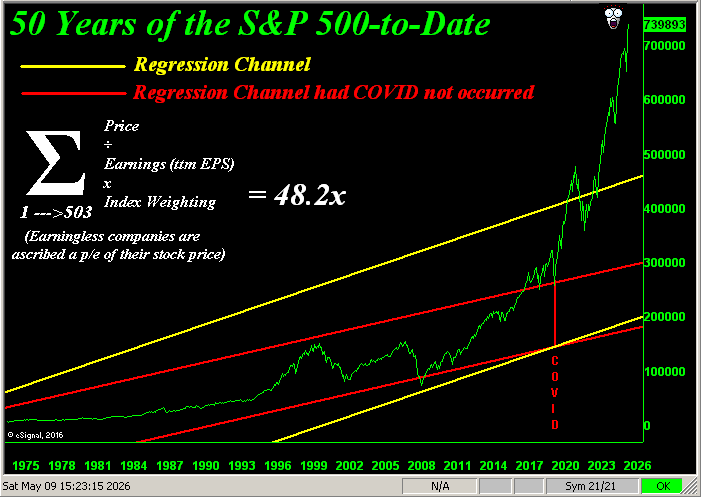
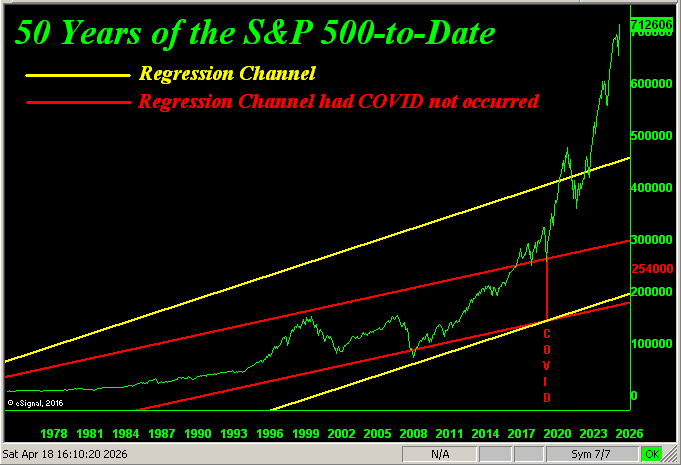
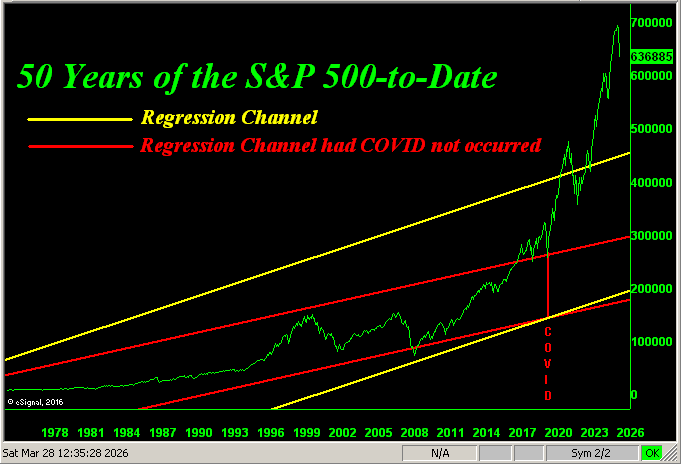
So as Gold gathers itself via means reversion, the S&P 500 has made a record high excursion. But is it really that impressive? After all, year-to-date Gold is now +11.9%, whereas the S&P is comparably +4.1%. Still, truth be told, both markets are fundamentally overvalued, Gold per its Fair Value and the S&P by its high (understatement) P/E. Gold indeed reverted well back down toward Fair Value when price plummeted to 4100 just this past 23 March, (Fair Value then 3890). But what about for the S&P? How far would price have to fall to bring the present dividend yield of 1.127% up to match the aforementioned T-Bill’s 3.600%? We put the question to “AI” (“Assembled Inaccuracy”), which responded thus:
- “Based on recent market data as of mid-April 2026, the S&P 500 would need to fall approximately 4,586 points to increase the dividend yield from 1.127% to 3.600%.”
Naturally, we followed-up with the math to find ‘twould be an S&P 500 “correction” of -64% to 2540 — right in the heart as below marked of the extrapolated “had COVID not occurred” red regression channel … just in case you’re scoring at home:
Query: How are those Gold n’ Silver holdings workin’ out for ya?
Cheers!
…m…
www.TheGoldUpdate.com
www.deMeadville.com
and now on “X”: @deMeadvillePro
17 April 2026 – 08:43 Central Euro Time
Presently, all eight BEGOS Markets are within their respective Neutral Zones for today, and session volatility is very light. The Bond (currently 113^20) yesterday moved under Market Profile support (114^06 now resistance) and price slid below the Market Magnet (114^01); nonetheless, by its Market Trend, the Bond’s linreg is positive and improving upside consistency given the rising “Baby Blues”. Gold again has been recording a comparatively narrow week; the yellow metal’s EDTR (see Market Ranges) has compressed from 196 points two weeks ago to now 140 points; further insight per tomorrow’s 857th consecutive Saturday Edition of The Gold Update. Nothing is due for the Econ Baro until next Tuesday. And Q1 Earnings Season for the S&P 500 is off to a well above-average start: of the 26 constituents having thus far reported, 22 (85%) have bettered their quarterly year-over-year bottom lines; problematic is that the nominal level of earnings is too low to support an S&P here at 7041, given the “live” (futs-adj’d) P/E of 47.8x.
16 April 2026 – 08:44 Central Euro Time
The S&P settled above 7000 yesterday at a record closing high of 7023, (intra-day 7026); the “live” (futs-adj’d) P/E is now 47.6x and the yield 1.126%, (that for the 3mo T-Bill annualized is 3.612%). At present for the BEGOS Markets, both Silver and Copper are above today’s Neutral Zones, the balance of the bunch being within same; session volatility is again light. By Market Values, the Spoo (in real-time) is +327 points above its smooth valuation line; the MoneyFlow for the S&P has notably improved so far this week; however by our broadest measure (63 days, i.e. one quarter), the Flow finds the Index +607 points too high. Cac volume for Oil has rolled from May into that for June with priced discounted by -2.80 points. And the Econ Baro completes its early week with metrics including April’s Philly Fed Index and March’s IndProd/CapUtil.
15 April 2026 – 08:45 Central Euro Time
Presently, Oil is the only BEGOS Market outside (below) its Neutral Zone for today; session volatility is light. Copper in recent days has regained the 6 handle: currently 6.0950, the red metal’s all-time high of 6.5830 was set this past 29 January; by Market Rhythms for pure swing consistency, Copper’s Parabolics on the 15mn, 30mn, and 1hr time frames are topping its list. Gold is moving closer to its BEGOS Market Value of 4975, price at present 4839. The S&P 500 yesterday reached up to 6969, the all-time high being 7002 (28 January): the Index has rapidly become extremely “textbook overbought” having just been oversold from 06 March through 02 April and the MoneyFlow having been weak, (although that for yesterday was firm). The Econ Baro looks to April’s NY State Empire Index and NAHB Housing Index, plus March’s Ex/Im Prices. Then late in the session comes the Fed’s Tan Tome.
14 April 2026 – 08:41 Central Euro Time
Silver is at present the sole BEGOS Market outside (above) its Neutral Zone for today; session volatility is quite light. The Euro yesterday confirmed settling above its BEGOS Market Value for the first time since 29 January, the Dollar Index having in recent days fallen from the 100s into the 98s; our top Market Rhythm by pure swing consistency for the Euro on a 10-test basis is its 30mn MACD, whilst on a 24-test basis the Euro’s two standout studies are its 30mn Moneyflow and 2hr Parabolics. At Market Trends, we’ve now positively-sloped linregs for the Bond, Euro, Copper, Oil and the Spoo; thus negatively-sloped are the linregs for the Swiss Franc, Gold and Silver. The Econ Baro awaits March’s PPI, (which by annualizing the consensus expectation is expected to run well above the Fed’s +2.0% target).
13 April 2026 – 08:43 Central Euro Time
Given the failure of the U.S./Iran talks, ’twas no surprise to see — save for Oil — the seven other BEGOS Markets drop at today’s open: at present, the Bond, EuroCurrencies, Silver and Spoo are below today’s Neutral Zones, (Gold and Copper actually are within same), and Oil of course is well-up, currently +8.4% at 103.64. Despite the on-balance negative start to the day, session volatility is to this point light-to-moderate. The Gold Update cites price’s range as “narrowing”, but the stance of inflation as “harrowing”, such that the Fed in due course this year may have to raise rates. The Econ Baro starts a moderate week of incoming data with March’s Existing Home Sales. And Q1 Earnings Season enters its second week, the financials getting the emphasis.
The Gold Update: No. 856 – (11 April 2026) – “Gold Range Narrowing; Inflation Gauge Harrowing”

“But with prices up so much from a year ago, how about by percentage instead of points, mmb?”
Squire, by either method, precious metals’ volatility today is essentially double that of a year ago, yet as noted, remarkably reduced from the recent price-spiking in February. To wit this table (in reverse chronological order):
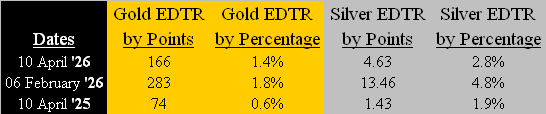
The “point” is: with all that is in play these days, the daily trade of both Gold and Silver has become a bit more contained, even if considerable vis-à-vis this time in 2025.
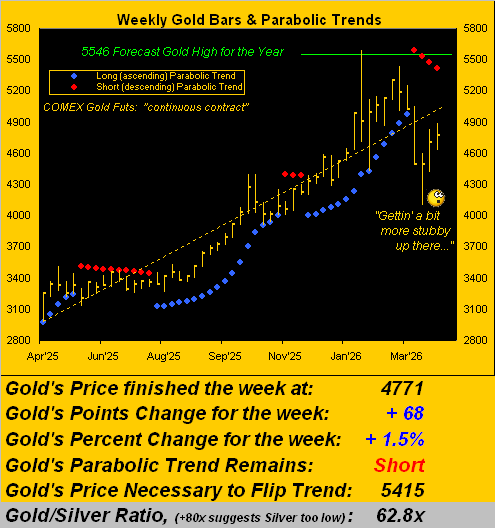
Still, as we turn to Gold’s weekly bars and parabolic trends from a year ago-to-date, notwithstanding a fourth rightmost red Short dot, price has posted both “higher highs” and “higher lows” for two consecutive weeks in perceivably pursuing a return to the ascending dashed trendline. This past week’s low-to-high range of +262 points (+5.7%) ranks narrowest of the past four, despite its expected weekly trading range having anticipated a span of 369 points:
…and hardly shall the now underway Q1 Earnings Season find bottom lines for the S&P having doubled, (which for those of you scoring at home would halve the price/earnings ratio to a more realistic level). Fortunately with Gold, you’ll always be on the right level!

“Oh now yer really ‘tawkin’, mmb!”
Absolutely, Squire.
Cheers!
…m…
www.TheGoldUpdate.com
www.deMeadville.com
and now on “X”: @deMeadvillePro
10 April 2026 – 08:38 Central Euro Time
As we saw ’round this time yesterday, trading in the BEGOS Markets is quite narrow, all eight components at present within today’s Neutral Zones and volatility is very light, albeit in the context that trading ranges have expanded significantly in recent months. Yesterday’s PCE data for February was not Fed-friendly as we’ll further display in tomorrow’s 856th consecutive Saturday edition of The Gold Update. The leading MoneyFlow for the S&P 500 cautiously suggests lower levels are ahead: by our page thereto, on the one-week basis the Index “ought be” -91 points lower than ’tis (currently 6825), on the one-month basis -139 points lower, and on the one-quarter basis a more dire -807 points lower; as trading/investing entities start to sense this going forward, it can pressure prices. The Econ Baro wraps the week with April’s UofM Sentiment Survey, March’s CPI and Treasury Deficit, plus February’s Factory Orders.
09 April 2026 – 08:45 Central Euro Time
“Quiet” is the watchword for the BEGOS Markets thus far, all eight at present within their respective Neutral Zones for today; session volatility is exceptionally light. That noted, there still exist some near-term valuation extremes are we go ’round the horn for the Market Values of the five primary BEGOS components, where in real-time we’ve: the Bond -3^19 points “low” below its smooth valuation line, the Euro -0.015 points “low”, Gold -377 points “low”, Oil +13.79 points “high” and the Spoo -67 points “low”. Yesterday’s net -12.5% drop in Oil was sufficient to confirm price settling below its Market Magnet of 101.50, (currently price 97.52). Yesterday’s MoneyFlow into the S&P 500 was not fully supportive of the +2.5% up move, such leading indicator instead (regressed into S&P points) being +1.7%. The Econ Baro awaits metrics including the “Fed-favoured” PCE data for February, plus that month’s Personal Income/Spending and Wholesale Inventories, as well as the final revision to Q4 GDP.
08 April 2026 – 08:48 Central Euro Time
Suspension for two weeks of the war sees Oil down as much as -17.5% from last evening’s settle, current price 94.80 and below its Neutral Zone for today; above same are all the seven other BEGOS Markets, and session volatility (not surprisingly) is mostly robust. The Dollar Index is down more than -1% for third time year-to-date; the EuroCurrencies thus are getting a strong bid, the Euro itself by Market Trends finding its linreg having rotated from negative to positive, (that for the Swiss Franc lagging in such respect). Gold up to 4888 is nearly a three-week high: recall that Gold by its BEGOS Market Value has been deeply oversold, such real-time reading still finding price -285 points below its smooth valuation line. And the Spoo is firm such that were the S&P 500 to open at this instant, ‘twould so do +2.7%. Whilst nothing is due today for the Econ Baro, late in the session we’ve the FOMC 17/18 March meeting minutes.
07 April 2026 – 08:45 Central Euro Time
Oil is the sole BEGOS Market at present outside (above) today’s Neutral Zone; session volatility to this point is light. By their Market Profiles, the Bond, Swiss Franc and Spoo all moved yesterday above their most volume-dominant prices for the past 10 trading days, whilst Silver dropped below same, albeit today there so far lacks much continued direction. Looking at our best Market Rhythms for pure swing consistency: on a 10-test basis we’ve Gold’s 2hr Parabolics, Copper’s 6hr Moneyflow and the Euro’s 1hr Parabolics; on a 24-test basis the leaders are Copper’s 15mn Parabolics, the non-BEGOS Yen’s 30mn Price Oscillator and the Euro’s 30mn Moneyflow. The Econ Baro awaits February’s Durable Orders, plus late in the session that month’s Consumer Credit. And Q1 Earnings Season is officially underway: for Q4, 71% (an above-average pace) of S&P 500 reporting constituents bettered their bottom line of Q4 a year earlier.
06 April 2026 – 08:49 Central Euro Time
‘Tis Easter Monday on this side of The Pond, but StateSide ’tis a full trading day for the BEGOS Markets, for which at present we’ve Copper as the sole component outside (below) its Neutral Zone for today; session volatility is light. The Gold Update underscores the yellow metal’s record Q1 price volatility, overwhelming that which we’ve seen across the prior 25 years. And whilst by Market Trends the linregs remain negative for all of the BEGOS except Oil, the “Baby Blues” of trend consistency are rising notably for the Metals Triumvirate, the Bond and Spoo. The Econ Baro has a very busy week of 15 incoming metrics, including February’s “Fed-favoured” PCE data (Thursday) such that we’ll complete our inflation table through that month. Today for the Baro comes March’s ISM(Svc) Index.
The Gold Update: No. 855 – (04 April 2026) – “The Vehement Volatility of Gold”

Still, both Gold and Silver are on the podium. But clearly the S&P 500 being -3.8% is certain to cause chaotic confusion for the “stocks only go up” crowd. The chilling news for such “marked-to-market millionaires” is that across the past 50 years, (which for you WestPalmBeachers down there is from 1976 through 2025), the S&P has netted 24% (i.e.12 years) that were negative … but there’s been only one down year in the past seven. Think the S&P is overwhelmingly due for a down year, or two? Reprise Murray Head from back in ’75: ![]() “Say it ain’t so, Joe”
“Say it ain’t so, Joe”![]() . Have a great day.
. Have a great day.
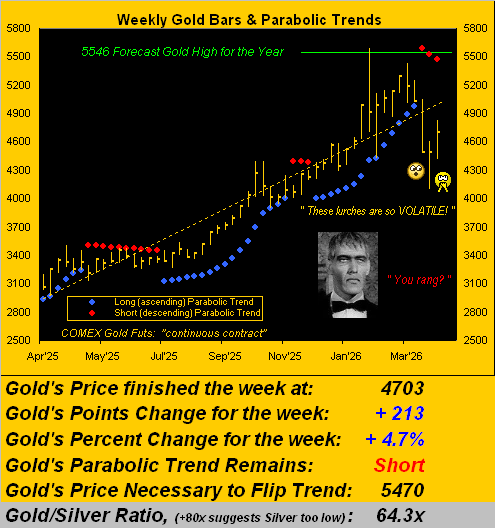
To be sure, Gold’s days are vehemently volatile, indeed as are its weeks per the following year-over-year graphic. The expected weekly trading range for Gold is now 369 points, the daily alone being 196 points. Either way — of which there’s been a lot — the red parabolic Short trend has completed a third dot. But at least Gold’s four-week losing streak is complete, this past week’s +4.7% gain a welcome treat. Moreover, Gold is still “textbook oversold” through the past 13 trading days; that would resolve upon Gold swiftly closing above 4797. ‘Course, by the opening Scoreboard, Gold is nearly -10% below its BEGOS Market Value (5220), but ’tis practically +20% above Fair Value (3930).
Now again, it being month-end, ’tis our own trend to present Gold by its monthly bars since 2020. And per ![]() “March, the Mad Scientist”
“March, the Mad Scientist”![]() by Jethro Tull from 50 years ago, this past March for the Gold bulls was maddening. ‘Tis the second right-most “candle”, which as jarringly red as it appears, finished March well off the aforementioned 4100 low. Then the right-most wee “doji” is this April’s two trading days pro tanto, (a little Latin lingo there). Here’s the whole show:
by Jethro Tull from 50 years ago, this past March for the Gold bulls was maddening. ‘Tis the second right-most “candle”, which as jarringly red as it appears, finished March well off the aforementioned 4100 low. Then the right-most wee “doji” is this April’s two trading days pro tanto, (a little Latin lingo there). Here’s the whole show:
All that said, next week is the commencement of Q1 Earnings Season. You’ll recall those for Q4 found 71% of the S&P’s reporting constituents having improved their bottom lines from the like quarter a year earlier. Can such above average pace be maintained? The Baro suggests yes, but an ongoing energy crisis can eventually erode earnings. ‘Course as we oft quip, if earnings today were properly used as an equities’ valuation tool, the S&P would be half its current level, (the current price/earnings ratio still a whoppingly high 43.5x). But: ’tis different these days (until ’tisn’t).
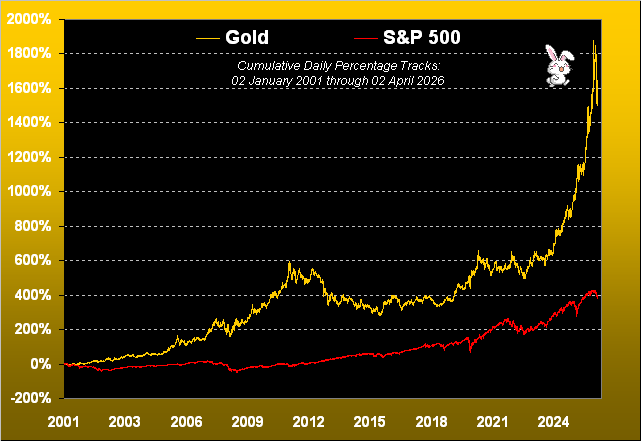
In the meantime — for those of you scoring at home — the S&P 500 (pre-yield) is +399% century-to-date (or with yield, nearly +500%); the yieldless relic — vehemently volatile Gold — is +1,618%.
So what’s in your bunny basket?
Cheers!
…m…
www.TheGoldUpdate.com
www.deMeadville.com
and now on “X”: @deMeadvillePro
03 April 2026 – 08:39 Central Euro Time
As noted yesterday, whilst today is a holiday for western bourses, because of the exceptional occurrence of this Good Friday falling on the first Friday of the month when StateSide Payrolls are released, the Bond, Currencies and Spoo are in abbreviated trading sessions such that they can respond to the data; none of those BEGOS Markets have (as yet) moved materially. Tomorrow brings the 855th consecutive Saturday Edition of The Gold Update, indeed our month and quarter-ending piece. Happy Easter!
02 April 2026 – 08:21 Central Euro Time
‘Tis the final trading day of the week, wherein at present — save for Oil being above its Neutral Zone for today — we’ve nothing but red for the seven other BEGOS Markets, all below said Zones; session volatility is mostly robust following the U.S.’ intent to ramp up war operations toward completion. As provisionally noted yesterday, both the Bond and Gold have now confirmed their “Baby Blues” of linreg consistency having crossed above the key -80% axis: however both markets are well down today (Bond -0.8%, Gold -3.8%). Looking at Market Rhythms for pure swing consistency, our leaders (10-test basis) are Copper’s 6hr Moneyflow and both Gold’s 12hr Parabolics and 1hr Price Oscillator; too, (24-test basis), we’ve the non-BEGOS Yen’s 15mn Moneyflow, Gold’s 2hr Moneyflow and Silver’s 30mn Parabolics. Today’s Econ Baro incoming metrics include February’s Trade Deficit. Whilst western bourses are closed tomorrow, we’ll nonetheless have a brief comment, noting that StateSide Payrolls shall be reported, for which the Bond, EuroCurrencies and Spoo have an abbreviated Friday session so as to respond to the data.
01 April 2026 – 08:35 Central Euro Time
Yesterday’s +2.9% net gain in the S&P 500 was the largest since 13 May a year ago (+3.3%); that for Gold of +4.2% was the most since 03 February (+6.2%). At present, the Bond, EuroCurrencies and Spoo are above their respective Neutral Zones for today; the balance of the BEGOS Markets are within same, and session volatility is light-to-moderate. By Market Trends, yesterday both Silver and Copper confirmed their “Baby Blues” of linreg consistency having moved above their key -80% axes, indicative of still higher prices near-term; today, the Blues for Gold have provisionally moved up above same. Oil (98.36) has traded down to just above its most volume-dominant Market Profile price of 98.00. Scheduled metrics for the Econ Baro are March’s ADP employment data and ISM(Mfg) Index, February’s Retail Sales, and January’s Business Inventories.
31 March 2026 – 08:42 Central Euro Time
The final trading day of Q1 finds at present the Bond, Gold, Silver and the Spoo above today’s Neutral Zones; Oil is below same, and BEGOS Markets’ volatility is again moderate. The Bond yesterday moved above what had been volume-dominant Market Profile resistance (112^22), price now a full above above that at 113^22; similarly, Copper moved above same (5.470) to now 5.509; both markets however — as remains the case for every BEGOS component except Oil — are in negative linreg (see Market Trends). Gold (presently 4591) is just beneath its most volume-dominant Market Profile resistor of 4598; too Gold is still considerably below its BEGOS Market Value of 5243, that measure itself having begun to roll over to the downside. The Econ Baro awaits March’s Chi PMI and Consumer Confidence.
30 March 2026 – 08:36 Central Euro Time
Into the new week we’ve at present the Bond, Gold and Copper above today’s Neutral Zones; the balance of the BEGOS Markets are within same, and session volatility is moderate. The Gold Update depicts price as being (by percentage) about equidistant (i.e. “♫ Stuck in the Middle with Gold ♫” between its BEGOS Market Value (some +14% higher than price) and its Fair Value (some -14% lower than price). As to our Market Values for all five primary BEGOS Components (in real-time): we’ve the Bond as -6^30 points “low” beneath its smooth valuation line, the Euro as -0.050 points “low”, Gold as -729 points “low”, Oil as +26.58 points “high”, and the Spoo as -620 points “low”. The Econ Baro is quiet today ahead of 14 incoming scheduled as the week unfolds.
The Gold Update: No. 854 – (28 March 2026) – “♫ Stuck in the Middle with Gold ♫”
In two trading-days time, 2026 shall be 25% complete. And as was calculated back at New Year, our expected yearly trading range for Gold in 2026 came to 1410 points between the low and high. Or by percentage range, were the low to come first, the high would later be +34.1% above the low, else if vice-versa, the low -25.4% below the high, (the latter directionally being the case year-to-date).
But so far through not quite three months, the range has already surpassed our expectation in spanning 1486 points, or -26.6%, from the 29 January high of 5586 down to the 23 March low of 4100. More on Gold’s extremes vis-à-vis what we had precisely forecast come next Saturday’s month-end/quarter-end piece; (a shameless plug, that).
To be sure, from the “Means Reversion Dept.” — barring your having slept through last Monday’s trading session — that day’s low of 4100 was a “mere” +5.4% (+210 points) above Fair Value of then 3890. We say “mere” as by Gold’s All-Time High of 5586, price at that instant was +43.0% (+1681 points) above Fair Value of then 3905; (the latter has since slipped a tad given the immaterially periodic refining of the money supply).
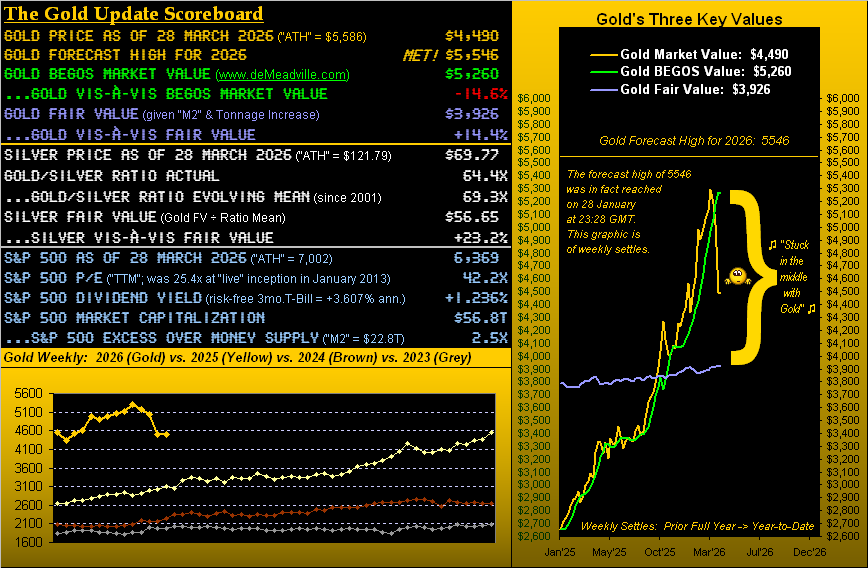
Either way, in settling the week yesterday (Friday) at 4490, Gold per the above opening Scoreboard is now fundamentally +14.4% (+564 points) above Fair Value, but technically is nearly an identical -14.6% (-770 points) below its BEGOS Market Value. Cue ![]() “Stuck in the Middle with You”
“Stuck in the Middle with You”![]() –[Stealers Wheel, ’72]. Cue, too, Gold’s year-over-year track and — just now rolling over — smooth BEGOS valuation line per our proprietary view:
–[Stealers Wheel, ’72]. Cue, too, Gold’s year-over-year track and — just now rolling over — smooth BEGOS valuation line per our proprietary view:
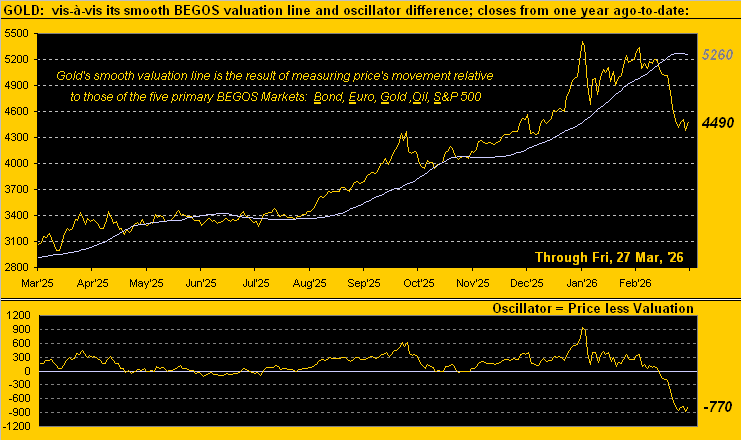
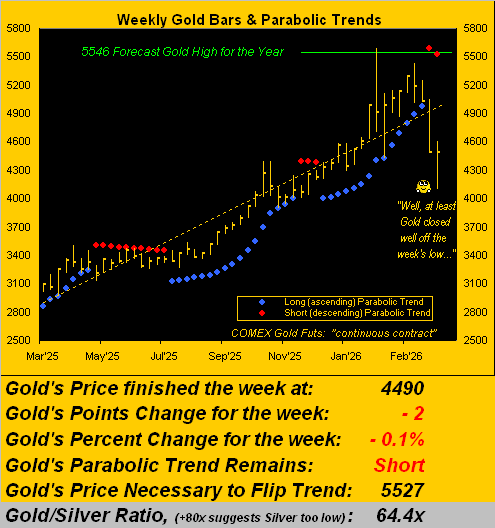
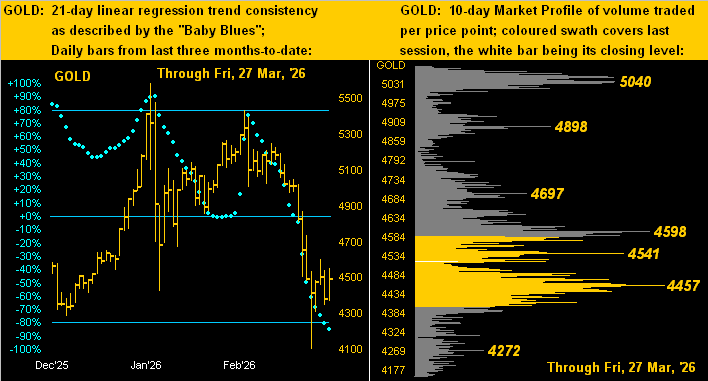
So there we have it: Gold today at 4490 is nearly equidistant between its BEGOS Market Value (5260) which has just begun to descend, and its Fair Value (3926) which is in ascent. So as to where Gold travels near-term, whilst fundamentals remain the ultimate driver of price, the swifter technicals are negative in many respects. As noted earlier for guidance, Gold’s best trading studies are comprehensively tested every night in order to qualify at our Market Rhythms page. Regardless, as herein emphasized, Gold is basically at the midpoint between our two critically important valuation metrics. But in this case, being stuck in the middle clearly is good (dare we say) “Fortuna”!
Cheers!
…m…
www.TheGoldUpdate.com
www.deMeadville.com
and now on “X”: @deMeadvillePro
27 March 2026 – 08:34 Central Euro Time
The Bond currently is below its Neutral Zone for today, whilst above same are all three element of the Metals Triumvirate; session volatility for the BEGOS Markets is again light. Gold’s cac volume is rolling from April into that for June with +33 points of fresh premium; more on Gold, ‘natch, in tomorrow’s 854th consecutive Saturday edition of The Gold Update. The Spoo yesterday moved below its most volume-dominant price (6639) for the past fortnight (see Market Profiles); as fundamentally expensive as is the S&P 500 (“live” futs-adj’d P/E 43.2x), the Index is “textbook oversold” through the last 15 trading days and the Spoo itself is (in real-time) -514 points below its smooth valuation line (see Market Values). The Econ Baro wraps its quiet week with the March revision to the UofM Sentiment Survey.
26 March 2026 – 08:45 Central Euro Time
The Bond, Gold and Silver all are presently below their respective Neutral Zones for today; the balance of the BEGOS Markets are within same, and session volatility is light. The Swiss Franc by its Market Profile yesterday moved below what had been volume-dominant support at 1.280: price is now 1.273; by Market Trends, as is the case for every BEGOS component except for Oil, the Swiss Franc and Euro are in negative linreg, but both are becoming less consistently down as the Dollar Index keeps falling back from the 100 level (currently 99.515). The S&P 500 is basically down -6% from its all-time high (7002): however by our MoneyFlow page, the Index (6592) “ought be” -95 points lower by the five-day measure, -196 points lower by the 21-day measure, and -737 points lower by the 63-day measure; the “live” P/E of the S&P (futs-adj’d) is 44.3x. Today for the Econ Baro we’ve just the usual Initial Jobless Claims from the prior week.