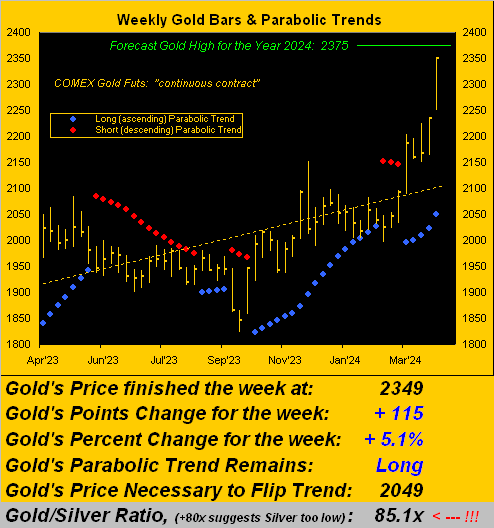
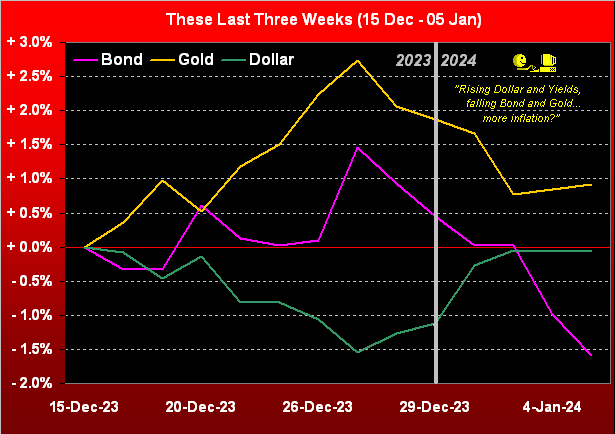
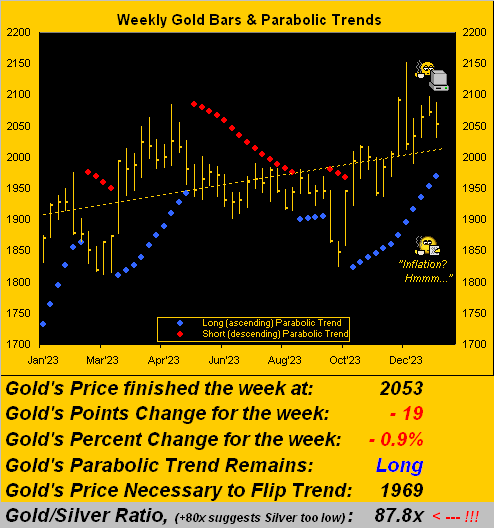
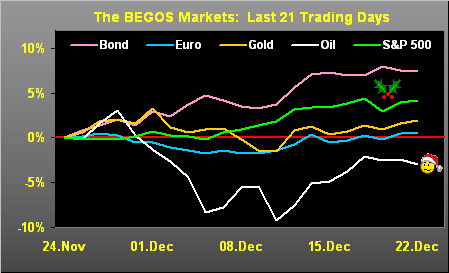
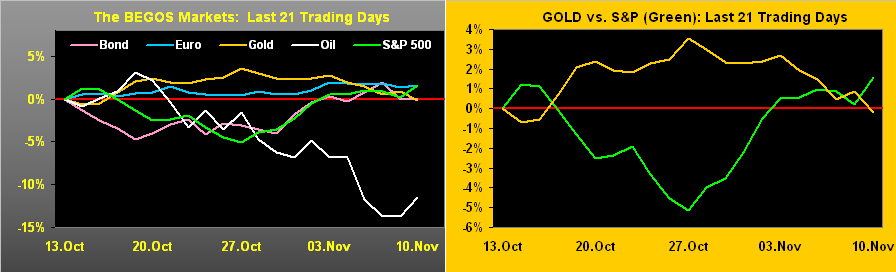
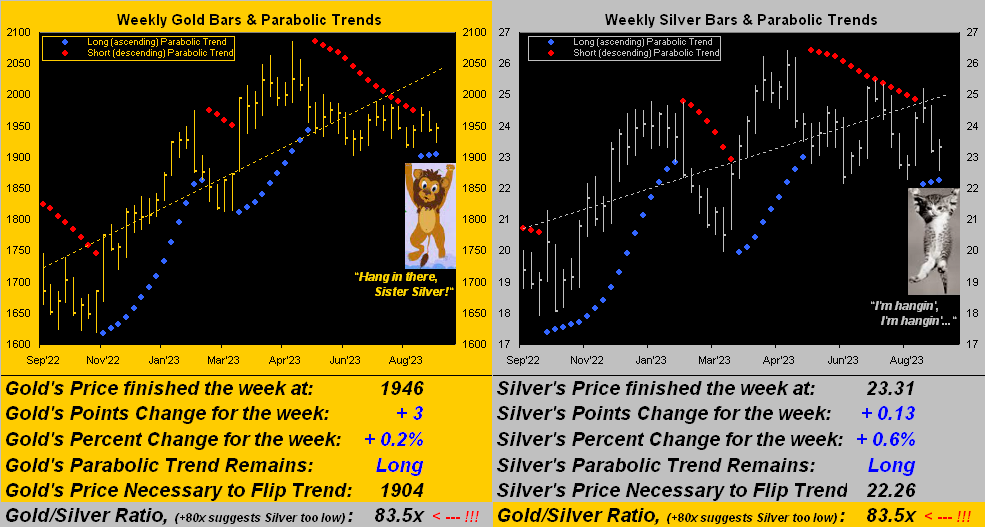
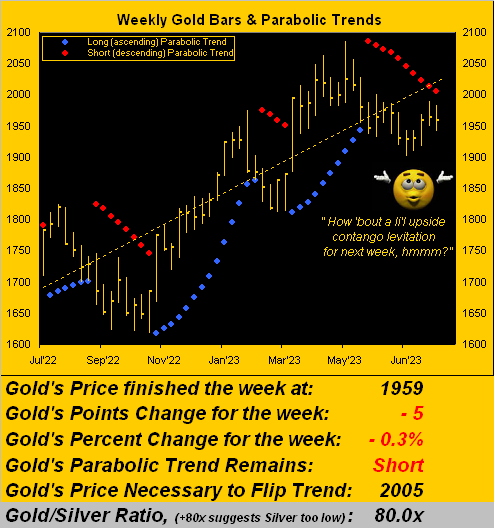
Now before we all get too excited out there about Gold having yesterday (Friday) posted its largest one-day net gain since 17 March by both percentage +3.4% and points +64, let us acknowledge that price is right where ’twas a mere 14 trading days ago on 26 September. So in settling out the week at 1946, for you “three-week” price charters, Gold for said stint is essentially “unch”. Or as we oft quip: change is an illusion whereas price is the truth. And at 1946: truth = cheap.
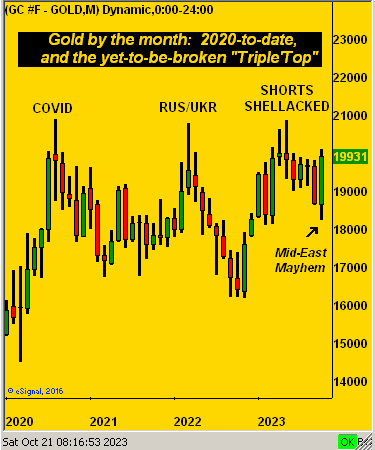
Still, yesterday’s robust move was gratefully appreciated. Save also for 17 March, Gold hadn’t had such a single session up move since a smattering of days when the 2020 COVID scare got underway (from 23 March – 09 April that year), prior to which was a +4.7% day’s net gain on 24 June 2016. Too, in measuring the Gold futures by MoneyFlow (change x volume), yesterday’s inflow ranked third-best year-to-date. (And further for those of you curiously scoring at home, yesterday’s +3.4% net Gold gain ranks 27th-best century-to-date, the most being +9.0% away back on 17 September 2008 upon ol’ Black Swanee’s song about everything else going wrong).
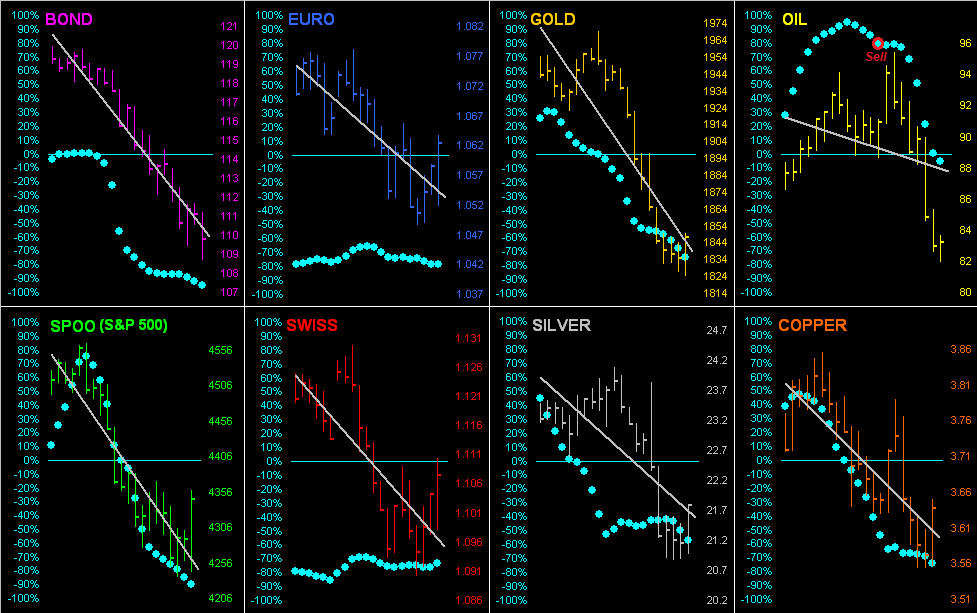
Impressively however, as we’ve pointed out over these many years, Gold — unlike other major markets –has a tendency to rise faster than it falls. To wit: most recently from high-to-low, price dropped -112 points in nine trading days (26 September – 06 October). Yet from just Friday a week ago – i.e. six trading days — +123 points was price’s gain: don’t miss the Gold Train!
‘Course by the benefits of debasement, foresight, and a new geo-political catalyst, Gold this past week “got off the schneid” in fast fashion. To quickly encapsulate these three Gold positives:
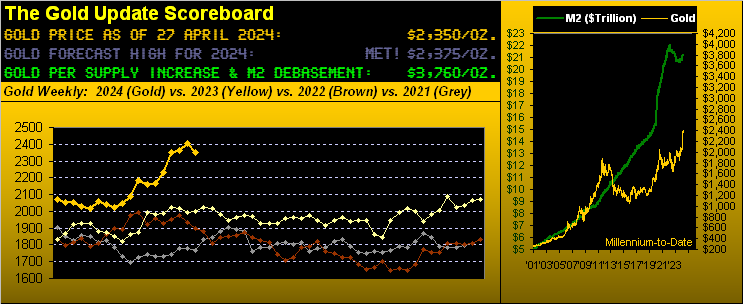
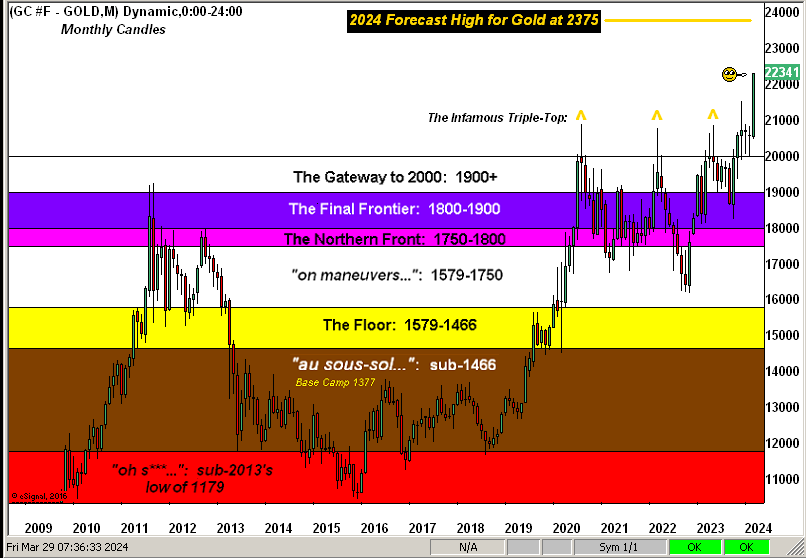
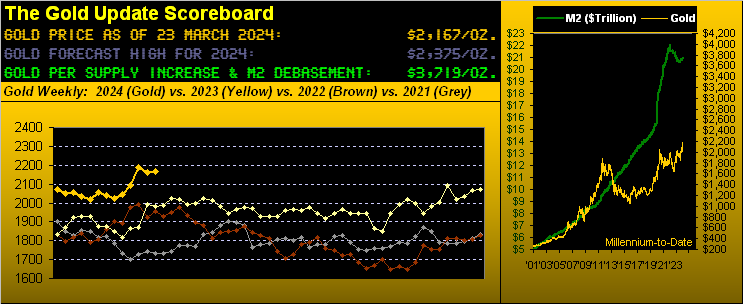
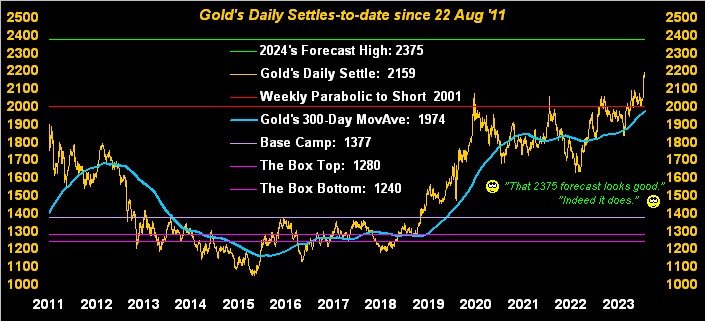
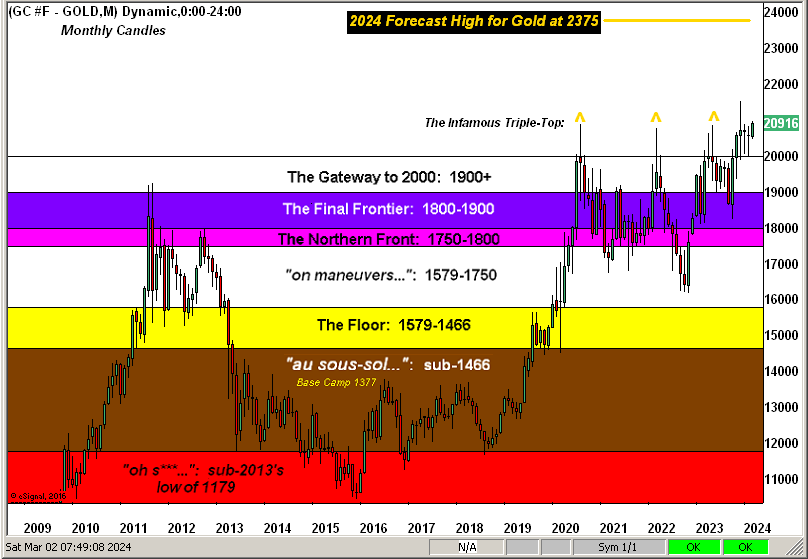
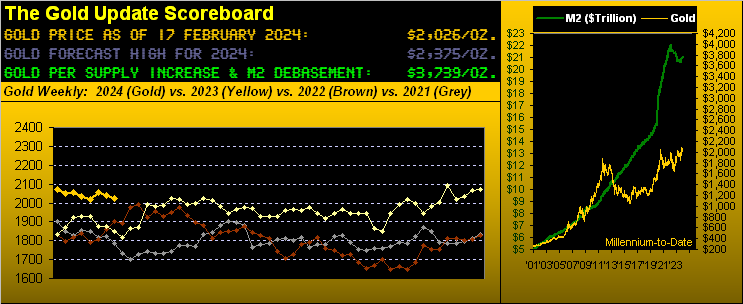
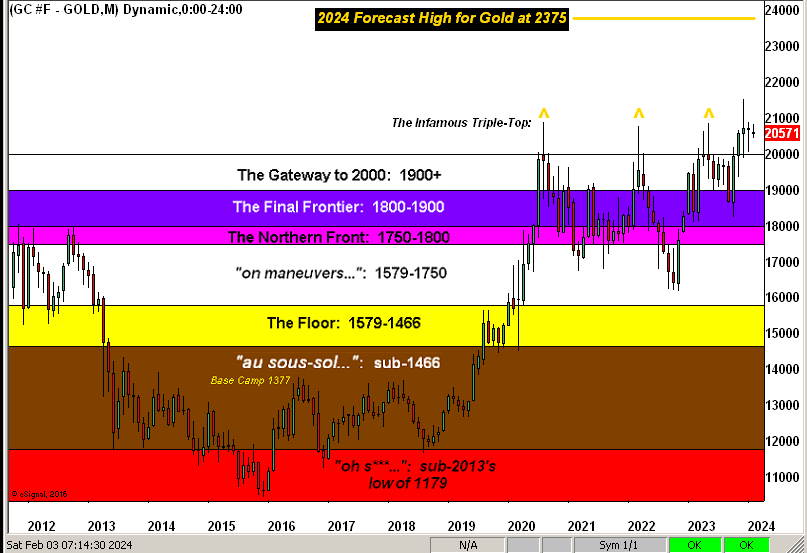
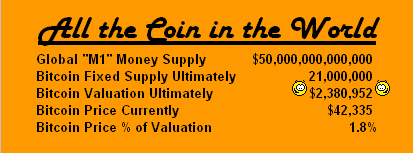
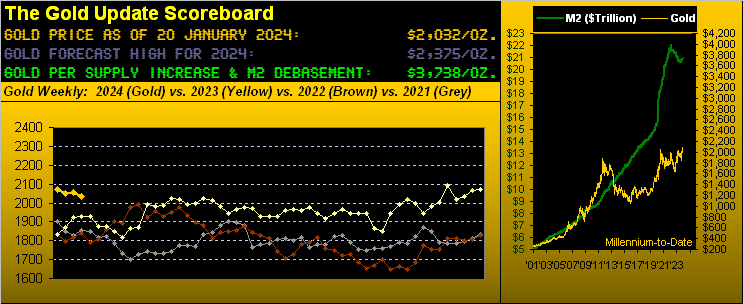
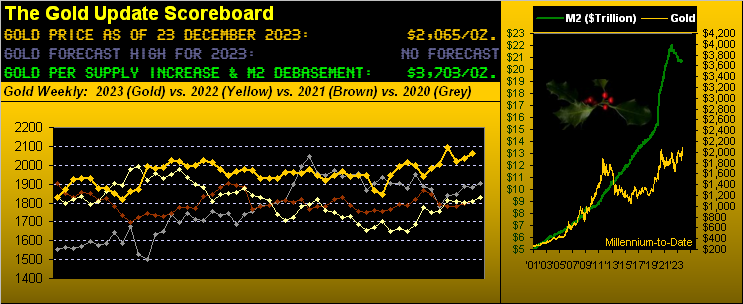
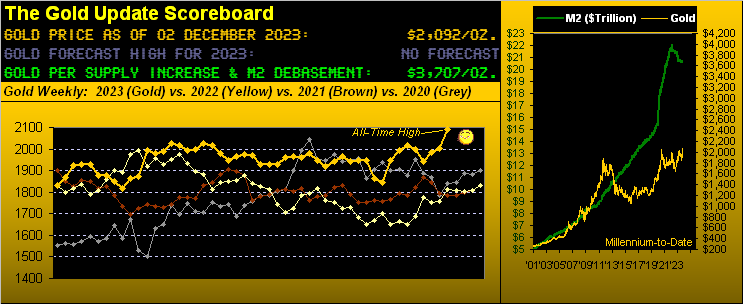
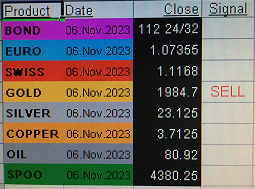
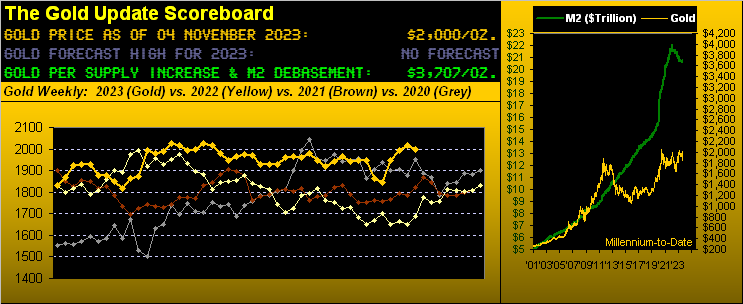
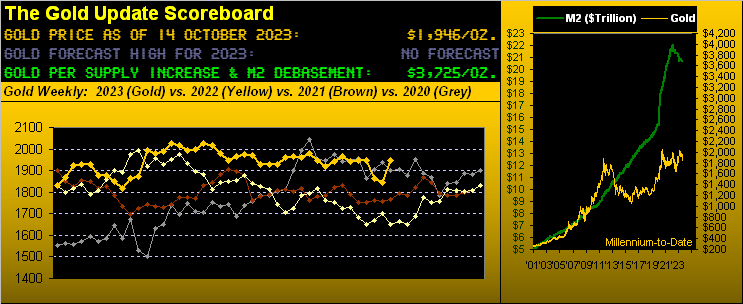
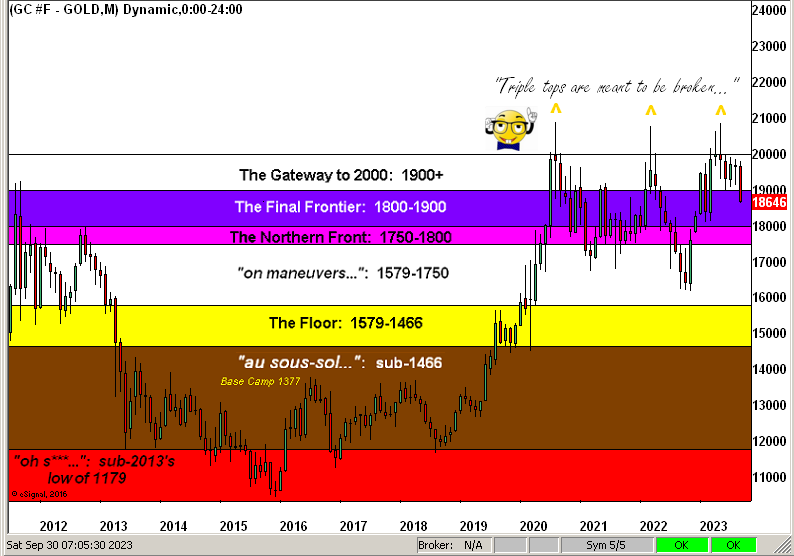
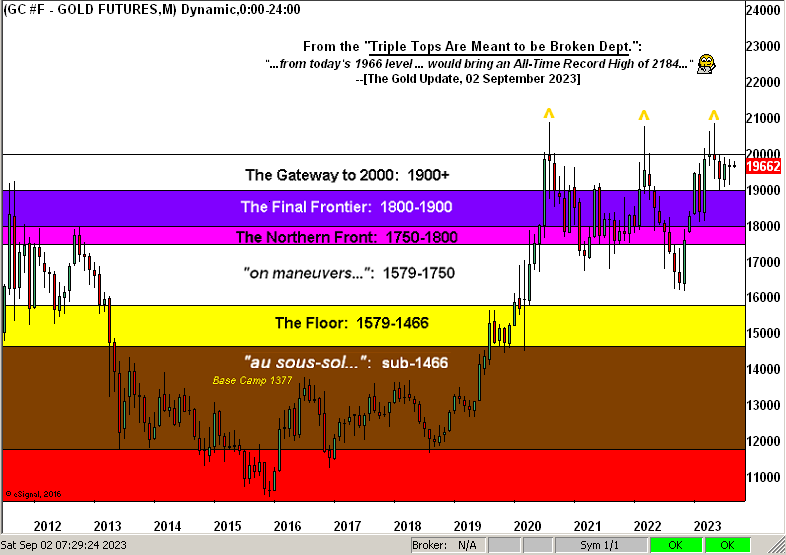
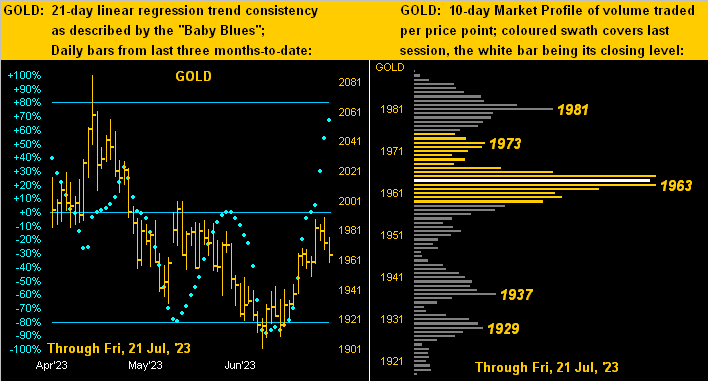
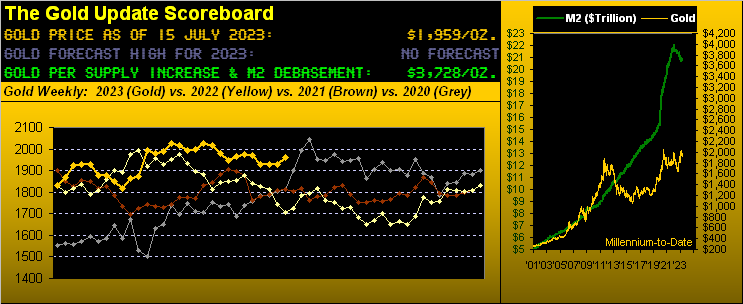
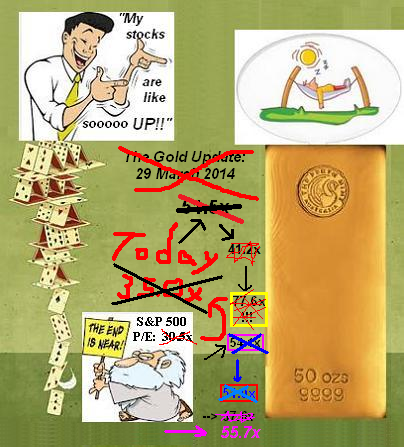
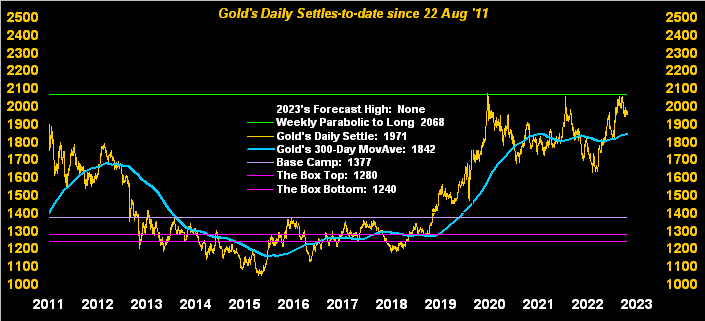
► By debasement Gold remains ridiculously undervalued vis-à-vis the above Scoreboard; priced now at “the market is never wrong” level of 1946, ’tis nonetheless -48% below the Dollar debasement value of 3725, which given historical price-to-value reversion shall eventually be reached.
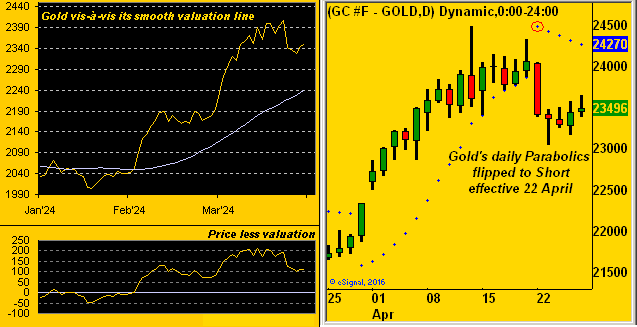
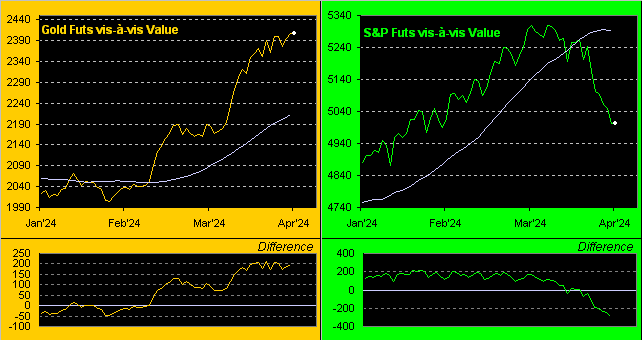
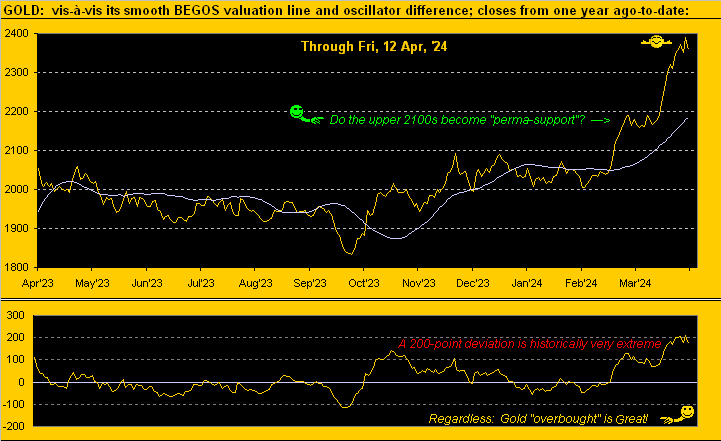
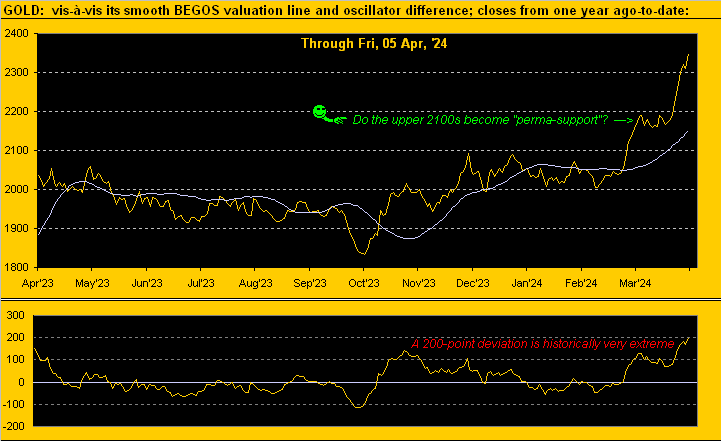
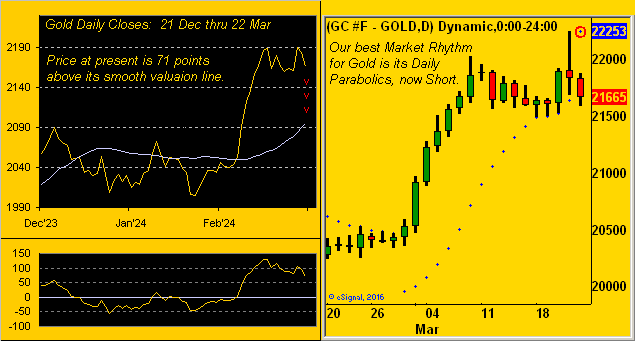
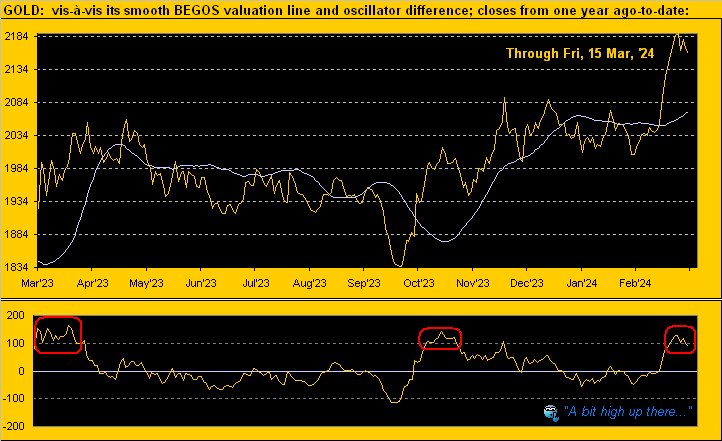
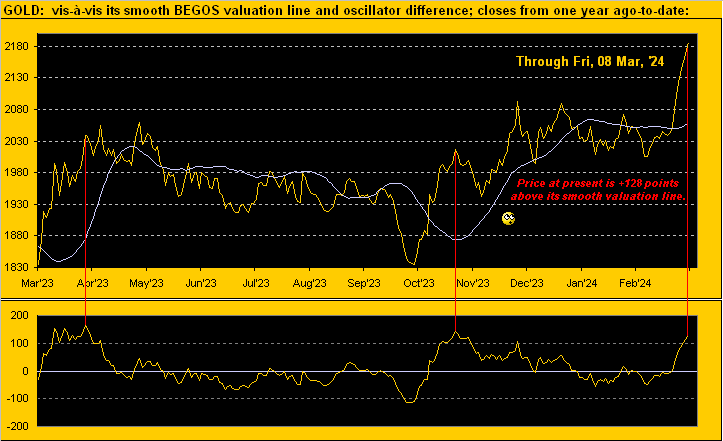
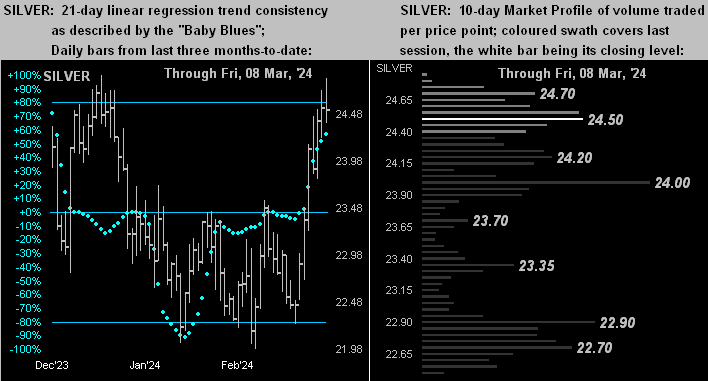
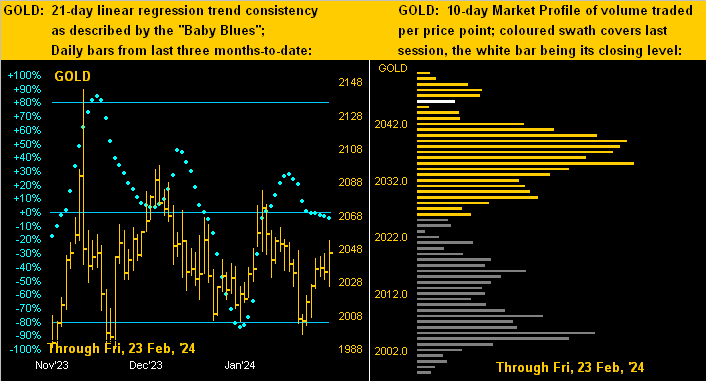
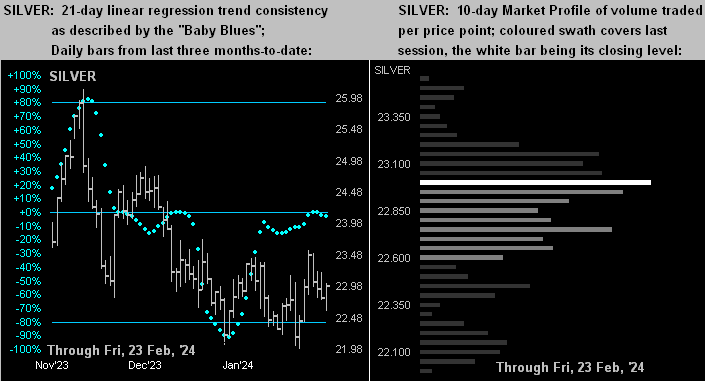
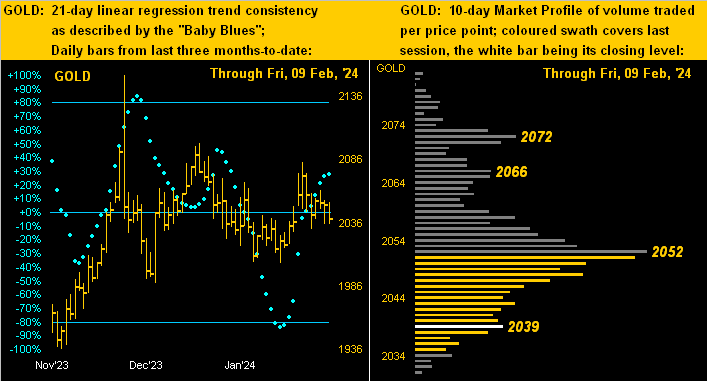
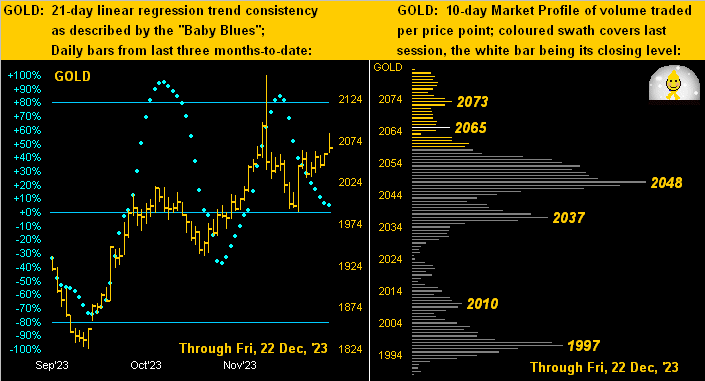
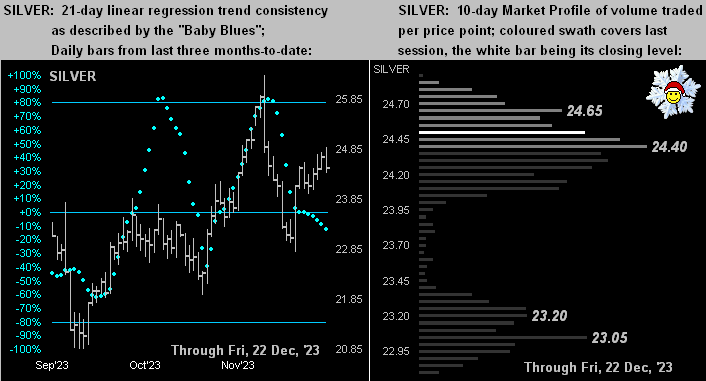
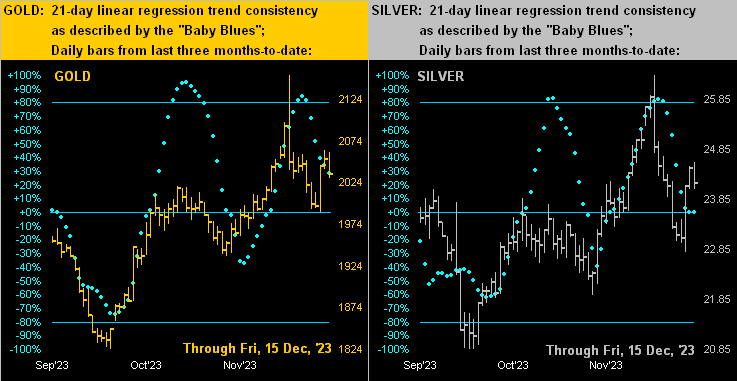
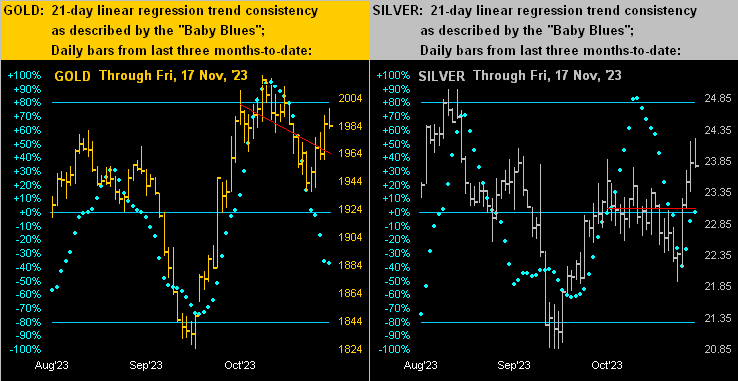
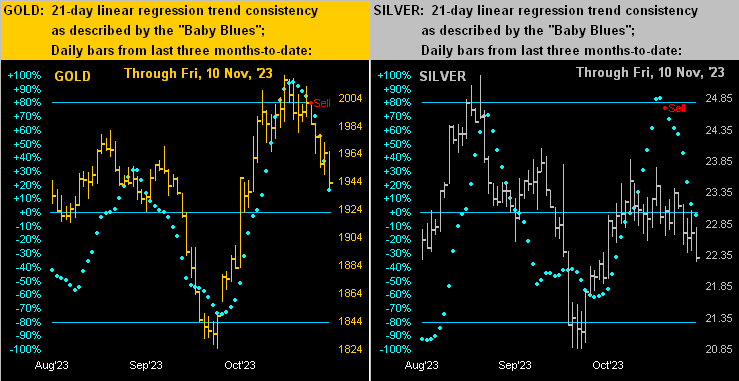
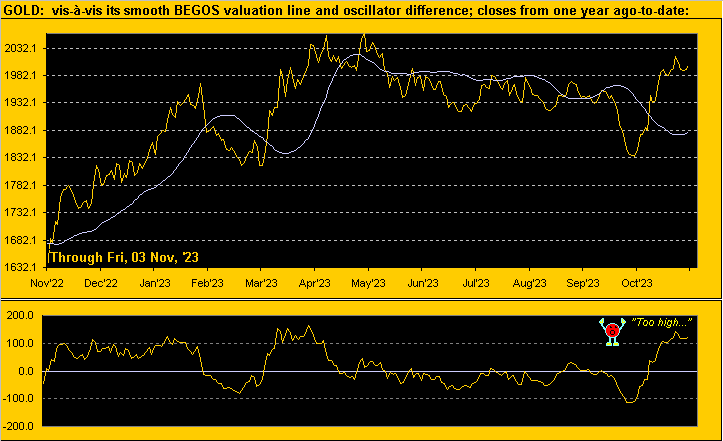
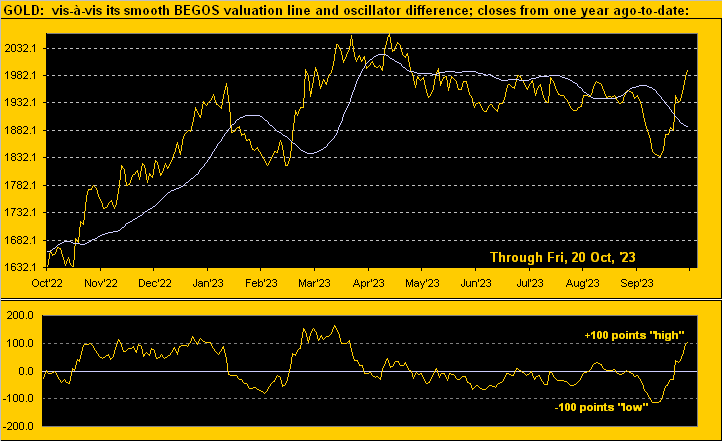
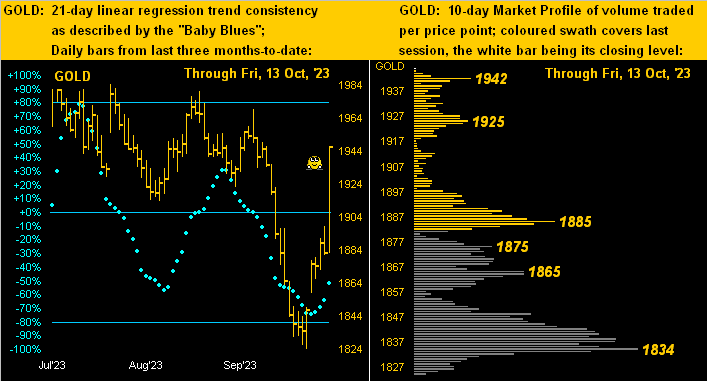
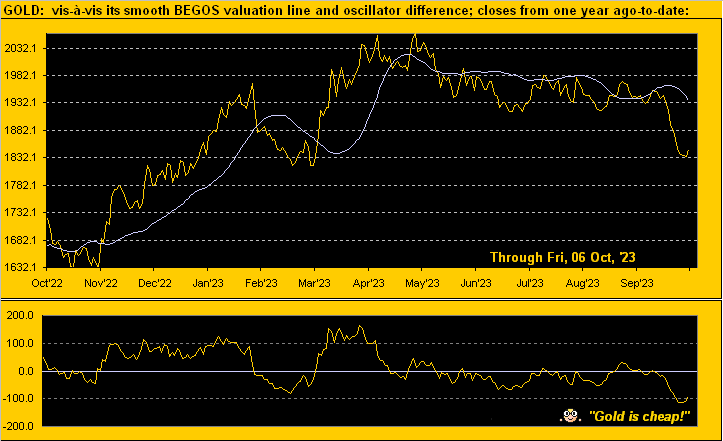
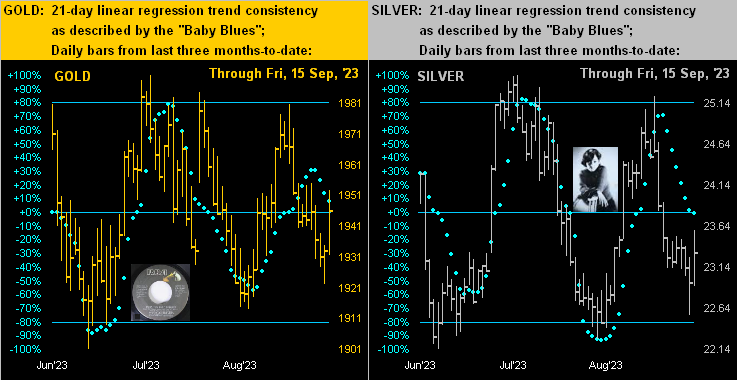
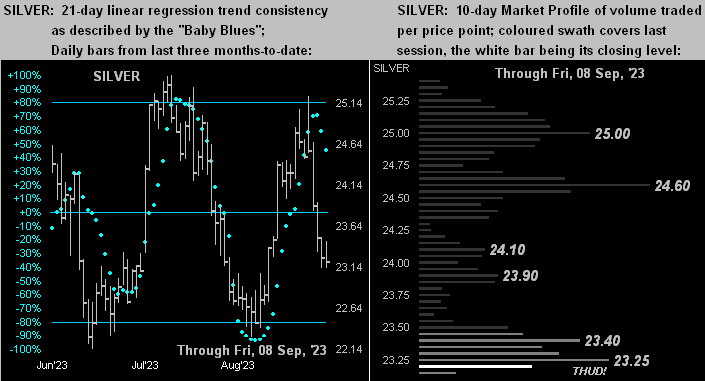
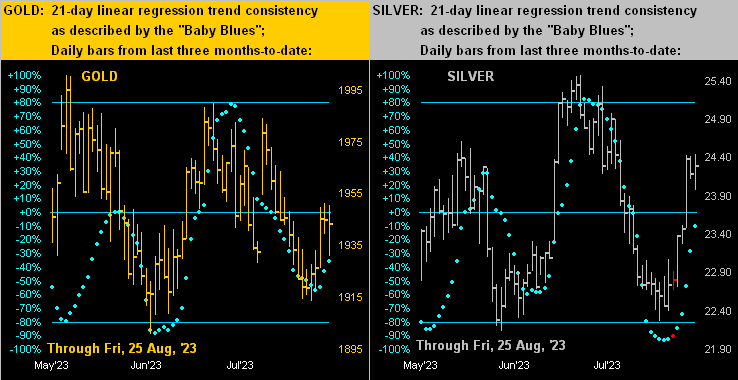
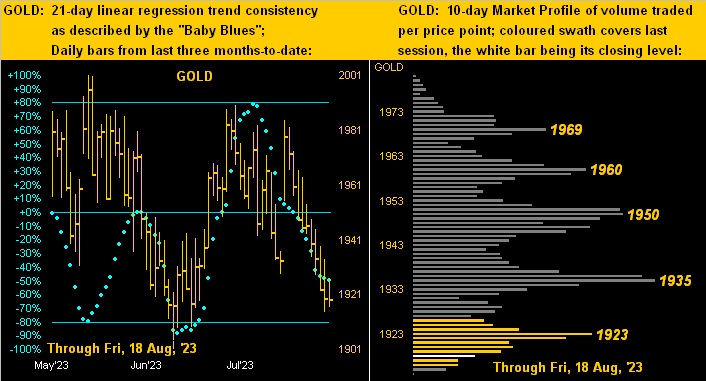
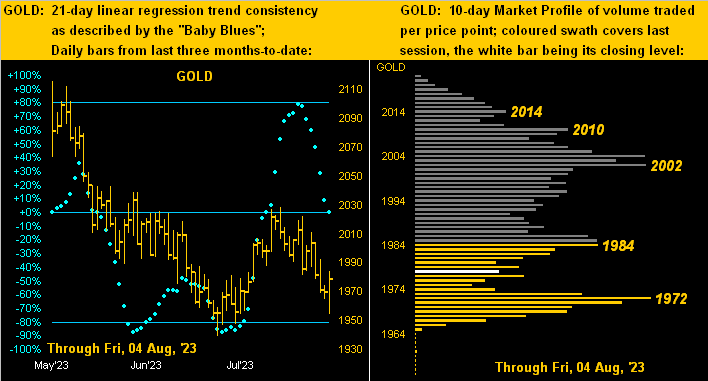
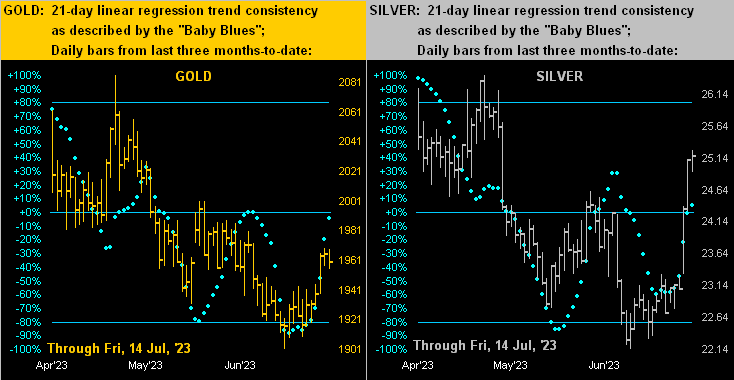
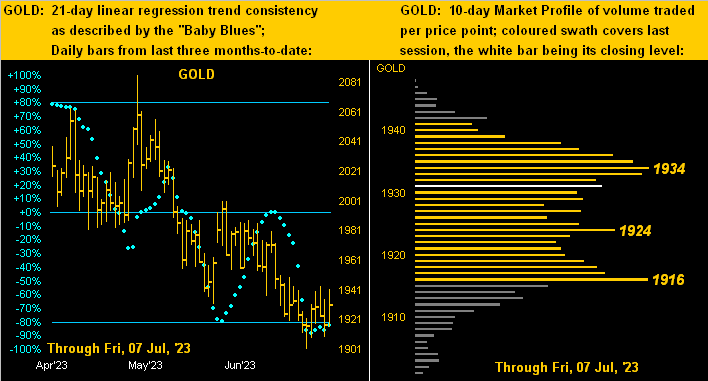
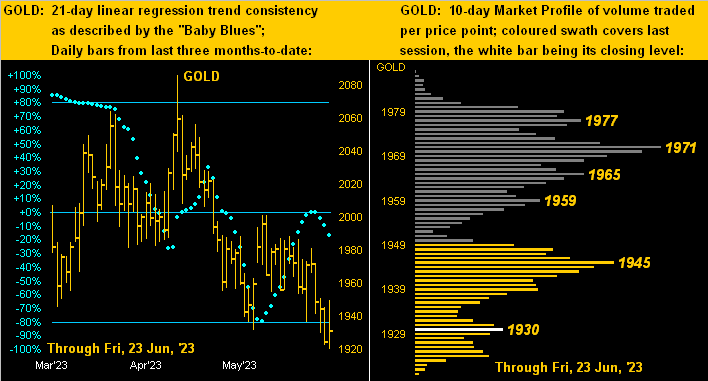
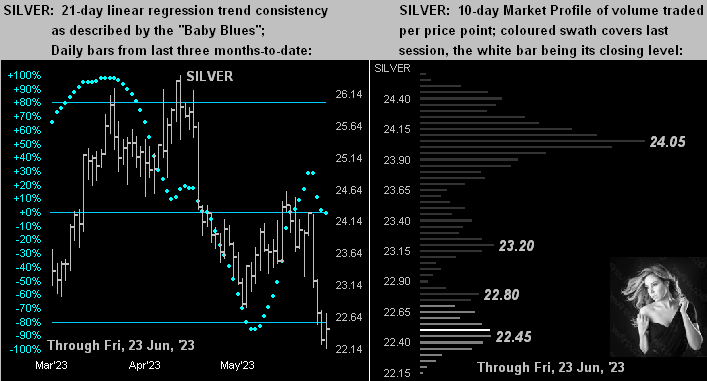
► By foresight as herein starkly charted a week ago, Gold vis-à-vis its smooth valuation line (per the website’s Market Values page) was “nearly -100 points ‘low’, historically an extreme that begs for reversion up to the mean”. Moreover for four consecutive sessions (02-05 October) Gold settled at least -100 points below said line. Now ’tis +39 points above it … reversion swiftly wins again.
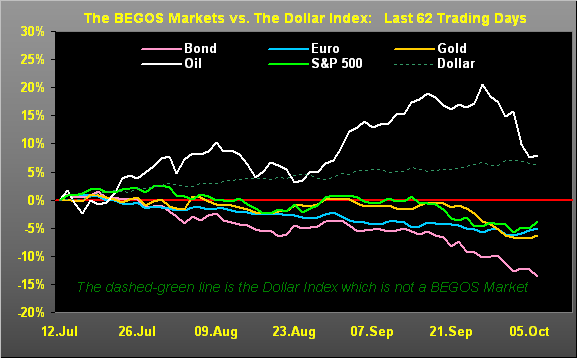
► By geo-politics came the incursion into Israël whilst we were putting pen to paper at this time a week ago. Obviously then followed — as anticipated by a material amount — Gold gapping higher at Sunday night’s open whilst the S&P futures gapped lower.
“But in the past, mmb, you’ve gone on about how geo-political price spikes then come all the way back down…“
We’ve detailed in prior missives examples of that typically being Gold’s case, Squire. But (to risk a terribly overused phrase) perhaps “it’s different this time”, especially per the just cited realities of debasement and foresight, the wake-up catalyst now being geo-political.
The point is: Gold has been priced way too low for way too long, pure and simple. And as the Investing Age of Stoopid seemingly unravels, those paying attention may finally be awakening to Gold.
“And you read what Grantham said, eh mmb?“
Our good man Squire really is on a roll today. Yes, we swerved past a Bloomy piece which teased “Jeremy Grantham Says No One Should Invest in the US“ (as culled from a FinMedia television interview). And admittedly, we chuckled over the interviewee’s referring to the small-cap Russell 2000 as being replete with horribly high-debt “zombie” stocks.
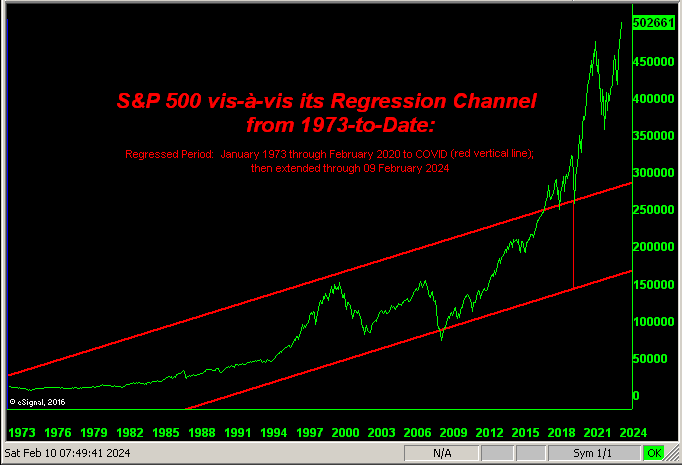
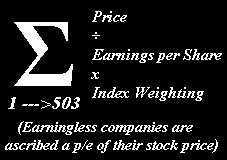
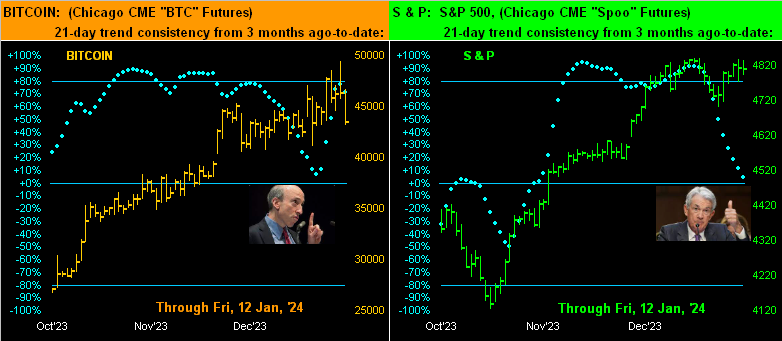
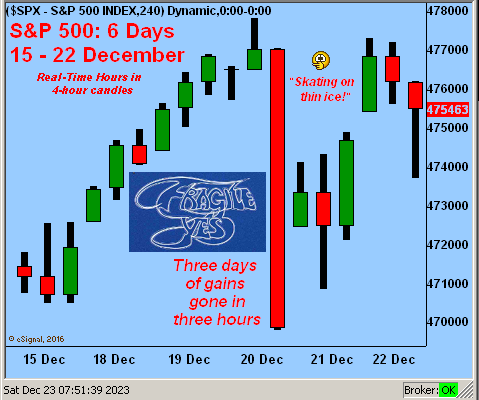
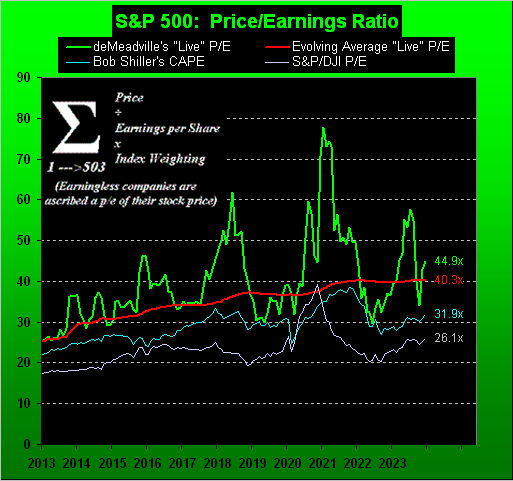
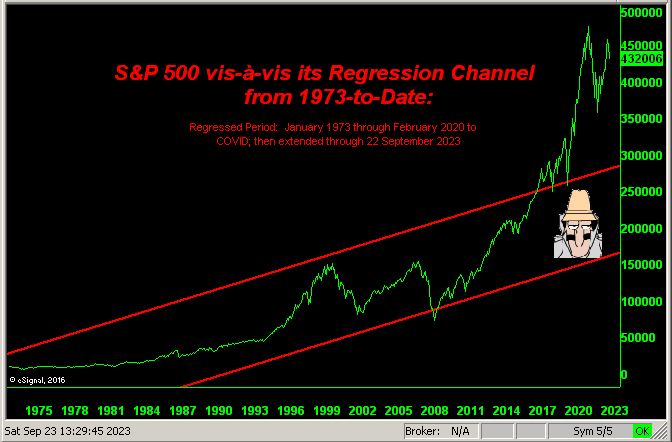
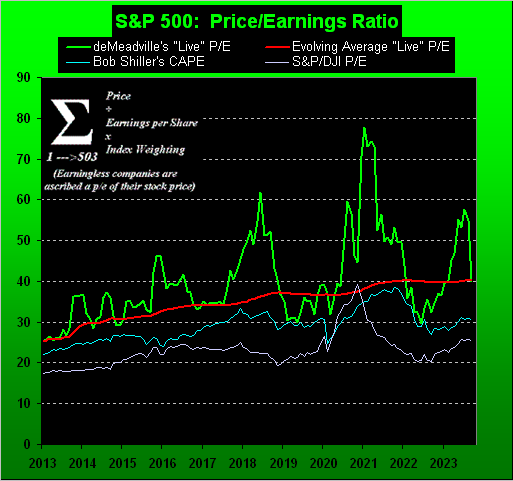
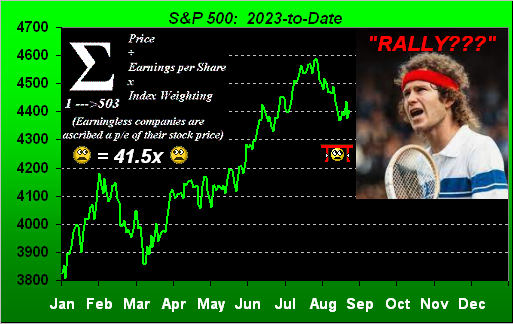
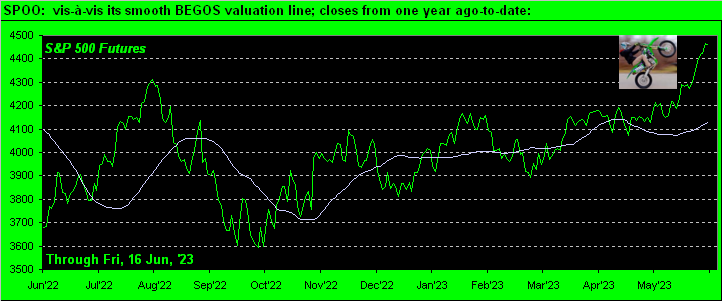
But neither let us rule out the ongoing overvaluation of the large-cap S&P 500. That “mightiest of the mighty” index still maintains many sky-high silly valuations, the “live” cap-weighted price/earnings ratio settling the week at 38.2x; (recall 10 years ago it being -33% lower at a still expensive 25.4x … scary).
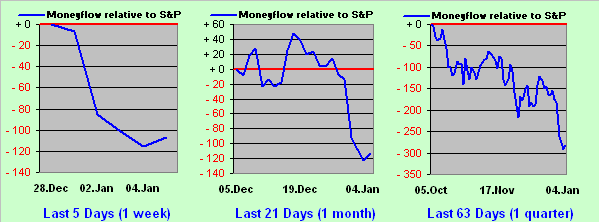
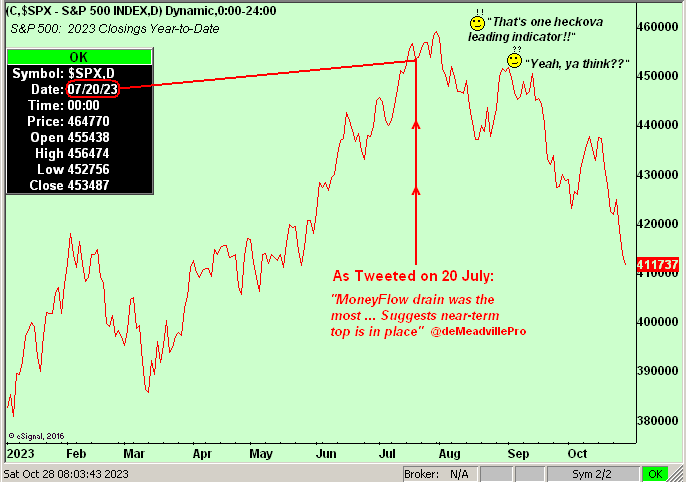
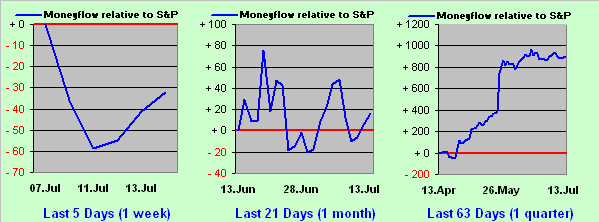
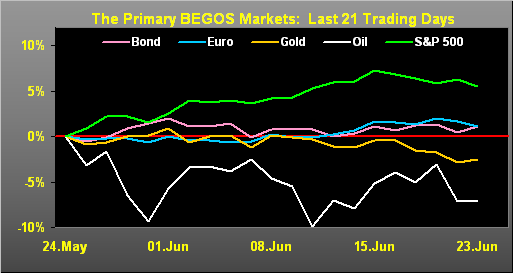
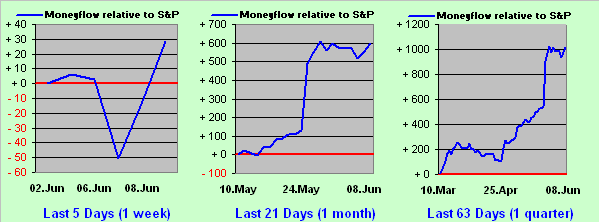
And do you remember how overvalued shares fared notably in ’87, ’02, and ’09? To quote Jonathan Winters in the role of Lennie Pike: “I hope you turn away … that you just look the other way” –[It’s a Mad, Mad, Mad, Mad World; United Artists, ’63]. For per yesterday’s settles, 101 of the 503 S&P constituents now have P/Es of 40.0x or more. Repeat: scary. As for “fear”? Yesterday the S&P netted a loss of -0.5% … but the MoneyFlow regressed into S&P points dropped -1.0%. And as you website followers know, Flow leads dough. Repeat: “fear”.
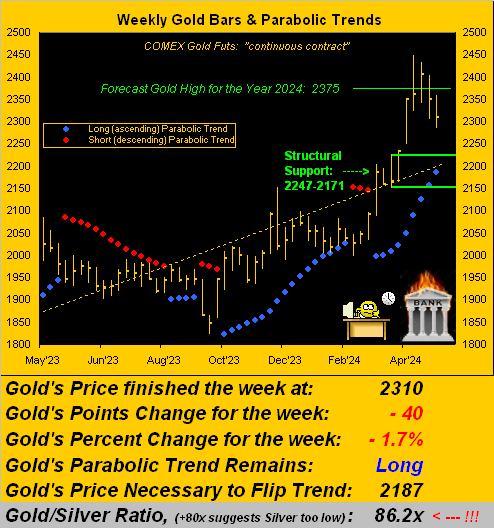
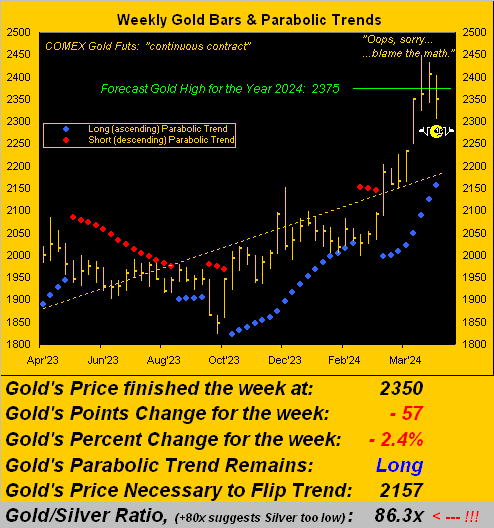
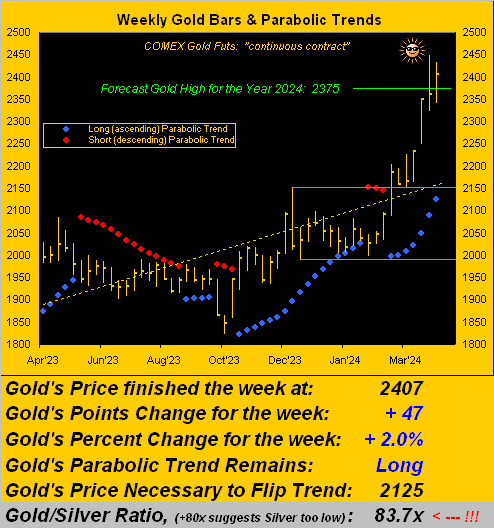
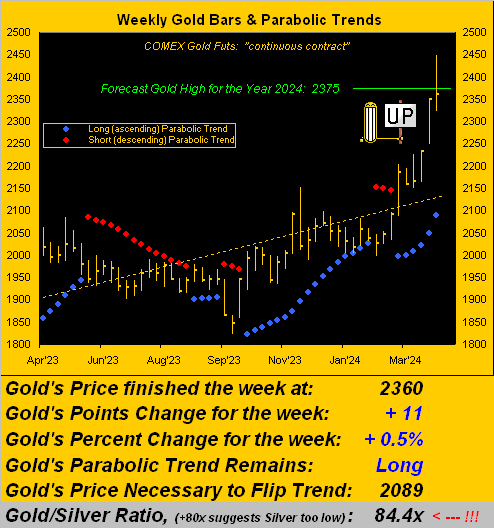
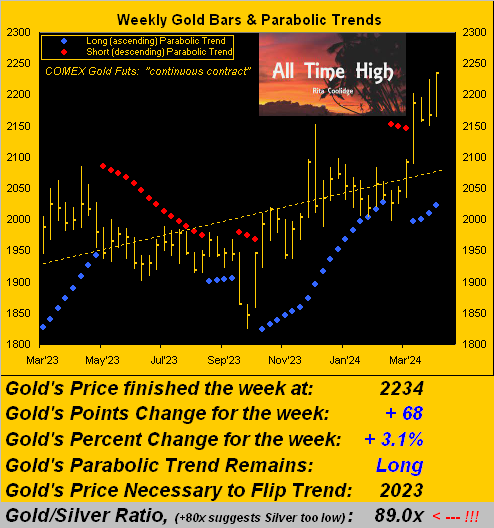
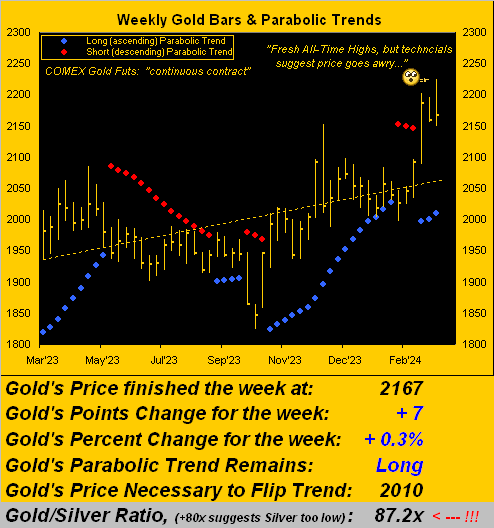
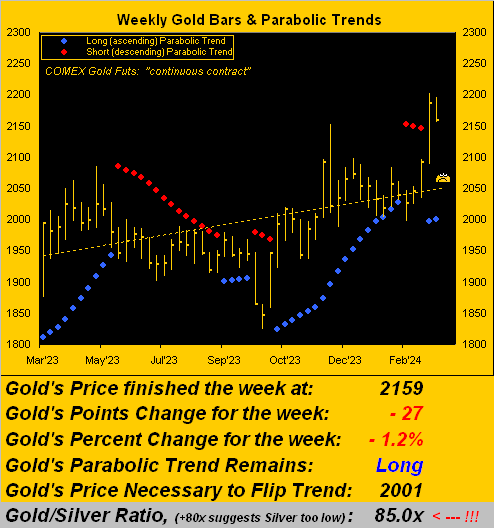
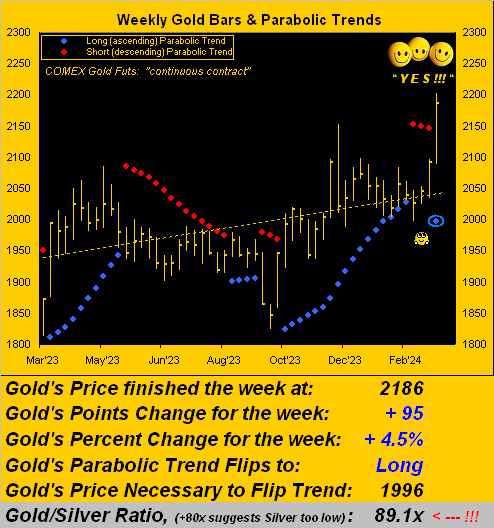
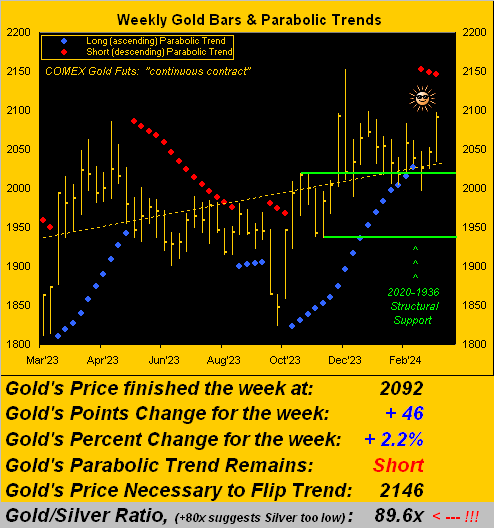
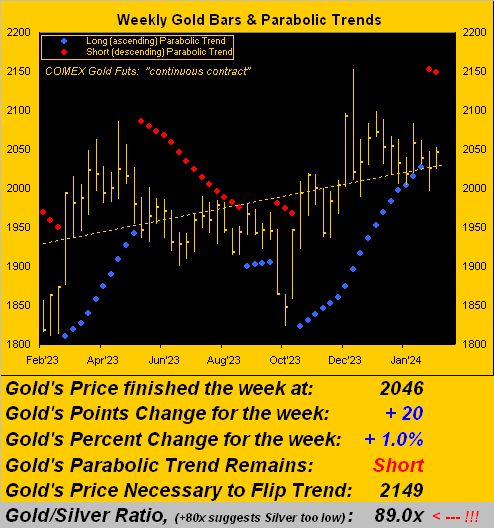
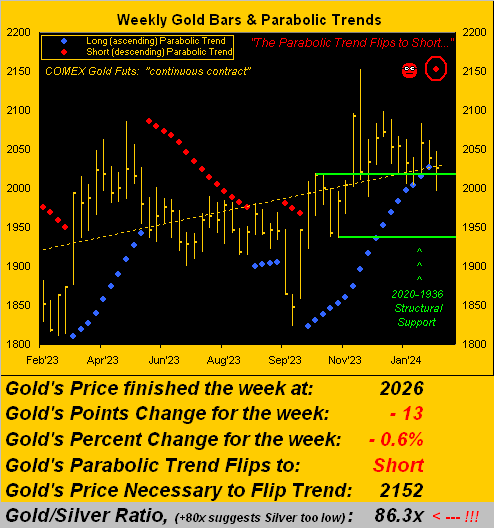
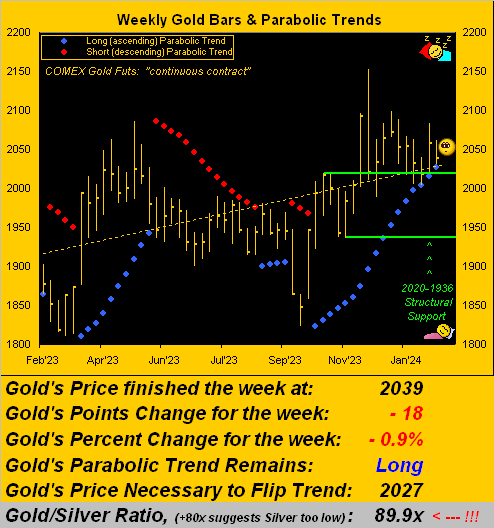
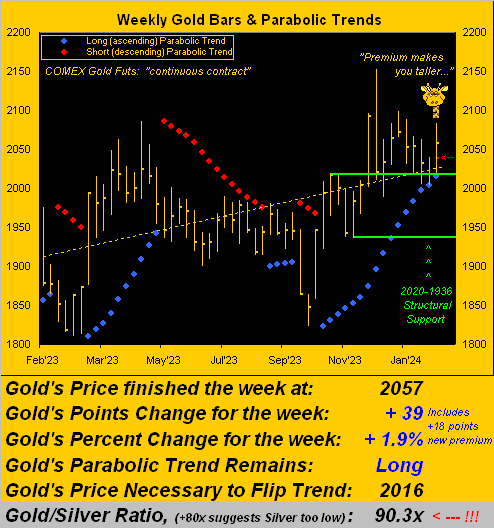
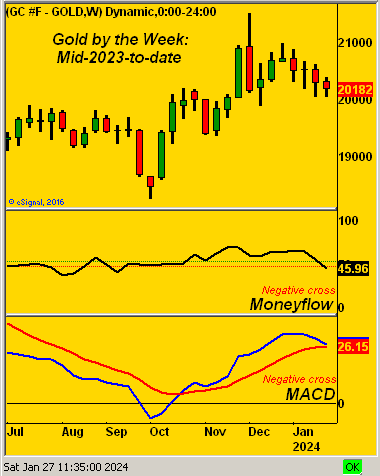
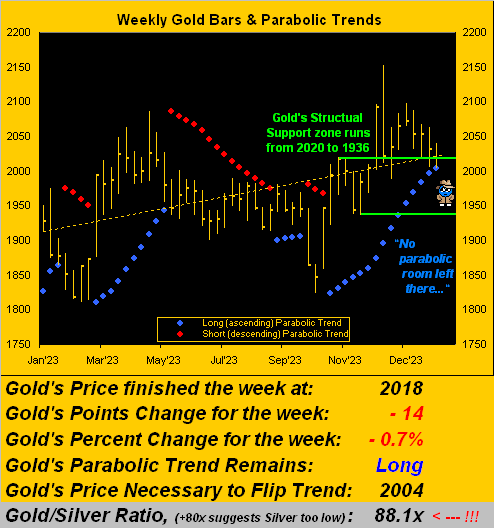
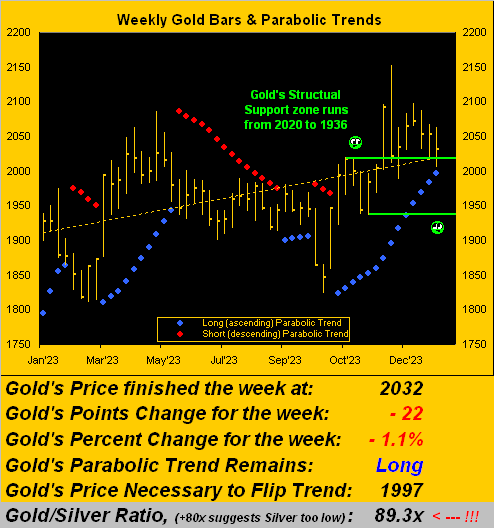
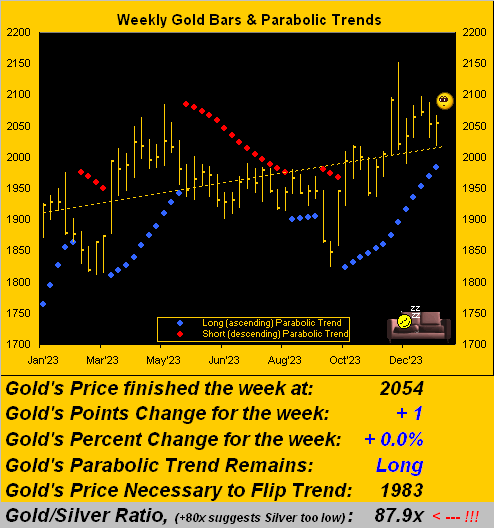
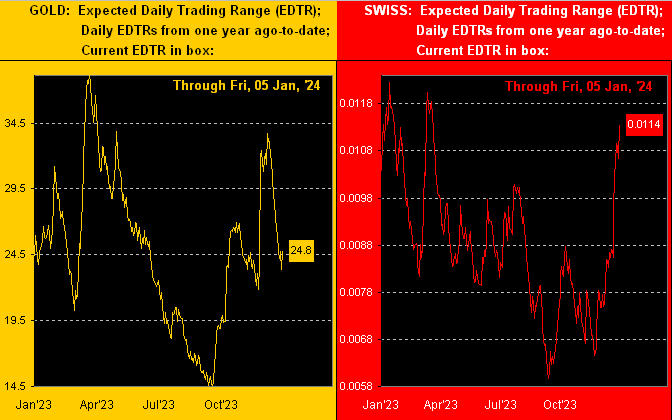
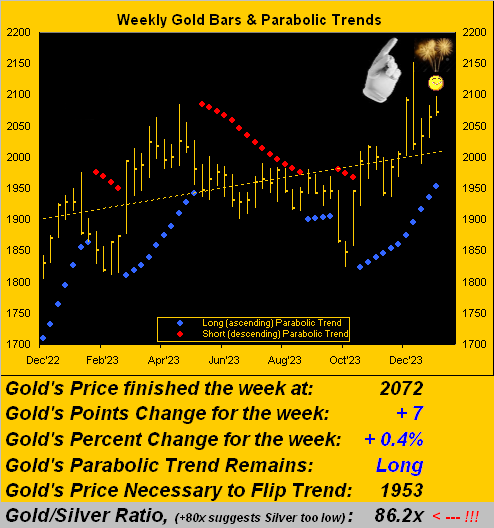
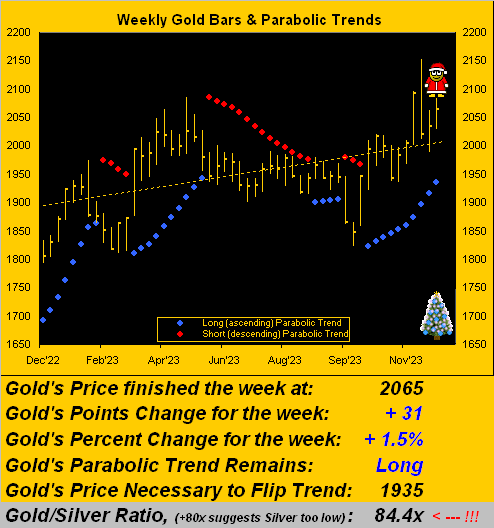
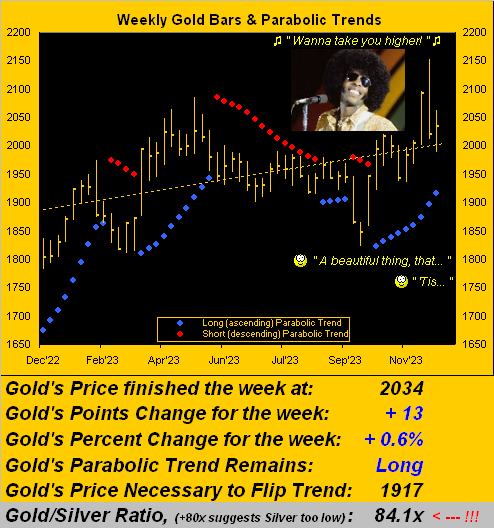
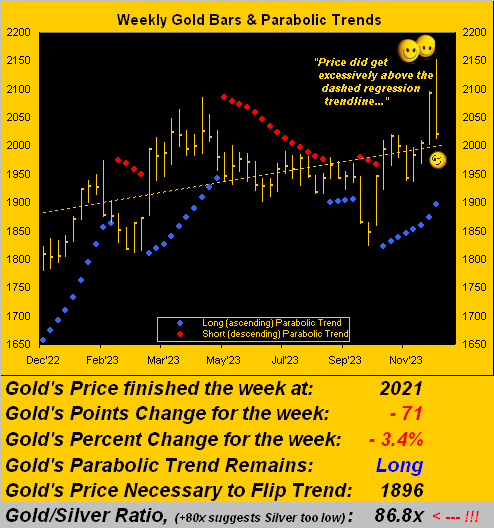
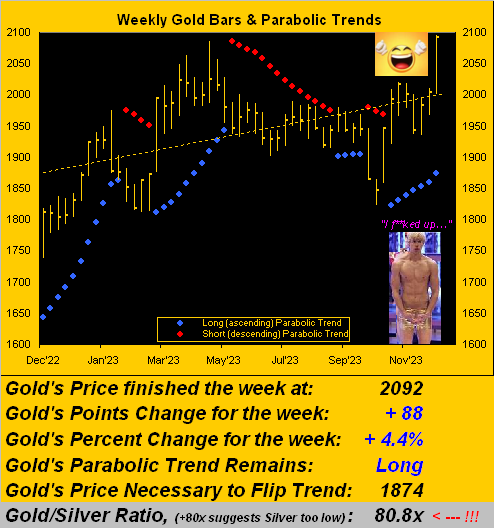
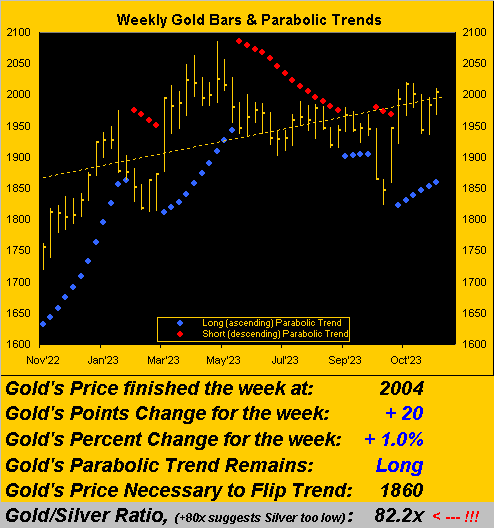
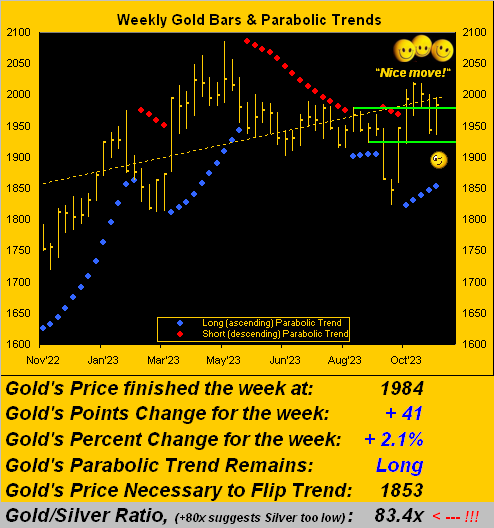
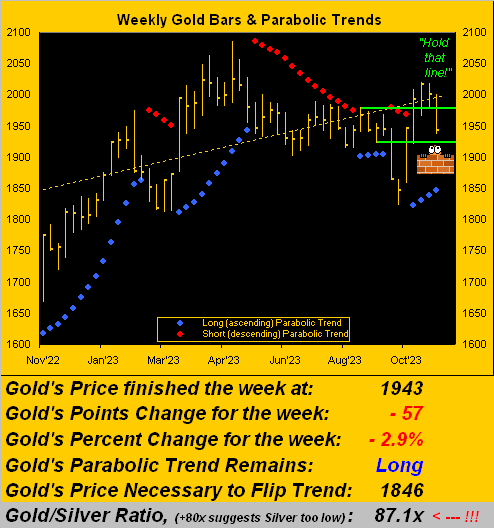
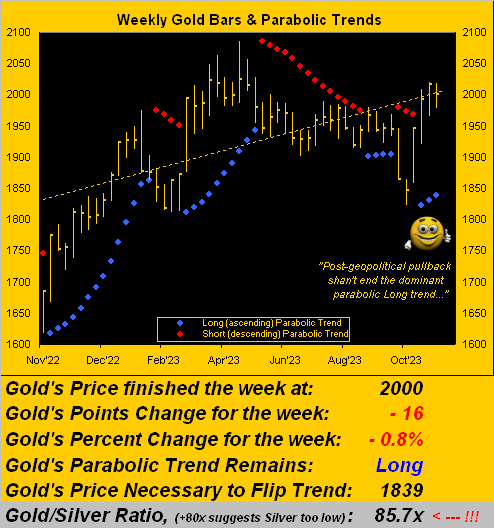
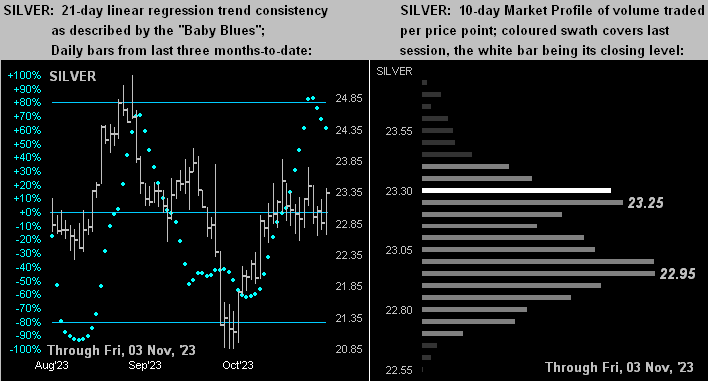
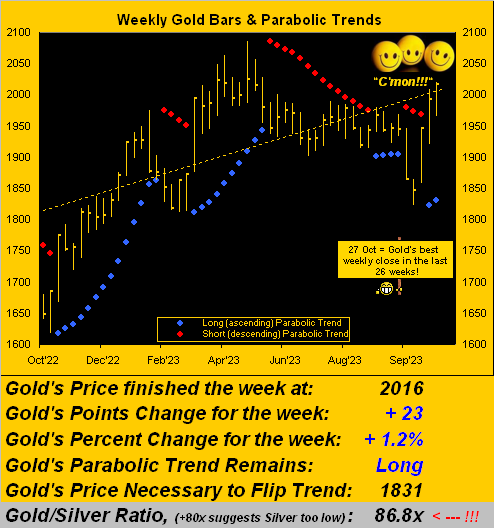
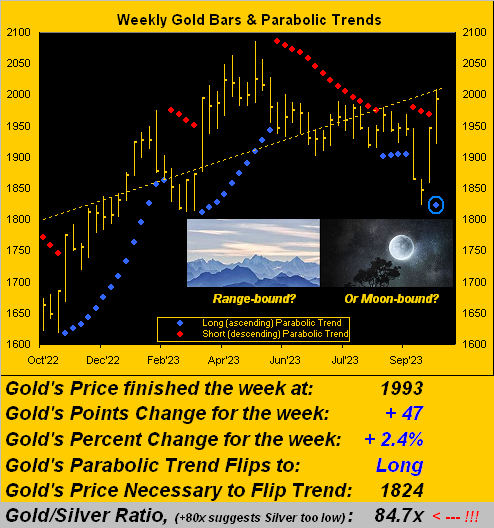
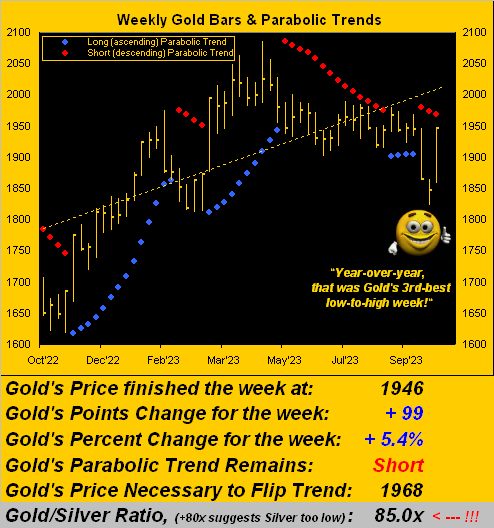
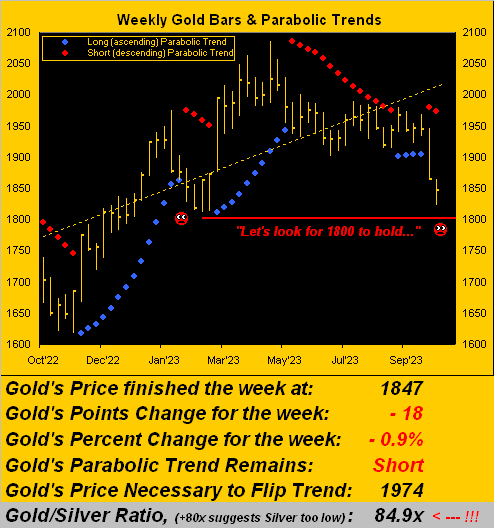
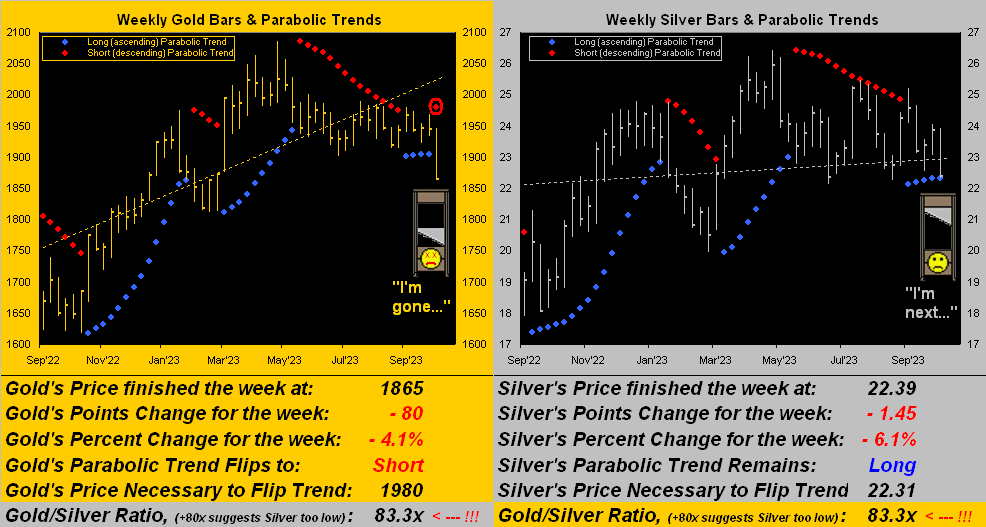
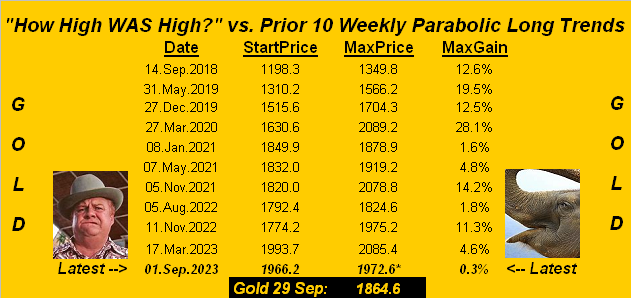
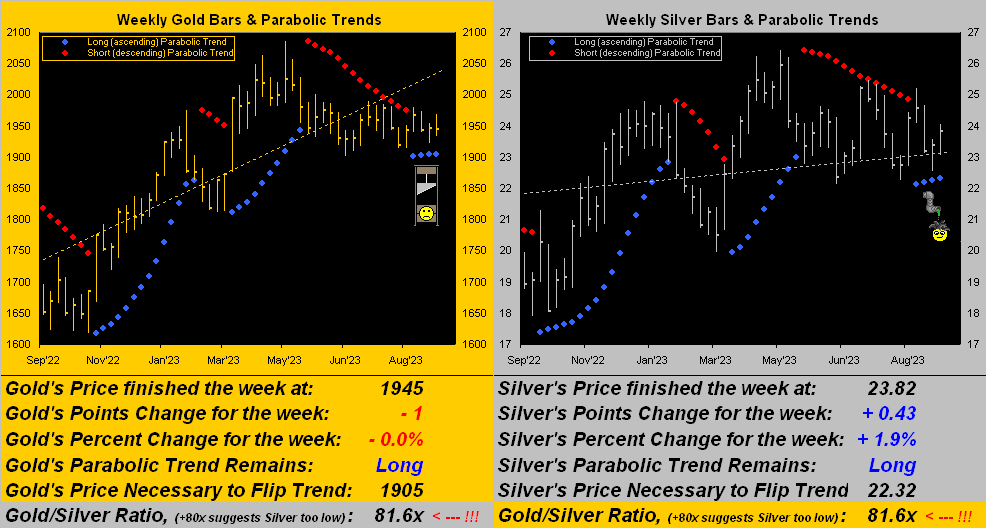
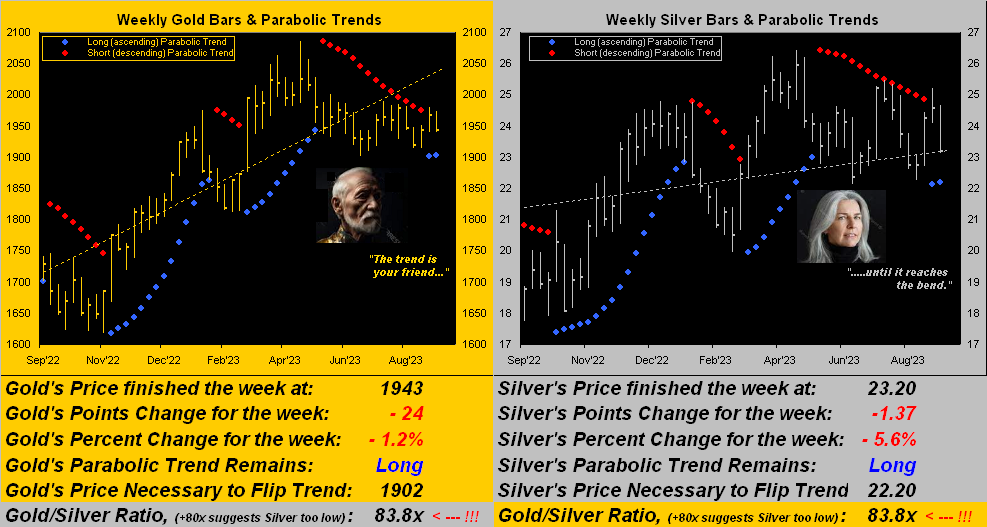
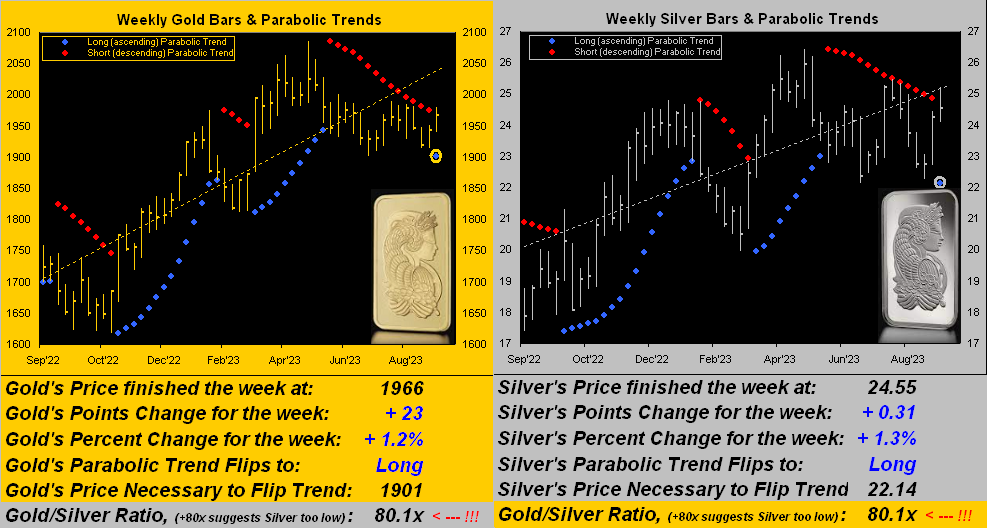
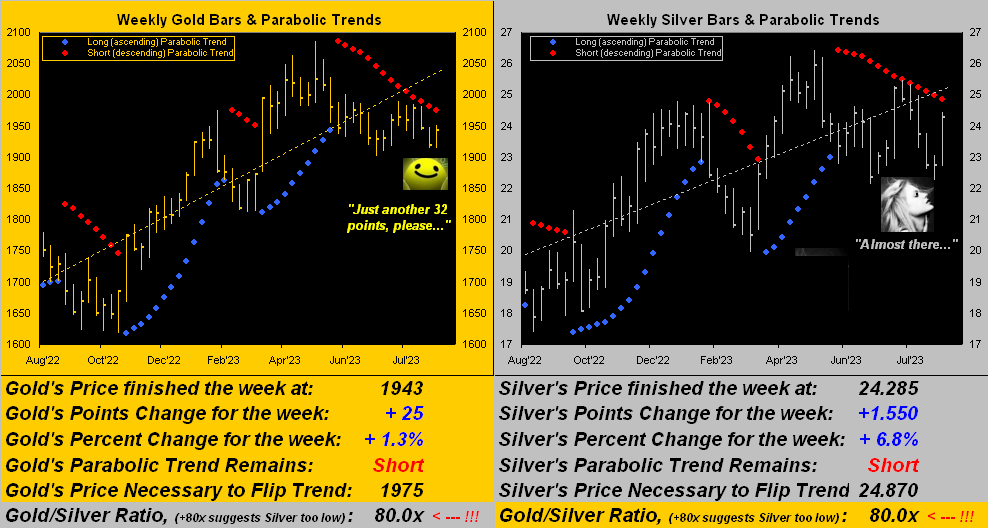
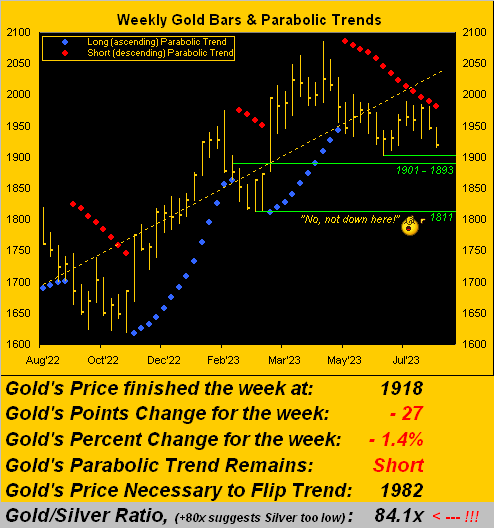
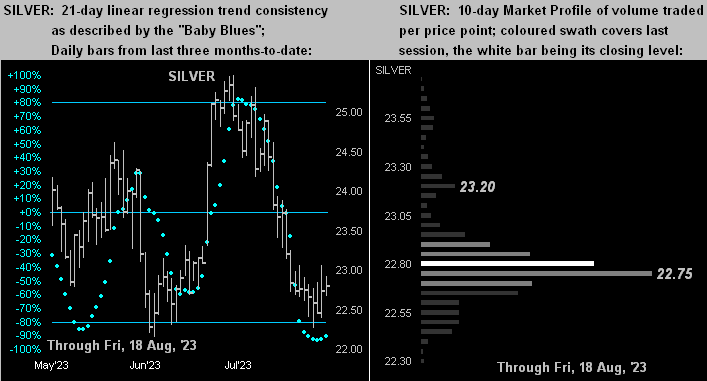
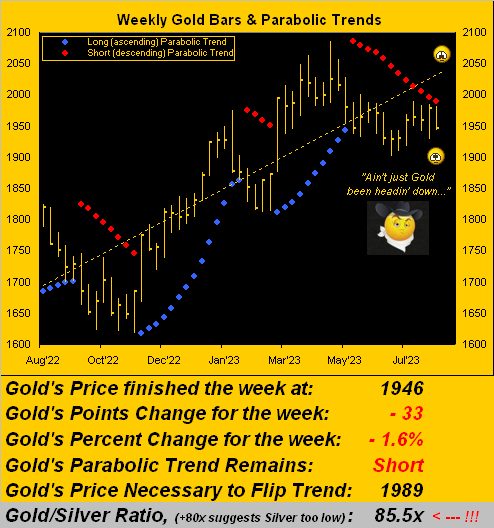
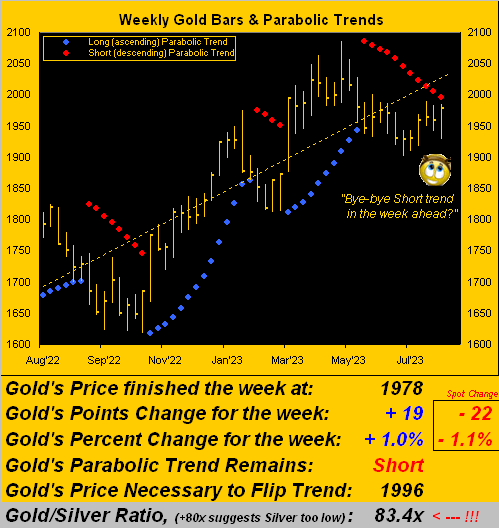
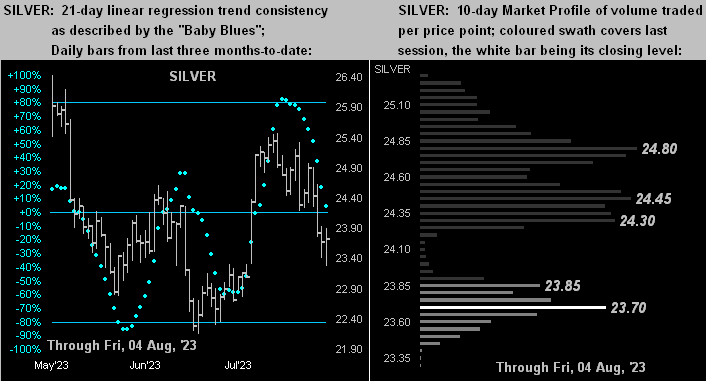
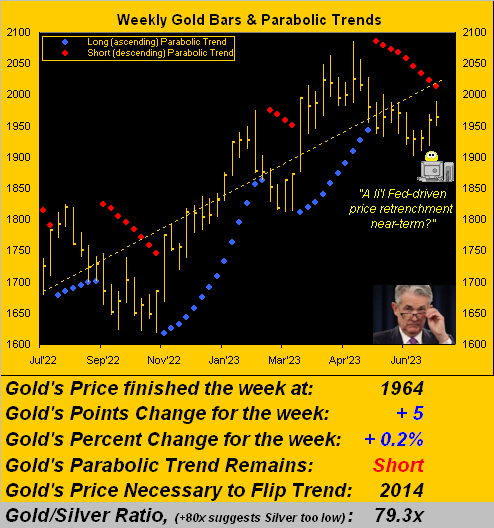
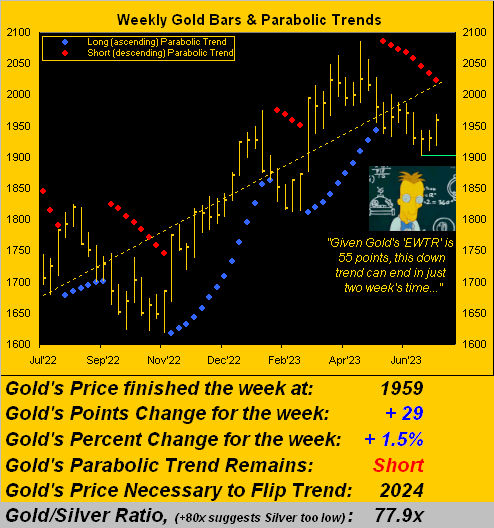
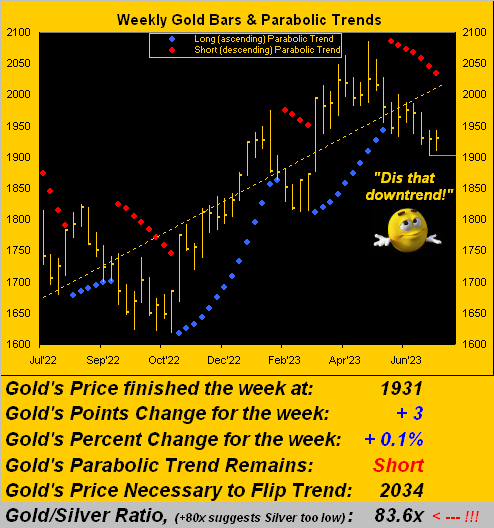
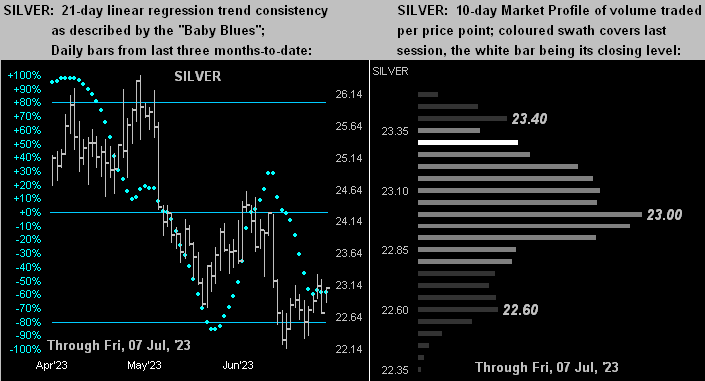
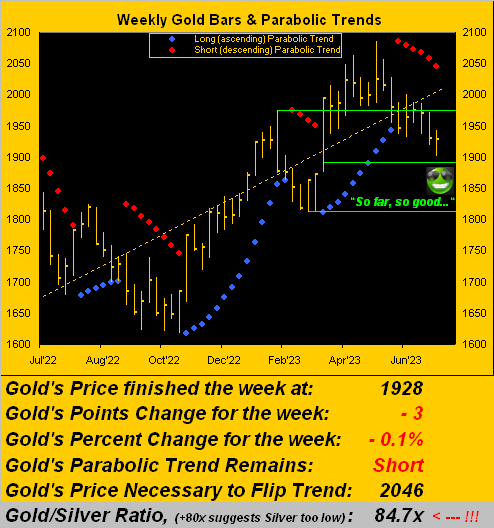
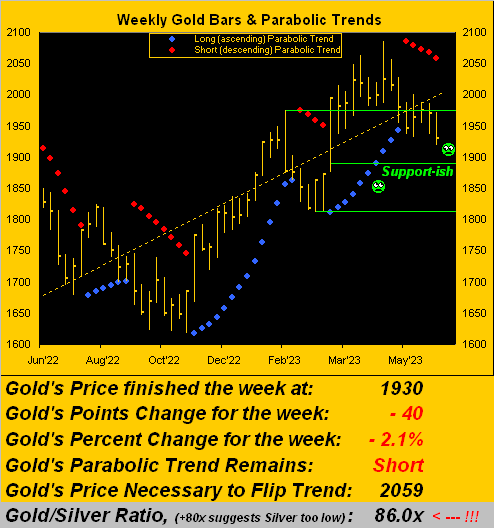
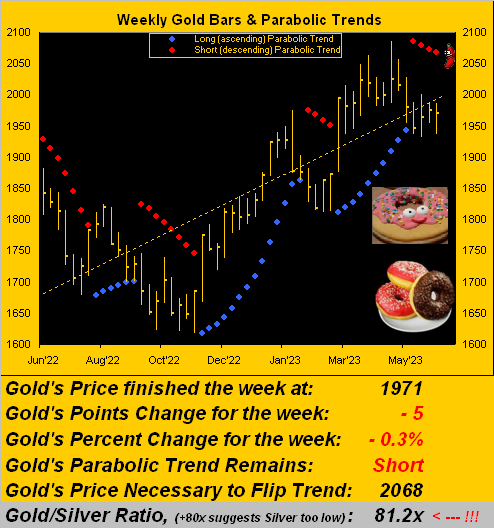
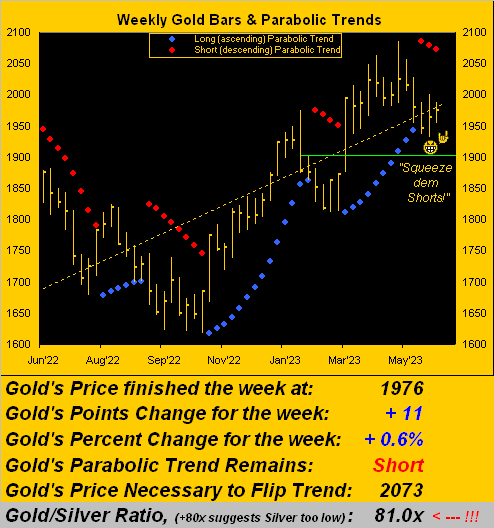
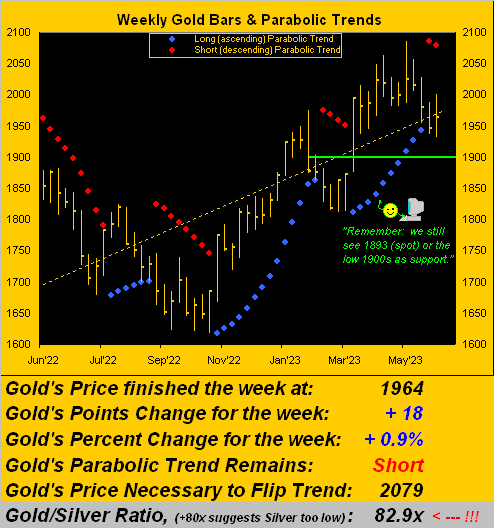
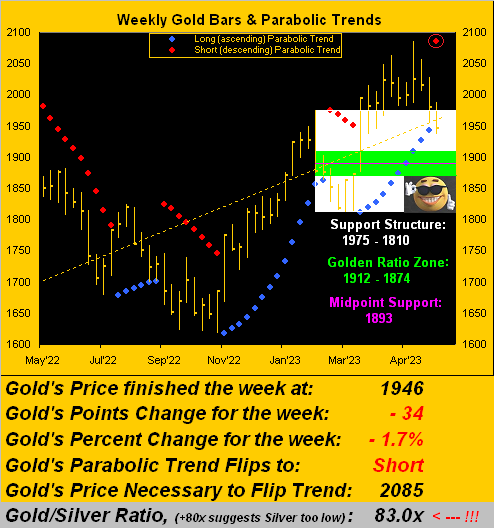
‘Course as is Gold’s wont, it can benefit from the “fear” trade. Oh to be sure, Gold’s weekly parabolic trend remains Short (as does that for Silver). But in turning to Gold’s weekly bars from one year ago-to-date, such Short trend had a big chomp taken out of it per the rightmost bar. As for the flip-to-Long level for the enusing week being 1968, ’tis well within Gold’s current “expected weekly trading range”, now 48 points. Three strikes and out for the red-dotted Short trend? Here’s the graphic: