The Gold Update by Mark Mead Baillie — 700th Edition — Monte-Carlo — 15 April 2023 (published each Saturday) — www.deMeadville.com
“Gold: The Next All-Time High is Nigh“
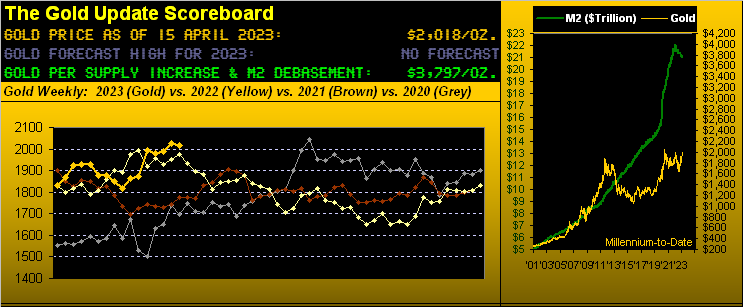
When we penned the first edition of the Gold Update 699 Saturdays ago on 21 November 2009 — for whom the sole recipient was one JGS (thank you, mate) — the price of Gold was 1151. Since then, Gold rose to as high as 2089 (+81%) on 07 August 2020, nearly reclaiming that level at 2079 on 08 March 2022 as the RUS/UKR war intensified, and nearly again just this past Thursday at 2063.
But as is Gold’s wont to weaken following geo-political boosts, (the latest being upon Finland’s joining NATO as we detailed a week ago), plus some degree of waning inflation as reported this past week at March’s wholesale, retail and import price paces, the yellow metal, too, sank into week’s end, settling yesterday (Friday) at 2018.
Stirring Gold’s price negativity as well was FedGov Christopher “Up The” Waller’s commenting on Friday from the Lone Star State that inflation “…is still much too high … so monetary policy needs to be tightened further…” Or to reprise Al Gore’s infamous comment from back on the campaign trail in ’92: “…Everything that ought to be down is up. Everything that should be up is down…”
And priced today at 53% of the opening Scoreboard’s debasement value of 3797, Gold ought be up, whilst conversely with the “live” price/earnings ratio at 208% (46.9x) of its lifetime mean of 22.5x times, the S&P 500 ought be down. (Pssst: Can you say “means regression”?) Or perhaps it all “means recession”? More on that eventuality when we get to the Economic Barometer.
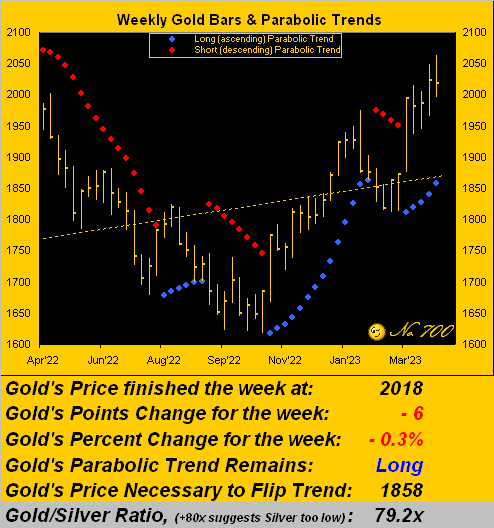
But first as entitled, for Gold the next All-Time High is nigh. And as we turn to Gold’s weekly bars from one year ago-to-date, the rightmost blue-dotted parabolic Long trend is now five weeks in duration and accelerating upward. Whilst price closed mildly lower (-0.3%) for the week just past, its high of 2063 was the best since that ending 11 March 2022, indeed just 26 points below the 2089 All-Time High. As noted a week ago, we mused were Gold to achieve a new All-Time High coincident with this 700th missive would be brilliant. Nonetheless, we anticipate price’s breaking above 2089 remains on the table during the course of this parabolic Long trend. From here at 2018 to 2089 is a span of 71 points: Gold’s “expected weekly trading range” is 64 points; thus in that vacuum, eclipsing 2089 in the new week is a bit out of range. As well, Gold’s most recent week scored a “higher high”, but a “lower close”: since Gold’s establishing the 2089 All-Time High 140 weeks ago, 24 of those have been down weeks incorporating a “higher high”. The average fallout in those cases within the ensuing four weeks is some -65 points, which from today’s 2018 “suggests” 1953, a level not distant from the 02 February dominant high of 1975. Thus we ought not be surprised should Gold retrench a bit into the 1900s, which themselves are structurally supportive and of course well above the current parabolic flip price of 1858:
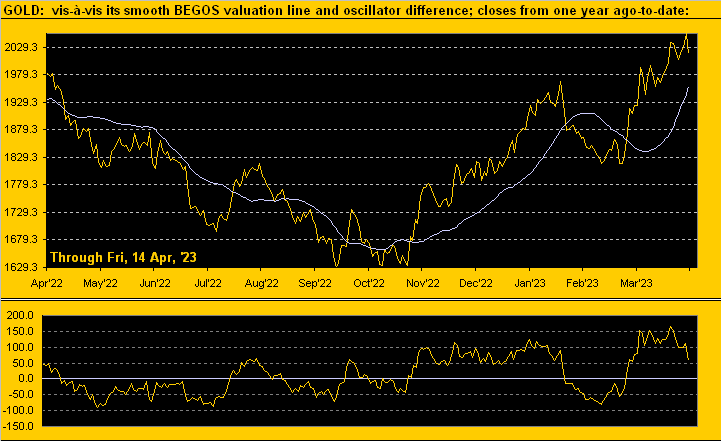
And by our valuing Gold vis-à-vis its smooth BEGOS line, price is some +59 points “high” per the oscillator in the lower panel of the following graphic; indeed the mid-point between “price” and “value” is at present 1988. So again, a bit more pullback would not be untoward in Gold’s broader drive to a new All-Time High:
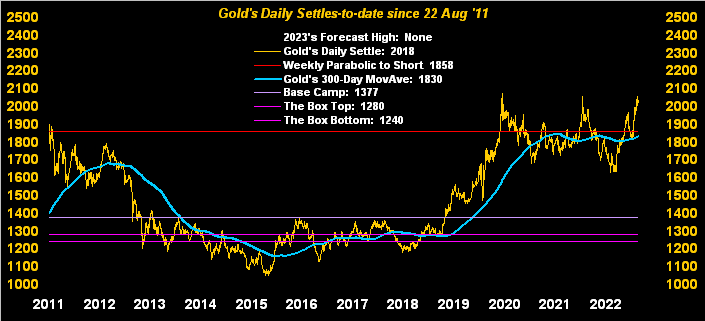
And speaking of broader, let’s next review our chart of Gold’s daily closes along with price’s 300-day moving average since the 1900 level was first achieved on 22 August 2011 ‘Twas back then when we specifically wrote of Gold having “gotten ahead of itself”. ‘Course the ensuing fallout was far more than we’d anticipated, price fortunately having since recovered in full. And forward from 2020, there’s that “triple top” which within trader hypotheses is “meant to be broken”, albeit more immediately Gold’s price appears some stretched above the blue average:
“But Gold is garnering more interest these days, right mmb? And congrats on No. 700 by the way…”
Squire, we couldn’t have done it without you: our thanks is beyond words. And you are spot on. For as pointed out in recent missives, today we hear more Gold buzz from non-Gold owners than since we began The Gold Update. “Where is Gold? How can I buy it? Is it too late?” Recall the late, great Richard Russell: “There’s never a bad time to buy Gold.” To which we add our 2¢: the time to consider selling some is when everybody wants it (and ’tis trading up in the five-digits).
Speaking of trading up, one wonders when the S&P 500 shall revert to reasonable valuation, (which given the aforementioned P/E and assuming no growth in the “E” calls for a “correction” in the “P” of -52% … that shan’t be on CNBS, Bloomy nor Foxy). As we oft quip: “Others parrot; we do the math.” And that includes doing the math for the Econ Baro, which in its present state relative to the stock market asserts that bad news is good:
The Baro this past week accounted for 14 incoming metrics of which 10 were worse period-over-period. The only positives of note came in sentiment courtesy of the University of Michigan’s “Go Blue!” survey, plus improvements for Industrial Production and Capacity Utilization. But with March’s Retail Sales again shrinking and (assuming you neither eat nor drive) core retail inflation down a pip but still running at nearly a 5% annualized rate, along with backups in both Wholesale and Business Inventories for February, the Baro on balance further eroded. Again, “means recession”?
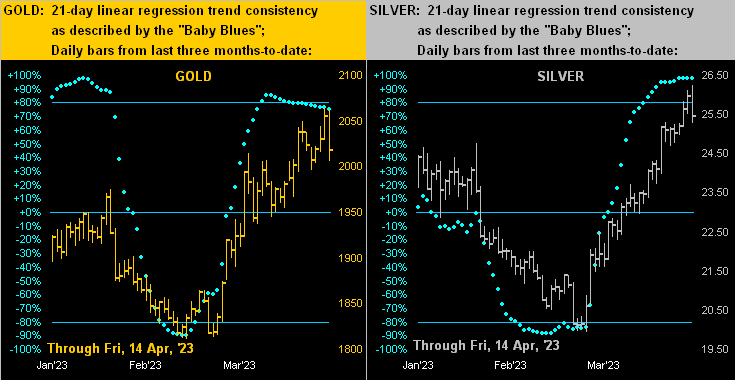
Hardly eroding having been the price tracks of the precious metals. For even if some normal retrenchment is in the near-term offing, ’tis hard to argue with the following two-panel display featuring the daily bars across the past three months-to-date for Gold on the left and for Silver on the right. However, Gold’s baby blue dots of regression trend consistency have slipped below their +80% axis, another sign of pending corrective activity. And should it be so, surely Sister Silver shall shiver:
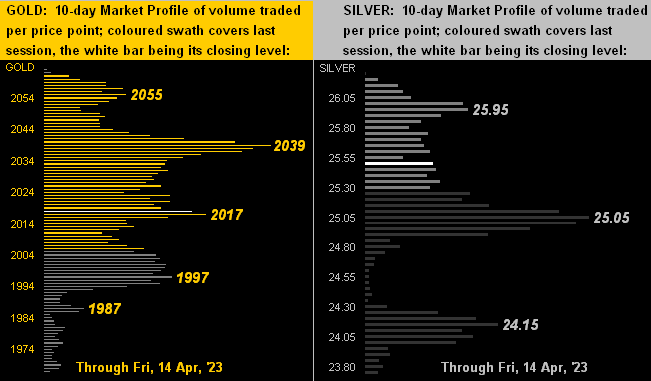
And thus to the 10-day Market Profiles for Gold (below left) and for Silver (below right). For both metals, price clearly has come off the respective highs recorded in the latter part of this past week. Again as noted a week ago for Gold, there’s that 2039 apex — which indeed was well penetrated to the upside — only to return to now being resistive. As for Sister Silver, ’tis all about holding above 25, albeit the 24s would now seem in store:
To sum it up for No. 700, our precious metals have had a significant run of late. From Gold’s year-to-date low of 1811 on 28 February, today at 2018 ’tis +11%. Similarly for Silver, her year-to-date low was just back on 10 March at 19.95 and today at 25.47 she’s +28% higher: that’s in just 25 trading days! Brava Sister Silver! To be sure some lower prices may ensue, but hardly do we believe these rallies are through.
Finally: our heartfelt BRAVO to all of YOU who across these many years have seen us through. From our direct readership to our re-publishers and those that further disseminate our missives, many, many thanks. On to No. 701 … and may Gold stay Bold as the next All-Time High is nigh!