Following a sharp up day for the Metals Triumvirate, all three elements are at present below their respective Neutral Zones for today, as is the Spoo; the balance of the BEGOS Markets are within same, and volatility is again moderate. At Market Trends, the Spoo’s “Baby Blues” are yet again further falling as the linreg consistency of the uptrend continues to weaken, whilst at Market Values the Spoo (in real-time) is +298 points above its smooth valuation line; and by Market Profiles, the most dominantly-traded price of the past fortnight is 5915; the “live” P/E for the S&P 500 itself is 47.0x. The Econ Baro is basically at its lowest level since 22 August, and due today are April’s Factory Orders.
 Mark
Mark
02 June 2025 – 08:34 Central Euro Time
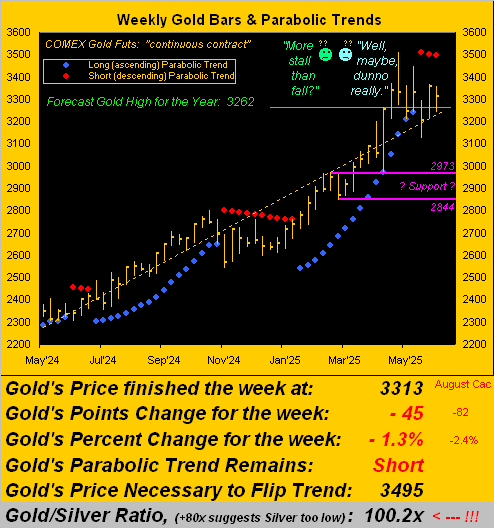
The sole BEGOS Market at present within today’s Neutral Zone is the Bond; below same is the Spoo and the balance of the bunch are above same; session volatility is moderate, and Copper notably already has traced 125% of its EDTR (see Market Ranges). The Gold Update sees price as having been more in a stall than a fall, albeit the weekly parabolic Short trend is entering its fourth week. The Spoo’s “Baby Blues” (see Market Trends) of linreg consistency continue to drop, whilst those for the Bond on Friday confirmed moving up above their -80%, suggesting further near-term recovery for price combined with some yield softening. The Econ Baro beings a fairly busy week with May’s ISM(Mfg) Index and April’s Construction Spending.
The Gold Update: No. 811 – (31 May 2025) – “Gold Doesn’t Fall So Much As Stall”

And just like that, five months of 2025 already are gone. Or as a fine friend over in the States is wont to say, as we age: “It goes quickly.”
But back in the late 18th century, the sixth President of the Commonwealth of Pennsylvania (one Benjamin Franklin) lived to be 84 years of age, far more than double the male longevity expectancy of then just 36 years. And “quickly” or otherwise, ol’ Ben is still going in continuing to grace the face of today’s $100 Federal Reserve Note. ‘Course in 1928, he already was on the Treasury’s $100 Bill, which as a Gold Certificate was thereto redeemable. In those days, Gold was fairly fixed-priced at $20.67/ounce, the $100 Bill thus convertible into 137 grams of Gold…
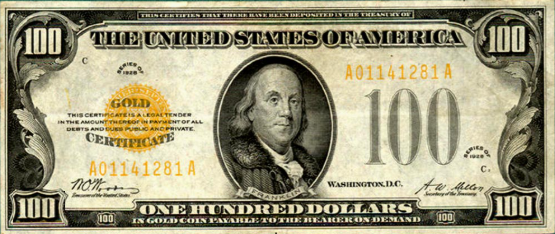
…whereas today’s $100 fetches less than one gram, (0.85 grams or 0.03 ounces).
Therefore: a lot can happen in less than 100 years. Shall your potentially centenarian children have enough to survive a century? Reprise: “Got Gold?“
Cheers!
…m…
www.TheGoldUpdate.com
www.deMeadville.com
and now on “X”: @deMeadvillePro
30 May 2025 – 08:29 Central Euro Time
The Euro, Gold and Silver are presently below their respective Neutral Zones for today; the balance of the BEGOS Markets are within same, and volatility is light. Gold — barring turning ’round into an up day — is en route to recording a fourth down week in the last six, albeit price hasn’t (yet?) materially succumbed to the recently new weekly parabolic Short trend; more of course in tomorrow’s 811th consecutive Saturday edition of The Gold Update. Yesterday was a “failure day” for the Spoo, the entirety of its intra-day +82 gain being hoovered away; still, the S&P MoneyFlow has been robust across all three of our timeframes (see S&P 500/Moneyflow), and technically, the Spoo’s daily parabolics just flipped from Short-to-Long at today’s open; either way, the overvaluation of the S&P remains critical. The Econ Baro wraps the week, indeed the month, with May’s Chi PMI and revised UofM Sentiment Survey, plus April’s Personal Income/Spending and (the BIG event) “Fed-favoured” PCE inflation data. “Sell in May and go away”? On verra…
29 May 2025 – 08:38 Central Euro Time
The Bond, Euro and Swiss Franc all are at present below today’s Neutral Zones, whilst above same are Silver, Oil and the Spoo; session volatility is moderate-to-robust, the Spoo notably having already traced 103% of its EDTR (see Market Ranges). By Market Values, the Spoo (in real-time) is now +449 points above its smooth valuation line and the futs-adj’d P/E of the S&P 500 is 47.1x; by Market Trends, the Spoo’s “Baby Blues” of linreg consistency have yet again slipped in spite of this up session. Looking at correlations for the five primary BEGOS Markets, the best continues to be positive between the Euro and Gold; too of note is the negative correlation between Gold and the Spoo. Amongst today’s incoming metrics for the Econ Baro are April’s Pending Home Sales and the first revision to Q1 GDP.
28 May 2025 – 08:32 Central Euro Time
Both the Euro and Copper are at present below today’s Neutral Zones; the balance of the BEGOS Markets are within same, and session volatility is light. Gold is picking up +27 points of fresh premium as the cac volume rolls from June into that for August; too, the Bond’s cac volume is moving from June into September. Despite yesterday’s strength in the Spoo (+2.2%), the “Baby Blues” of trend consistency are lower still today in real-time, again suggesting a return (as previously noted) into the low 5700s/5600s, (barring the Blues getting a grip). Looking at Market Rhythms, on a 10-test basis our current leaders for pure swing consistency are Gold’s 6hr MACD, the Spoo’s 12hr Parabolics, the Bond’s 15mn EMA, and the non-BEGOS Yen’s 1hr EMA; on a 24-test basis, we’ve the Yen’s daily Price Oscillator, the Euro’s 30mn MACD and Gold’s 4hr Parabolics along with its 30mn MACD. Nothing is due today for the Econ Baro. And late in the session come the FOMC minutes from the 06/07 May meeting.
27 May 2025 – 08:30 Central Euro Time
The two-day GLOBEX/BEGOS Markets’ session continues, now finding the Bond, Euro and Spoo above their respective Neutral Zones, whilst below same are Gold and Copper; session volatility is firmly moderate, the Bond notably having traced 119% of its EDTR (see Market Ranges). By Market Trends, three are sporting positive linregs: Silver, Oil and the Spoo; however with respect to the latter, as noted yesterday the Spoo’s “Baby Blues” have fallen below their +80% axis, despite the current session’s up strength. Per the Spoo’s 10-day Market Profile, the overheard dominant volume resistors (price currently 5883) are 5908, 5938, and 5959. And by Market Rhythms, for the Spoo’s pure swing consistency, its current best study is the 12hr Parabolics. The Econ Baro awaits May’s Consumer Confidence and April’s Durable Orders.
26 May 2025 – 08:41 Central Euro Time
The StateSide holiday elicits a two-day session (with Tuesday settle) for the GLOBEX/BEGOS Markets. Thus far we’ve both the Bond and Gold below today’s Neutral Zones, whilst above same are both the Euro and Spoo; session volatility is mostly moderate. The Gold Update cites the very firm week (+4.8%) for the yellow metal, however reminds that the weekly parabolic trend is Short. The Spoo is off to a robust start for this week (at present +1.2%); yet as suggested in Friday’s comment, by Market Trends, the Spoo’s “Baby Blues” of linreg trend consistency have now (provisionally in real-time) fallen below the key +80% axis, indicative of lower levels near-term, perhaps into the lower 5700s/5600s by price structure; indeed the Spoo by Market Values is (in real-time) +377 points above its smooth valuation line. 11 incoming metrics are due for the Econ Baro as the week unfolds, notably April’s “Fed-favoured” PCE come Friday.
The Gold Update: No. 810 – (24 May 2025) – “Gold’s Bull Snorts and Boffs the Shorts”

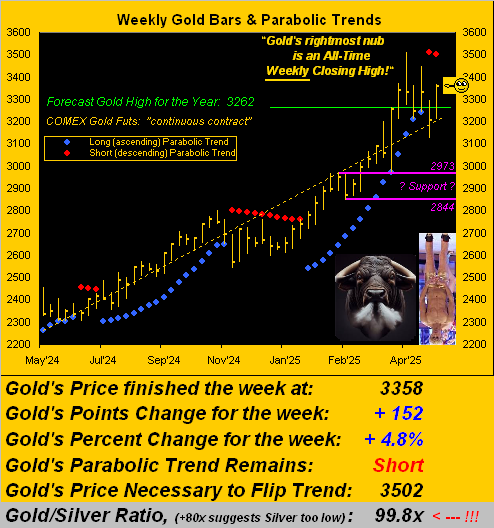

So in a nugget: Gold’s daily trend is up within a weekly trend that is down. And during the ensuing holiday-shortened trading week come 11 metrics for the Econ Baro, included as noted “Fed-favoured” inflation data per the PCE. Where shall Gold be, let alone the S&P? To speak fundamentally, the former remains undervalued whilst the latter severely overvalued. (So much for the ol’ “EMH” Efficient Market Hypothesis). For today, less yield (S&P 1.321%) is better than more yield (T-Bill 4.230%). “But Gold is yield-less!” they say. And yet ‘from 2001, ’tis outperformed the S&P (including dividends) by nearly three times! Gold wins.
Speaking of sports, tomorrow (Sunday) is race day here. Hat-tip Steinmetz Diamonds: how about a Gold, diamond-encrusted F1 car?

Whereas in racing ’tis best not to venture beyond the edge of adhesion, go for the Gold with all due reason!
Cheers!
…m…
www.TheGoldUpdate.com
www.deMeadville.com
and now on “X”: @deMeadvillePro
23 May 2025 – 08:33 Central Euro Time
At present the Euro, Swiss Franc, Gold and Silver are above today’s Neutral Zones, while below same is the Spoo; session volatility for the BEGOS Markets is light. Gold — currently in the first week of its fresh parabolic Short trend — had seen its daily parabolics flip to Short effective 01 May: yesterday that study reversed to Long; obviously the broader measure (weekly) carries more price swing import, and we’ll of course further assess the situation in tomorrow’s 810th consecutive Saturday edition of the Gold Update. The Spoo’s daily MACD appears poised to make a negative crossover into early next week; (note the five-hour Spoo trading halt during Monday’s StateSide observance of Memorial Day); too, the Spoo’s “Baby Blues” (see Market Trends) are curling over such that a breach of the +80% axis looks to occur early in the new week. And the Econ Baro wraps its own week today with April’s New Home Sales.
22 May 2025 – 08:34 Central Euro Time
Both Gold and Copper are at present above today’s Neutral Zones; the balance of the BEGOS Markets are within same, and session volatility is moving toward moderate. Topping Market Rhythms for pure swing consistency we’ve (on a 10-test basis) both the non-BEGOS Yen’s 1hr Price Oscillator and 1hr EMA (the Yen now higher for an eighth consecutive day), along with Gold’s 6hr MACD and the Spoo’s 12hr Parabolics (which flipped to Short yesterday at 12:00 CET; too in real-time, the Spoo by Market Values is +387 points above its smooth valuation line); plus (on a 24-test basis) we’ve the Yen’s daily Price Oscillator, Copper’s 4hr Parabolics along with Gold’s 4hr Parabolics, and the Bond’s 1hr Price Oscillator. Included in today’s metrics for the Econ Baro are Existing Home Sales for April.
21 May 2025 – 08:22 Central Euro Time
Gold, despite its now being in a weekly parabolic Short trend, nonetheless is having a very firm week thus far, currently +108 points from last Friday’s settle; the yellow metal for today is at present above its Neutral Zone, as too are the Euro, Swiss Franc and Oil; below same are both the Bond and Spoo. Volatility for the BEGOS Markets is moderate, Oil itself having already traded 102% of its EDTR (see Market Ranges). The non-BEGOS Yen is rising for a seventh consecutive day, a streak which has occurred but once this decade-to-date, (following which it swiftly took a -3% tumble in early December 2022). Amongst the five primary BEGOS components, the best current correlation is positive between the Euro and Gold. And the quiet week continues for the Econ Baro, again with no metrics due today.
20 May 2025 – 08:38 Central Euro Time
The “life-cycle” of the Moody’s StateSide debt downgrade was short-lived, the S&P 500 concluding yesterday in the black: the Index is now 16 consecutive trading days “textbook overbought” and the Spoo in real-time +497 points above its smooth valuation line, even as at present the Spoo along with Gold and Copper are below today’s Neutral Zones; the balance of the BEGOS Markets are within same, and volatility is mostly light. By Market Trends, the Euro’s “Baby Blues” of linreg consistency have provisionally curled up above their -80% axis; confirmation by settle would be indicative of still higher Euro levels near-term, although structurally there does not appear to be that much room to move materially up: currently 1.1270, there is Market Profile resistance in the 1.1370 to 1.1390 zone. Nothing is due today for the Econ Baro, which nonetheless has taken a bit of a hit of late.
19 May 2025 – 08:43 Central Euro Time
The Bond, Oil and Spoo are all at present below their respective Neutral Zones for today, whilst above same are the Euro, Swiss Franc, Gold and Silver; BEGOS Market’s volatility is pushing toward moderate. The Gold Update points to the yellow metal’s weekly parabolic trend having flipped from Long-to-Short, with 2973-2844 as a support zone reasonably to be tested. The “late to the party” Moody’s downgrade of U.S. credit is nonetheless getting the safe havens the bid to begin the week; regardless, the Dollar Index (albeit -0.5% today) still hovers above the 100 handle. Support for the Spoo by its 10-day Market Profile initially shows at 5909, followed by 5864. And ’tis a very quiet week for the Econ Baro with just four metrics due, beginning today with April’s Leading (i.e. “lagging) Indicators, which by the “leading” Baro we already “know” ought be negative.


16 May 2025 – 08:39 Central Euro Time
Into week’s end we’ve at present the Bond, Euro and Swiss Franc above today’s Neutral Zones, whilst below same are both Gold and Silver; BEGOS Markets’ volatility is light. Of note by Market Ranges, Gold’s EDTR is 89 points (vs. 35 a year ago) whilst that for Silver is 0.88 points (not that far from 0.75 points a year ago); the Gold/Silver ratio is 99.0x (vs. the century-to-date average of 69.0x); more on it all in tomorrow’s 809th consecutive Saturday edition of The Gold Update. Meanwhile for the S&P 500, its “live” P/E (futs-adj’d) is 45.8x and the yield 1.313% vs. the U.S. T-Bill’s risk-free annualized yield of 4.258%. The Econ Baro looks to these incoming metrics in concluding the week: April’s Housing Starts/Permits and Ex/Im Prices, along with May’s UofM Sentiment Survey. Today wraps up Q1 Earnings Season for 2025, which for year-over-year quarterly improvement specific to S&P 500 constituents has essentially been average.
15 May 2025 – 08:25 Central Euro Time
Both the Euro and Swiss Franc are at present above today’s Neutral Zones, whilst below same are Gold, Silver, Oil and the Spoo; session volatility for the BEGOS Markets is pushing toward moderate. Gold confirmed a negative crossing of its smooth valuation line (see Market Values): this is of course a Short signal, albeit as we regularly quip “Shorting Gold is a bad idea”; still, a run from here (3137) down to 3000 wouldn’t seen untoward, price having established a plateau there back in February. Oil’s cac volume is rolling from June into that for July. And the Econ Baro is poised to take in 11 metrics today, amongst which are May’s NY State Empire Index, Philly Fed Index and NAHB Housing Index, along with April’s Retail Sales, PPI and IndProd/CapUtil, plus March’s Business Inventories.
14 May 2025 – 08:46 Central Euro Time
Both Gold and Silver are at present below today’s Neutral Zones; the balance of the BEGOS Markets are within same, and volatility is quite light. Gold has nearly closed the long-running deviation above its smooth valuation line (see Market Values): in real-time, price is now just +10 points over the line, after having been as much (on a closing basis) as +440 points “high” back on 21 April; (and as previously noted, Gold’s weekly parabolic trend provisionally has flipped from Long-to-Short). Gold’s best Market Rhythm for pure swing consistency on a 10-test basis is currently the 6hr MACD; on a 24-test basis ’tis the 4hr parabolics. Nothing is due today for the Econ Baro ahead of a barrage featuring 16 incoming metrics from tomorrow into Friday; of note per yesterday’s CPI data, inflation’s pace increased during April.
13 May 2025 – 08:34 Central Euro Time
As posted yesterday on ‘X’, Gold’s weekly parabolic trend has provisionally flipped from Long-to-Short; barring Gold improbably making an All-Time High this week (above 3510), the new Short trend shall confirm upon Friday’s settle. At present, both Gold and Silver, along with the Euro and Swiss Franc are above their respective Neutral Zones for today, whilst below same is the Spoo; session volatility is light. Yesterday’s gap-up open for the S&P 500 was by points the largest in its 68-year history; the Index through the past 11 days is “textbook overbought” and the Spoo (in real-time) is +384 points above its smooth valuation line (see Market Values); the futs-adj’d “live” P/E for the Index is 44.3x. The Econ Baro looks to the first report of April’s inflation via the CPI.
12 May 2025 – 08:39 Central Euro Time
Copper is the sole BEGOS Market at present within its Neutral Zone for today; below same are the Bond, Euro, Swiss Franc, and Gold, whilst above same are Silver, Oil and the Spoo; volatility is mostly moderate. The Gold Update gives evidence to the yellow metal’s great rally potentially having run out of puff: purported progress of tariff resolution issues is drawing money from the safe havens into equities and the Dollar. Were the S&P 500 to open at this instant, the Spoo as adjusted for fair value places the Index +1.5%, (and the “live” P/E at 43.6x); the Spoo in real-time is +297 points above its smooth valuation line, see Market Values). The Econ Baro begins it busy week of 19 incoming metrics with April’s Treasury Budget due late in the session. And this is the final week of Q1 Earnings Season.
The Gold Update: No. 808 – (10 May 2025) – “Gold Regains Ground (albeit Stumbles Around…)”


In sum, its emotive hype aside, we still anticipate a bit lower Gold near-term; (indeed a most-valued colleague here suggested yesterday — over a delightful rosé — that 2400 is in the offing). That’s a bit out of range (-24%) from our perspective; however, Gold obviously has corrected by at least such percentage, notably during 2006-to-2008, certainly so post-2011’s All-Time High through 2015, as well as during 2019-to-2020. ‘Tis merely what the world’s major liquid financial markets on occasion do.
Next week also brings the calendar conclusion to Q1 Earnings Season, which to this point for the S&P 500 constituents is “average” for year-over-year quarterly improvement. ‘Course as you saw earlier in the Economic Barometer, the S&P 500’s price/earning ratio is an inane 43.0x. Thus earnings are on balance improving, but their overall level remains far too low to continue supporting price; (how’s that 1.359% annualized dividend yield workin’ out for ya?)
And specific to the Econ Baro, a huge load of 19 metrics are scheduled for the ensuing week. Shall the Baro live up to the Fed’s “solid pace” perception of the economy? As ever, we’ll mind the math…

…whilst you, rather than stumble around, mind — indeed mine — your Gold and Silver fine!
Cheers!
…m…
www.TheGoldUpdate.com
www.deMeadville.com
and now on “X”: @deMeadvillePro
09 May 2025 – 08:42 Central Euro Time
Into week’s end we’ve at present Gold above its Neutral Zone for today and Copper below same; session volatility for the BEGOS Markets is pushing toward moderate. At Market Trends, our “Baby Blues” of linreg consistency are falling for all eight BEGOS components, albeit the only two currently with actual declining trends are the Swiss Franc and Oil. By Market Values for the five primary entities in real-time time: the Bond is 2^09 points “low” vis-à-vis its smooth valuation line, the Euro just 0.001 points “high”, Gold +155 points “high”, Oil -4.77 points “low” and the Spoo +220 points “high”. The S&P 500 is now textbook overbought through the past nine trading days. With one week still to run for Q1 Earnings Season, 427 S&P 500 constituents have reported of which 66% (282) have beaten their EPS of their like quarter a year ago. Nothing is due for the Econ Baro, it having concluded its week yesterday. Tomorrow brings our 808th consecutive Saturday edition of The Gold Update.
08 May 2025 – 08:20 Central Euro Time
The Swiss Franc is at present below its Neutral Zone for today, whilst above same are Silver, Copper, Oil and the Spoo; BEGOS Markets’ volatility is light-to-moderate. Amongst correlations of the five primary BEGOS components, that for Gold is notably positive with the Euro, however negatively so with the Spoo. Oil’s 12hr MACD embarked on a flip from Short-to-Long effective yesterday at12:00 (CET): year-to-date this has been a very respectable Market Rhythm, and in real-time by Market Values, Oil is -6.92 points below its smooth valuation line. The Econ Baro rounds out its week today, incoming metrics including March’s Wholesale Inventories and Q1’s initial read of Productivity and Unit Labor Costs.
07 May 2025 – 08:26 Central Euro Time
The Swiss Franc, Gold and Copper are all presently below today’s Neutral Zones, whilst above same are both Oil and the Spoo; session volatility for the BEGOS Markets to this hour continues as moderate. Looking at Market Rhythms at those currently displaying the best pure swing consistency: on a 10-test basis we’ve the Spoo’s 12hr Parabolics as well as its 4hr Moneyflow, plus the non-BEGOS Yen’s daily Price Oscillator; on a 24-test basis ’tis again the same for the Yen, along with Gold’s 2hr Parabolics. At Market Magnets, both the Euro and Silver yesterday confirmed positive crossings of price above Magnet, suggestive of higher levels near-term. Late in the session, the Econ Baro looks to March’s Consumer Credit, preceded an hour earlier by the week’s highlight of the FOMC’s Policy Statement, the consensus for which is no change in the Bank’s Funds rate.
06 May 2025 – 08:43 Central Euro Time
Both the Bond and Swiss Franc are at present below their Neutral Zones for today; above same are Gold, Silver and Oil, and BEGOS Markets’ volatility is yet again moderate to this point of the session. Gold has gained some +130 points since our querying (at 3247) about its great run being done: presently 3371, price is “only” -139 points below the 3510 All-Time High; by its Market Profile, Gold’s most dominant volume support price is 3324; and the yellow metal’s best Market Rhythm for pure swing consistency (10-test basis) is its 6hr MACD, in which hindsight vacuum $57k/cac has been generated since late February, and which swung from Short to Long yesterday at 12:00 (CET). The Econ Baro awaits March’s Trade Deficit.
05 May 2025 – 08:38 Central Euro Time
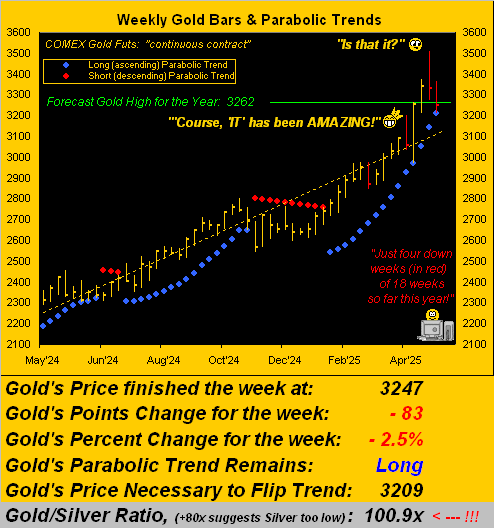
The Euro, Gold and Silver are all at present above today’s Neutral Zones; below same is the Spoo, and volatility for the BEGOS Markets is again moderate. The Gold Update queries as to the yellow metal’s great run being done (for now): price is within a day’s range of flipping the weekly parabolic trend from Long to Short (effective 3209); Gold’s EDTR (see Market Ranges) is 83 points.; and by Market Values (in real-time) Gold remains +164 points above its smooth valuation line. Q4 Earnings Season still has some two weeks to run: with 337 S&P 500 constituents having reported, 220 have bettered their bottom lines from Q1 a year ago; such 65% rate of improvement is a bit below the typical 66% pace. The Econ Baro begins a light week with April’s ISM(Apr) Index. And Wednesday brings the FOMC’s next policy statement for which consensus sees no change in.
The Gold Update: No. 807 – (03 May 2025) – “Is Gold’s Great Run Finally Done (for now…)?”

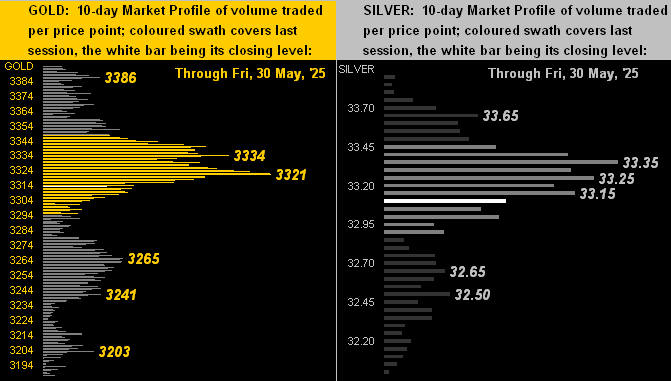
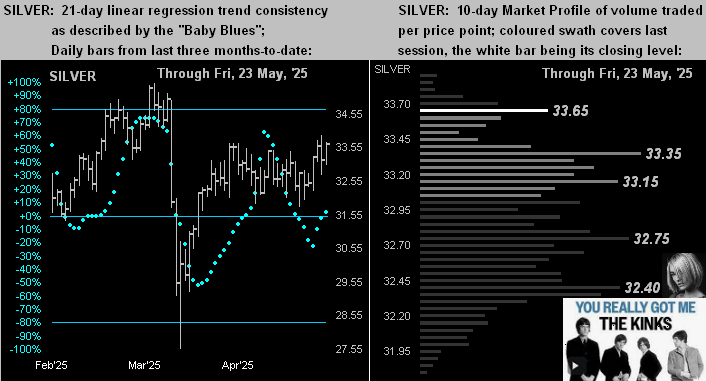
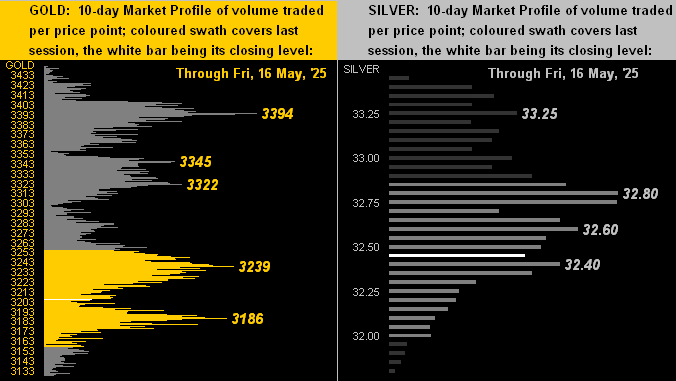
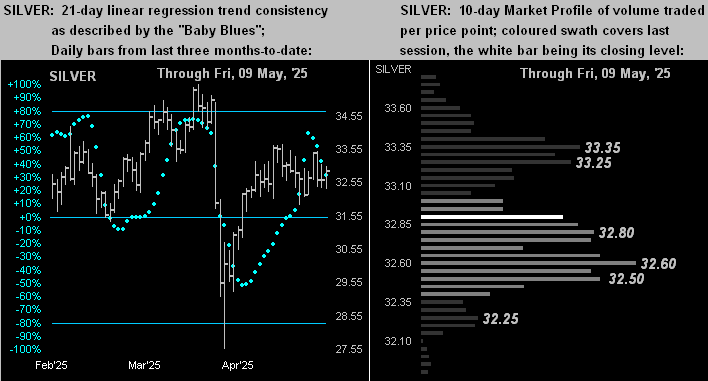
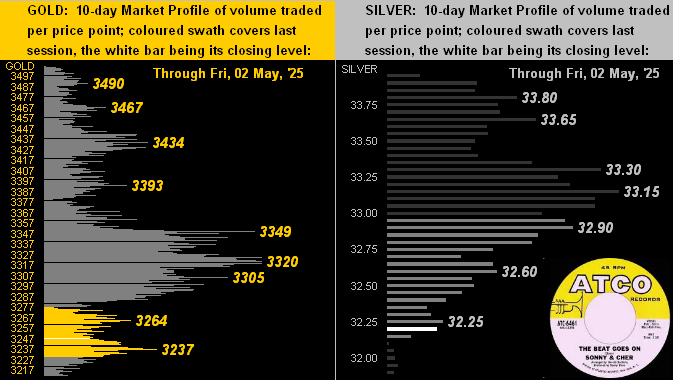
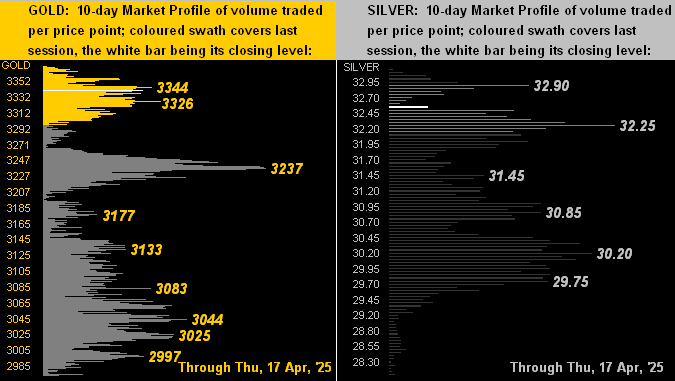
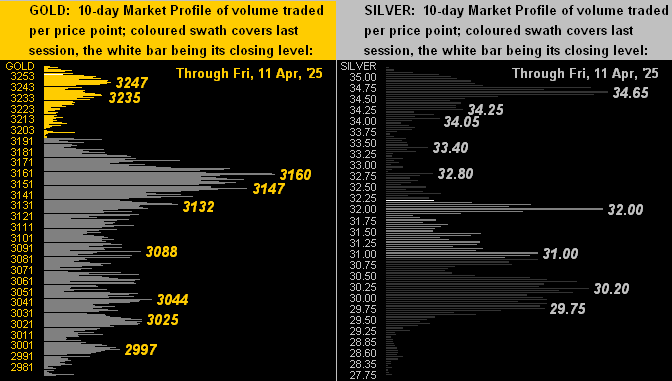
Further for the precious metals, here next are the 10-day Market Profliles for Gold on the left and Silver on the right. With present prices for the yellow and white metals all but at the bottom of their respective Profiles, both have taken a bit of a beat-down. Either way, as crooned the darling duo Sonny & Cher back in ’67, ![]() “The beat goes on…”
“The beat goes on…”![]() :
:
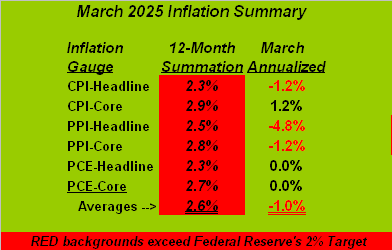
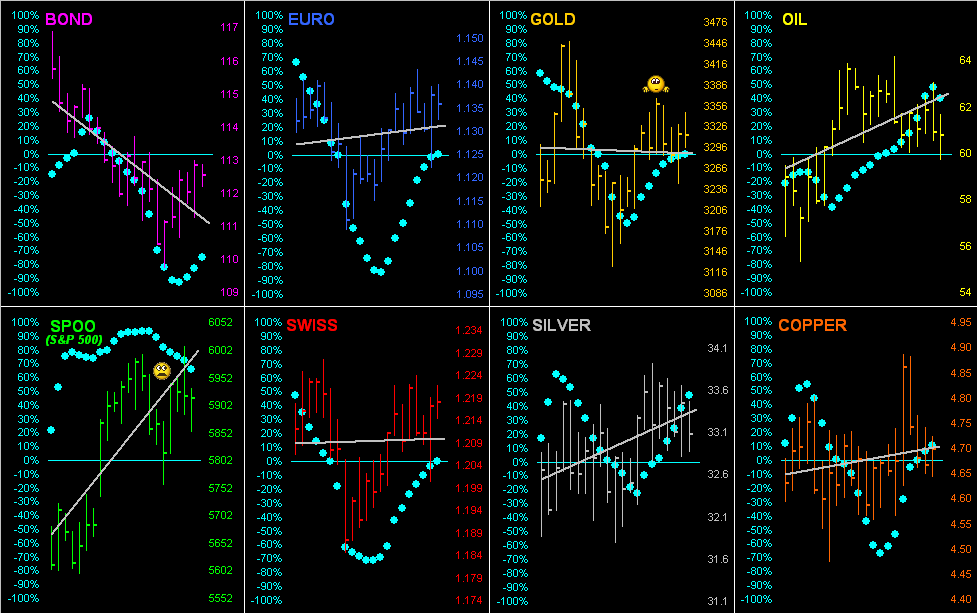
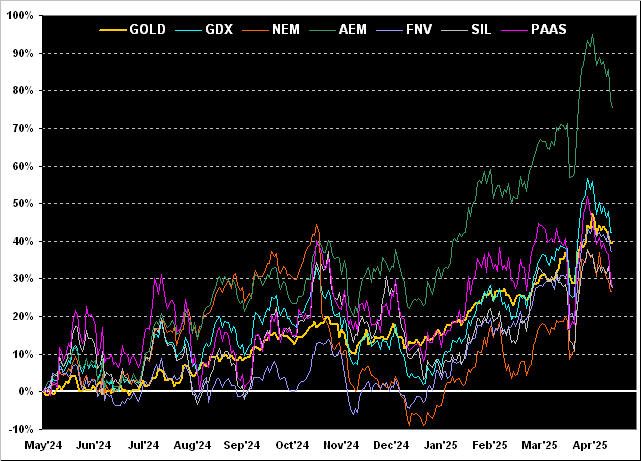
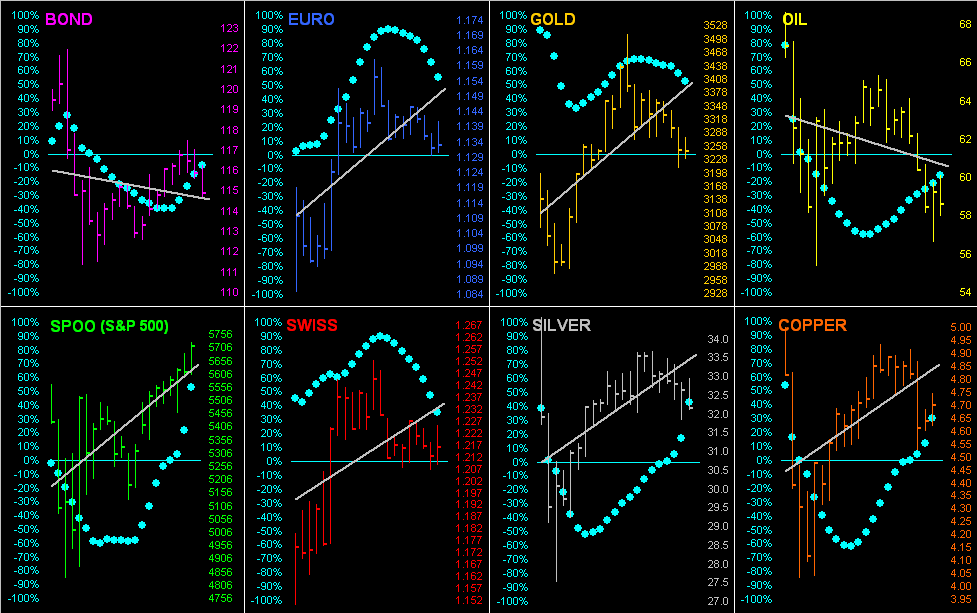
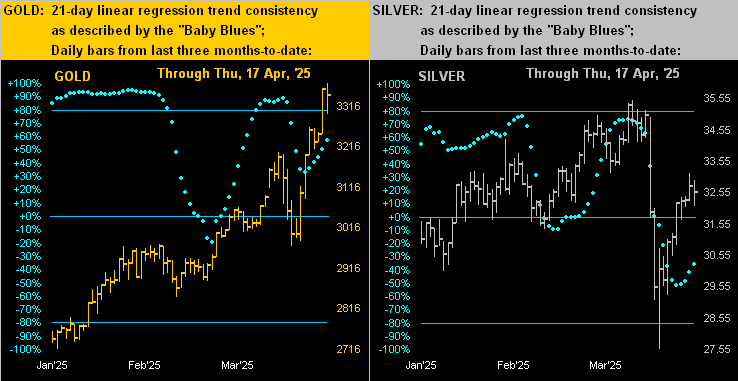
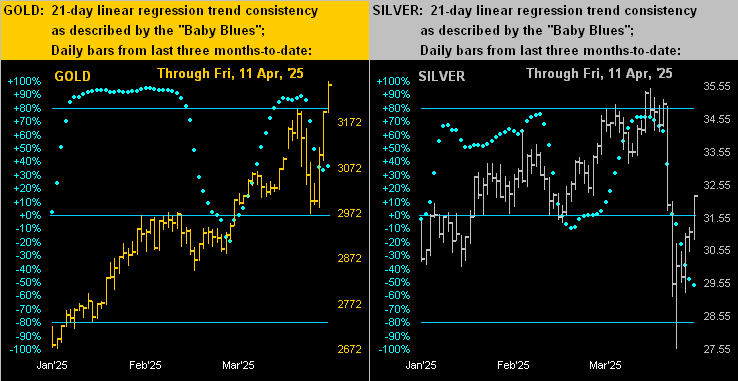
Regardless, ‘twould appear Wall Street sees inflation as having ceased, and per CNBC, “…stocks claw back tariff losses…” you see. Thus: let the Fed cut sans impunity, if you please! What do the BEGOS Markets see? Let’s go ’round the horn for all eight BEGOS components across their past 21 trading days (one month) with their respective grey trendlines and our famous “Baby Blues” of day-to-day regression trend consistency. And as the Dollar returns to getting a bit of a bid, note the blue dots rolling over to the downside for the Euro, Swiss Franc and Gold. All together now: ![]() “Follow the Blues instead of the news, else lose yer shoes”
“Follow the Blues instead of the news, else lose yer shoes”![]() :
:
“But mmb, in B-school they said stocks are a hedge against inflation, just like gold, eh?“
True enough, Squire. However, we were also taught (to yet again reprise Jerome B. Cohen): “…in bull markets the average [price/earnings] level would be about 15 to 18 times earnings…” Today, ridiculously beyond rationality, the “live” (i.e. trailing 12-months) p/e for the S&P settled the week yesterday at 43.9x(!) In other words: with stock prices unsupported by earnings, GDP shrinking, the economy showing signs of stagflation, and a liquid money supply that can only cover 44% of the “money” currently invested in the S&P 500, ’tis not the time to say to stocks “Buy-Buy!”, but rather “Bye-Bye!”
As for the slipping precious metals, think “Dip-Buy!”

Cheers!
…m…
www.TheGoldUpdate.com
www.deMeadville.com
and now on “X”: @deMeadvillePro
02 May 2025 – 08:38 Central Euro Time
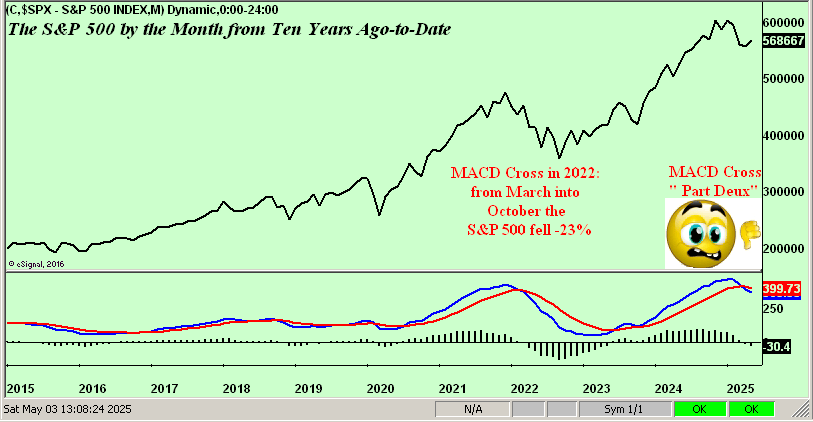
Save for the Bond which at present is inside its Neutral Zone for today, the seven other BEGOS Markets are above same; session volatility is moderate. Going ’round the Market Values horn in real-time for the five primary BEGOS components: the Bond shows as essentially on its smooth valuation line, the Euro as +0.0393 points “high”, Gold as +180 points “high”, Oil as -6.56 points “low” and the Spoo as +160 points “high”. The S&P 500 itself week-to-date remains “textbook overbought” and the futs-adj’d “live” p/e is 43.0x; on the S&P’s monthly chart, its MACD confirmed a negative crossing as May got underway: the last such negative crossover occurred in April 2022 leading to a more than -1,000 points (-14.5%) decline into November. ‘Tis April’s Payrolls day for the Econ Baro, along with March’s Factory Orders.
01 May 2025 – 08:42 Central Euro Time
The Euro, Gold and Silver are all at present below their respective Neutral Zones for today; above same is Copper, and session volatility for the BEGOS Markets is light-to-moderate. Indeed, the Euro’s “Baby Blues” (see Market Trends) of trend consistency confirmed crossing below the +80%; we’re anticipating the low 1.12s from here, perhaps even the upper 1.11s as the Dollar is showing a bit of resilience with a positive MACD swing on the Buck’s daily chart. Gold continues to work toward closing the gap down to its smooth valuation line (see Market Values), price in real-time however still +167 points “high”. For correlation amongst the five primary BEGOS components, the current best is positive between Gold and the Euro. And included in today’s incoming metrics for the Econ Baro are April’s ISM(Mfg) Index and March’s Construction Spending.
30 April 2025 – 08:12 Central Euro Time
The year’s first quadrimester concludes with significant input for the Econ Baro: nine metrics come due, amongst which are April’s ADP Employment data and the Chi PMI, March’s “Fed-favoured” PCE report along with Personal Income/Spending and Pending Home Sales, plus the first peek at Q1’s GDP along with the Employment Cost Index. Ahead of it all at present we’ve Copper as the sole BEGOS Market outside (below) today’s Neutral Zone, and session volatility is very light, again within the context of EDTRs (see Market Ranges) having widened considerably this month. At Market Trends, the Euro’s “Baby Blues” of trend consistency are in real-time moving below their key +80% axis such that we look for lower prices near-term; too by Market Values, the Euro is (in real-time) +0.046 points above its smooth valuation line; a run from here in the 1.14s down into the 1.12s wouldn’t be untoward over the ensuing days/week or two.
29 April 2025 – 08:38 Central Euro Time
The Euro, Swiss Franc and Gold are all at present below today’s Neutral Zones; the other five BEGOS Markets are within same, and volatility is light. The S&P 500 (5529) has returned to being “textbook overbought” for the first time since 20 February (then 6118); indeed the Spoo — which had been below its smooth valuation line (see Market Values) for some two months — has finally (in real-time) reverted back up to it such that still higher price levels ought be expected; however, the S&P’s “live” P/E (futs-adj’d) is at this moment an ever so expensive 42.5x, and the yield a wee 1.394% vs. the 3-month US T-Bill’s 4.193% annualized. Meanwhile Gold, by its smooth valuation line remains excessively “high”, in real-time +278 points above said line. The Econ Baro gets its week going today with April’s Consumer Confidence.
28 April 2025 – 08:37 Central Euro Time
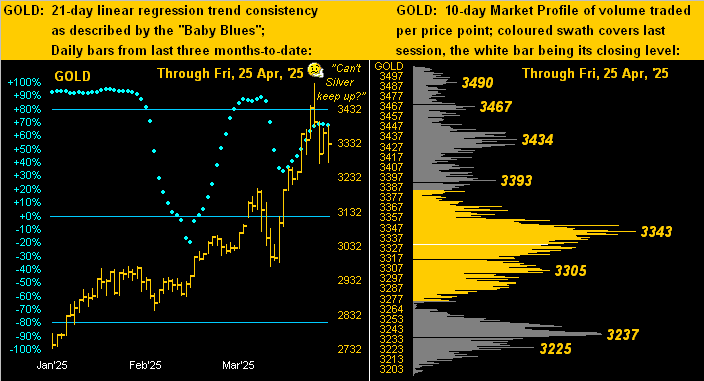
At present, the Swiss Franc plus all three elements of the Metals Triumvirate are below today’s Neutral Zones; the balance of the BEGOS Markets are within same, and volatility to begin the week is mostly light. The Gold Update continues to cite price’s near-term over-valuation; however with Gold down today, by Market Values, price — which on a closing basis had been as much as +440 “high” above its smooth valuation line — is now (in real-time) +262 points “high” above completing reversion to said “mean”; by its Market Profile, Gold’s most volume-dominant resistor is 3343, the like supporter being 3238; and Gold’s EDTR (see Market Ranges) is now 92 points. ‘Tis a very busy week for the Econ Baro: whilst nothing is due for today, the rest of the week has 18 incoming scheduled metrics, including on Wednesday the “Fed-favoured” PCE Index for March’s inflation.
The Gold Update: No. 806 – (26 April 2025) – “Gold Morphs into a Meme Stock”
Remember this ol’ tagline from the ’70s? “When E.F. Hutton talks, people listen!”
Fast-forward to today and ’tis “When Goldman talks, people pile on!” For the Morgans et alia, too, the same holds true.
Far be it from The Big Houses to facilitate mathematical justification. Rather:
- Just announce “Here comes 4000 Gold, for recession shall unfold!”;
- Then reprise Tag Team from ’93 with
 “Whoomp! (There It Is)”;
 - And in mere hours Gold morphs into a straight up meme stock as if ’twere GameStop.
In that same critical vein, this past week a fine friend and valued colleague shared these words from Mark Clubb, Executive Chairman at the wealth/asset management financial services firm TEAM PLC: “…there is undoubtedly too much noise in financial advice today … dressed up as wisdom and too many professionals repeating slogans instead of offering substance…” We agree.
Regardless: if “4000 Gold!” is the call, let’s just immediately put price there. “We don’t need no stinkin’ analysis!”
For more perspective we’ve this. Across the 644 months which have passed since President Nixon nixed The Gold Standard back in ’71 — with still three trading days left in this April’s balance — Gold has already set the record for its largest intra-month low-to-high points-gain in history: +540!
Impressive as well on a percentage basis, the +18.2% intra-month gain ranks 15th-best since said nixing. As for the 14 other even-better intra-month gains, Gold on average then fell by -11.7% within three months, suggesting that sub-3000 from here is very realistic moving forward. ‘Tis just the way Gold has traded — at least historically — once the euphoria wears off.
Still, here’s a real show-stopper: from January’s low just three months ago (2625), Gold has come to within 115 points of having gained $1,000/oz! Cue the late great “Bullet” Bill King: “Holy Toledo!!”
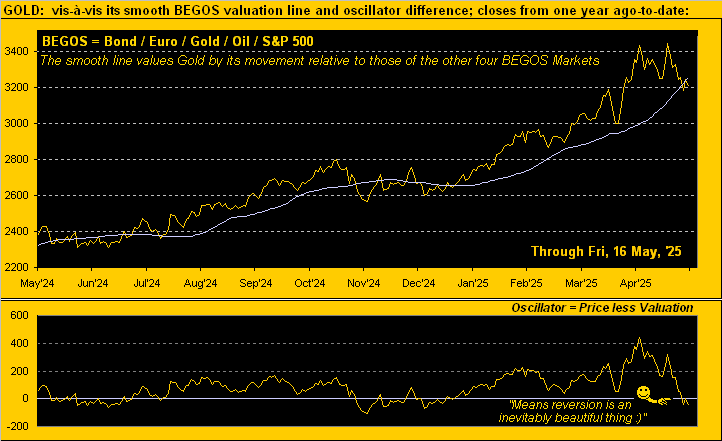
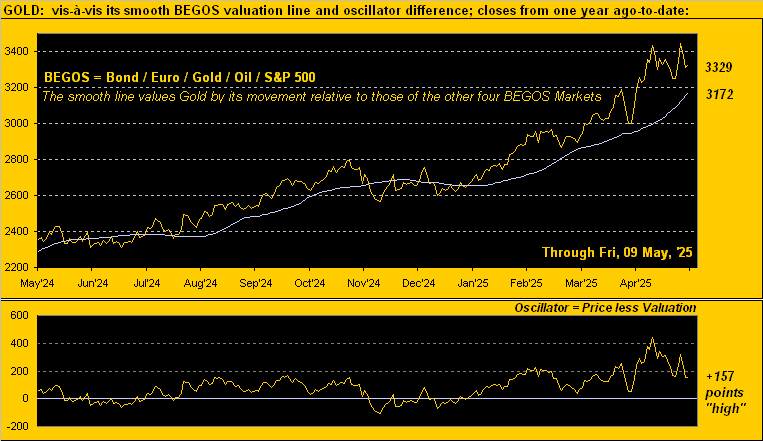
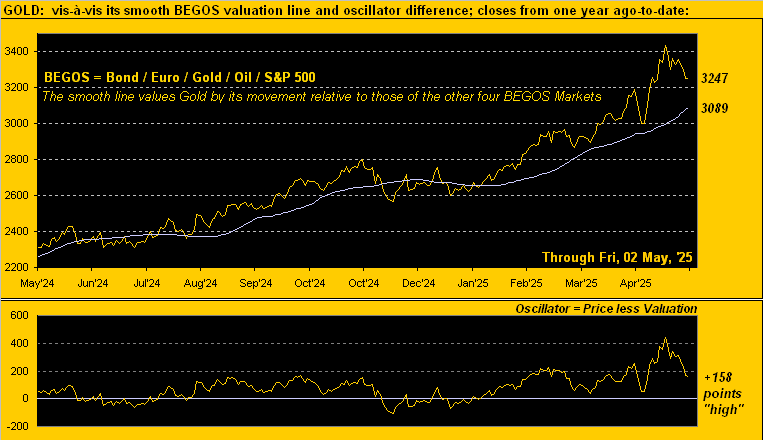
‘Course, there’s still the party-pooper fly in the ointment — for just as do meme stocks — following Gold’s latest All-Time High of 3510 recorded this past Tuesday, price come Wednesday fell as much as -239 points (-6.8%) to 3271 toward settling the week yesterday (Friday) at 3330. No, Gold did not reach down to the 3237 Market Profile support level as prognosticated a week ago; but by our near-term technical BEGOS Markets Value measure, price remains +302 points too “high”:
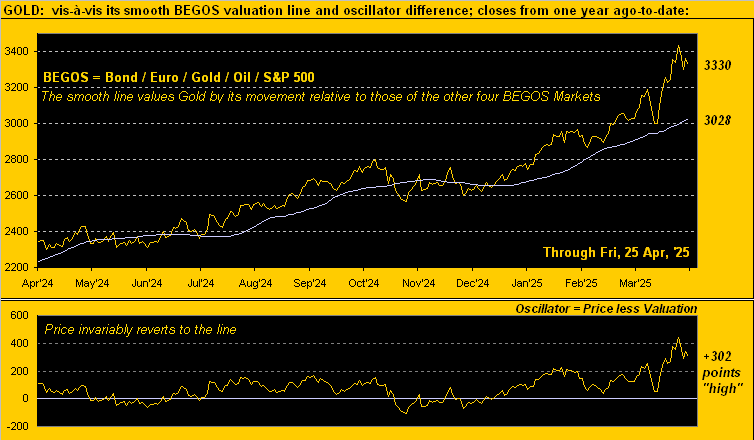
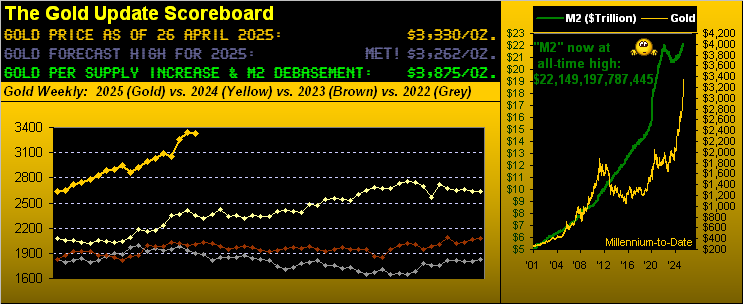
And as it has always done, we anticipate Gold (3330) sorting itself out with respect to the above chart’s BEGOS valuation (3028), such rising smooth line itself this past week having averaged a daily gain of +8 points.
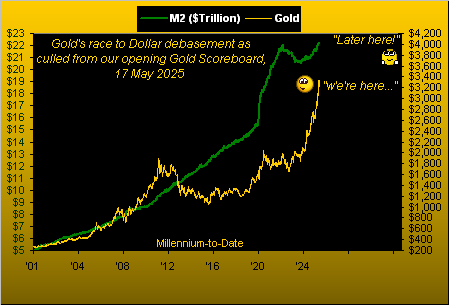
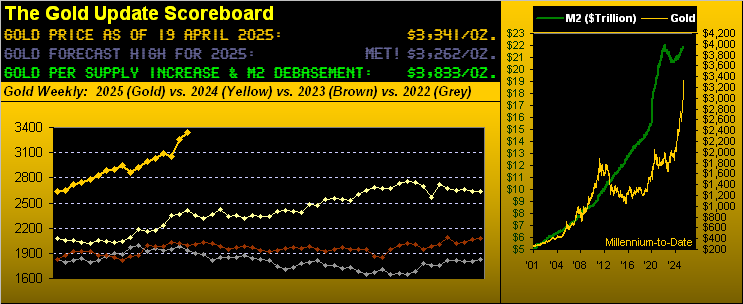
More importantly of course, by the opening Gold Scoreboard, the yellow metal’s supply-adjusted Dollar debasement value (3875) remains the broad-term goal. And therein note: the liquid StateSide money supply (“M2” basis) just set its own record high, now $22,149,197,787,444.50, (which for you WestPalmBeachers down there reads as “Twenty-two trillion one hundred forty-nine billion one hundred ninety-seven million seven hundred eighty-seven thousand four hundred forty-four dollars and fifty cents”).
Indeed, every Lincoln counts…
…and unfortunately, hardly is there enough liquidity to cover the S&P 500’s current market capitalization of $48.7T. Thus: at least halve the current “live” price/earnings ratio (42.3x) to avoid the “Look Ma! No Money!” crash.
“But then it already will have crashed, mmb…”
Squire’s brevity of brilliance oft qualifies as the last word. Yet there’s hope: for if the effect of “TT” (“Trump Tariffs”) positively plays out such that the U.S. makes its own stuff and earnings double, then also avoided is the “Look Ma! No Earnings!” crash. But we digress…
To progress back to Gold, its continuous futures contract volume these past five days (1,765,217) was the most since the COVID-crippling week ending 14 August 2020, (soon after price had eclipsed 2000 for the first time).
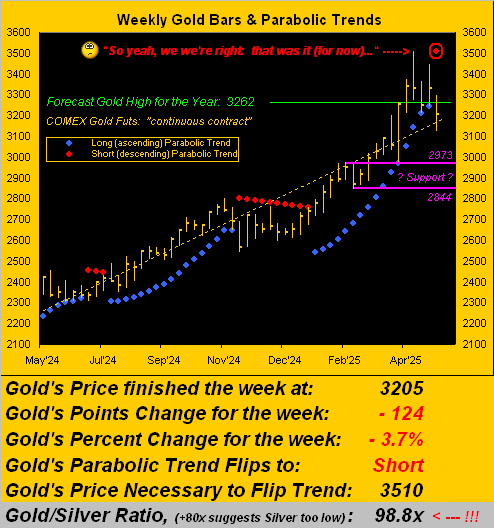
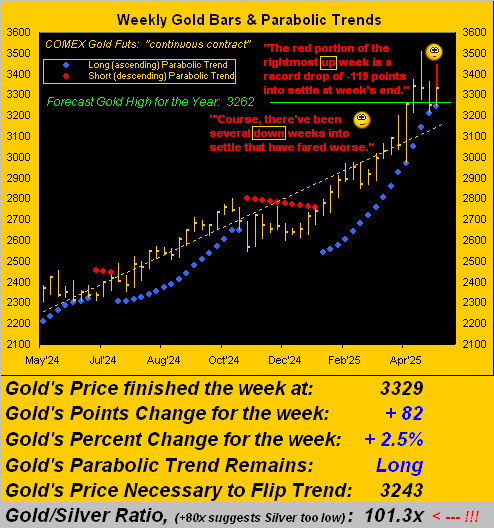
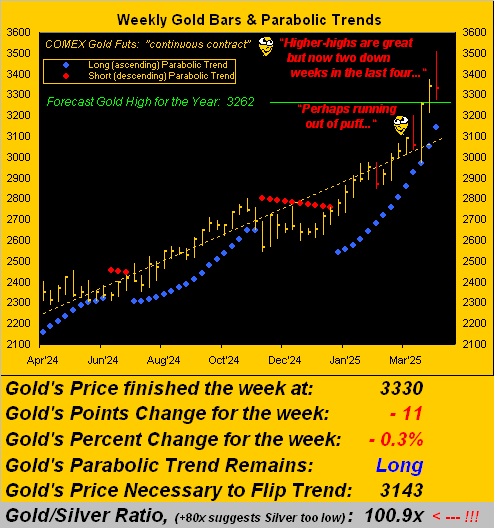
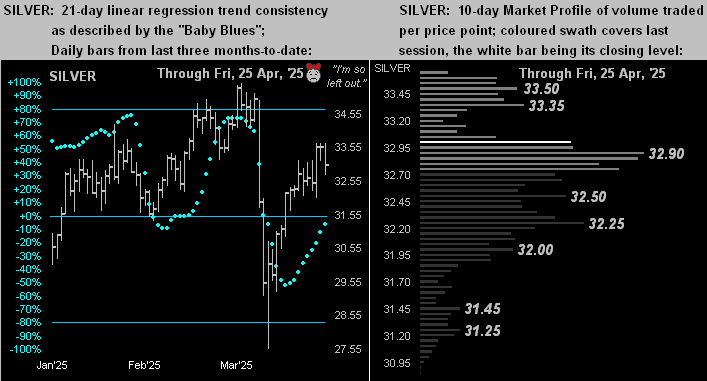
Now this year-to-date, 17 trading weeks already are in the books with just three of them having been down. But: in accordance with the aforeshown Market Value graphic of Gold being +302 points “high”, two of the past four weeks have been down. So is it finally being perceived that — near-term — Gold perhaps has gone “A Bridge Too Far” –[U.A. ’77]? Here are the weekly bars from a year ago-to-date, the three downers during 2025 in red:
With the like graphic for Silver, all she can say is “I’m so left out.” Even though she’s actually been in a rally mode these last three weeks, on a month-to-date closing basis Silver is net down -5.0% from 34.77 to 33.02, whereas Gold is net up +5.5% from 3157 to 3330. We’ve said it before and we’ll say it again: “Poor ol’ Sister Silver!” Of course, blame it on Cousin Copper whose having dragged Silver into mischievous deeds finds the red metal down -4.1% month-to-date. That’s our Sweet Sister Silver as — given Gold and Copper — she’s ![]() “Torn Between Two Lovers”
“Torn Between Two Lovers”![]() –[Mary MacGregor, ’76]:
–[Mary MacGregor, ’76]:
But then there’s next week: 18 metrics come due for the Baro, including that breath-holding, “Fed-favoured” inflation gauge of Personal Consumption Expenditures for March. The Bureau of Labor Statistics already found March to be deflationary! Will the Bureau of Economic Analysis find same via the PCE? Likewise, shall the first peek at Q1 Gross Domestic Product be negative? So anticipates Raphael “Reality” Bostic’s Federal Reserve Bank of Atlanta. Either way: prepare the popcorn!
Still, at the end of the day, ’tis all ok. Despite fears of recession, “TT”, and unsupportive earnings, we’re nonetheless told to expect “S&P 6200!” For as decreed Yul Brynner in the role of Pharaoh Rameses I of Egypt –[The Ten Commandments, Paramount, ’56]: “So let it be written; so let it be done!”
‘Course what really need be done is — meme as it may be — hold Gold whilst on a Silver shopping spree!

Cheers!
…m…
www.TheGoldUpdate.com
www.deMeadville.com
and now on “X”: @deMeadvillePro
25 April 2025 – 08:31 Central Euro Time
The elements of the EuroCurrencies and Metals Triumvirate all are at present below today’s Neutral Zones; above same is the Bond, and BEGOS Markets’ volatility is light-to-moderate. Our current leaders of Market Rhythms for pure swing consistency are on a 10-test basis: the Spoo’s 4hr Moneyflow and 12hr Parabolics, Gold’s 2hr Parabolics, the Swiss Franc’s 30mn Parabolics along with the 30mn Moneyflow, and the non-BEGOS Yen’s daily Price Oscillator; on a 24-test basis ’tis same for the Yen plus its daily Parabolics. Gold — which by Market Values remains severely near-term overbought — is returning down into the 3200s: more on that in tomorrow’s 806th consecutive Saturday edition of The Gold Update. Copper’s cac volume is rolling from May into that for July. The Econ Baro looks to April’s UofM Sentiment revision. And Q1 Earnings Season for the S&P 500 — which had a robust start — is fading as more companies report, 150 having thus far so done.
24 April 2025 – 08:28 Central Euro Time
Gold high-to-low this week has thus far dropped -239 points (-6.8%), albeit in real-time (now at 3328) ’tis still priced +307 points above its smooth valuation line (see Market Values). As for the BEGOS Markets at large, we’ve at present Gold along with the Euro and Swiss Franc above their respective Neutral Zones for today, whilst the balance of the bunch are within same; volatility is light in the context of the extremely expanded EDTRs (see Market Ranges): indeed that today for Gold is 90 points and for the Spoo 212 points. Amongst correlations for the five primary BEGOS components, the best currently is negative between the Euro and Spoo, (the hedge thus being both Long or both Short). Yesterday’s rally in the S&P 500 was sufficient to see the “live” P/E settle all the way back up at 40.0x; futs-adj’d in real-time ’tis 39.9x. Incoming metrics today for the Econ Baro include March’s Durable Orders and Existing Home Sales.
23 April 2025 – 08:34 Central Euro Time
Gold, after having made another All-Time High yesterday at 3510, has since dropped as much as -194 points in essentially 24 hours to 3316; current price is 3333, which is below today’s Neutral Zone as are both the Euro and Swiss Franc; above same are the Bond, Copper, Oil and Spoo; BEGOS Markets’ volatility is moderate. Going ’round the Market Values horn for the five primary BEGOS components in real-time we’ve: the Bond as nearly -3 points “low” vis-à-vis its smooth valuation line, the Euro +0.0549 points “high”, Gold +320 points “high”, Oil -2.59 points “low” and the Spoo -237 points “low”. By Market Rhythms, the Euro appears poised for a negative 12hr MACD crossover come 12:00 CET/10:00 GMT: follow-through of the prior eight swings has been at minimum 0.012 points (i.e. $1,500/cac). The Econ Baro looks to March’s New Home Sales. And late in the session comes the Fed’s Tan Tome.
22 April 2025 – 08:21 Central Euro Time
Another day, another century mark for Gold, price having eclipsed the 3500 level: by Market Values, the yellow metal in real-time is +501 points above its smooth BEGOS valuation line. Copper, too is above today’s Neutral Zone, whereas the balance of the BEGOS Markets are within same; volatility is mostly light, save for Gold having already traced 102% of its EDTR (see Market Ranges). Silver continues not to participate in Gold’s rally, the “live” Gold/Silver ratio now 106.8x. Yesterday’s -2.4% drop in the S&P 500 may be mollified by the MoneyFlow being more indicative of a -1.5% drop; the Spoo at present is -453 points below its smooth BEGOS valuation line. Nothing is due today for the Econ Baro. And Q1 Earnings Season thus for for the S&P shows 42 constituents having reported, of which 71% have bettered their like quarter of a year ago; the S&P’s “live” (futs-adj’d) P/E is 38.1x.
21 April 2025 – 08:46 Central Euro Time
EuroSide the long weekend continues, however StateSide ’tis back to business as usual with the BEGOS Markets on the move: at present above today’s Neutral Zones are the EuroCurrencies and Metals Triumvirate whilst below same are both the Bond and Spoo; session volatility is firmly moderate. Indeed Gold is soaring this morning, currently +61 points at 3402, even as The Gold Update continues to cite the near-term technically overbought state of the yellow metal; in real-time, price is now +408 points above its smooth valuation line; by Market Profiles, Gold’s “nearby” volume supports are 3344, 3326, and then nothing of substance until 3237. Silver is not participating to Gold’s upside extent, the Gold/Silver ratio now 103.7x. ‘Tis a fairly light week for the Econ Baro, beginning today with March’s Leading (i.e. “lagging”) Indicators.
The Gold Update: No. 805 – (19 April 2025) – “So if — as We’re Told — ‘Everybody’s’ Buying Gold…”
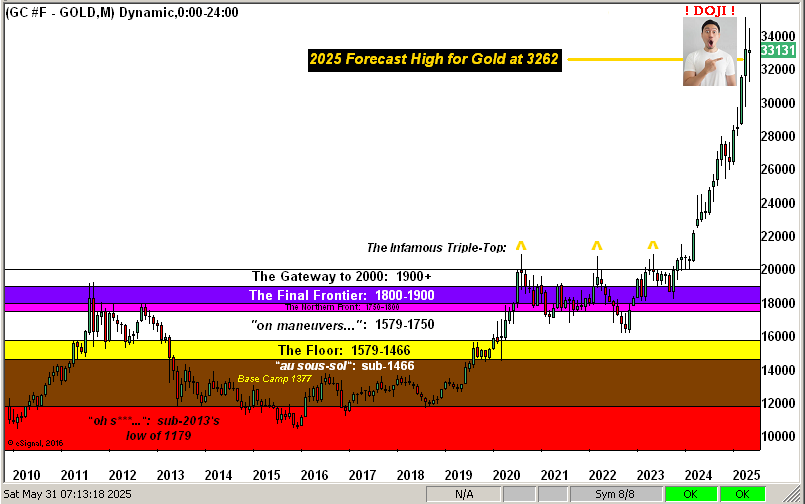
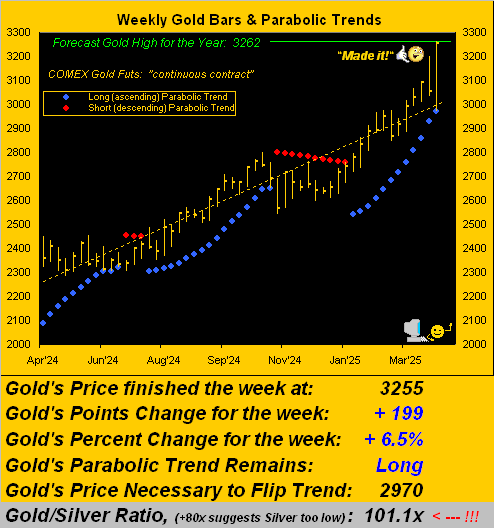
To close it out, as earlier noted, Gold on Thursday reached an All-Time High of 3372, (indeed already +110 points above our year’s forecasted high of 3262). Our being curious to see the FinMedia’s acknowledging of the fresh All-Time High, we went to three key website main pages: Bloomy – no mention; Dow Jones Newswires: – no mention; CNBS – no mention.
Thus: do pardon our forgetting that — at the end of the day — Gold remains an inert relic. Or as ’tis said, “Nothing to see here” in this year-to-date chart of Gold, given every ounce bought must also be sold, (the “receding” volume, behold, per our MoneyFlow all told):
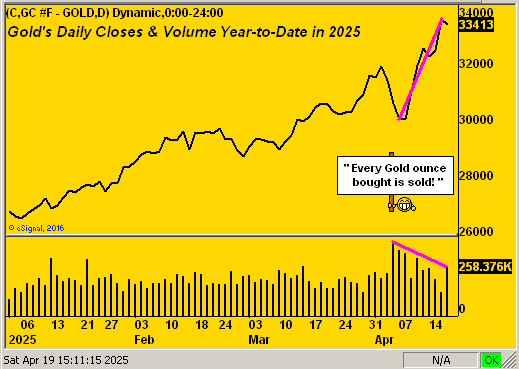
So, should Gold duly near-term flop, one ought fear not. Rather: be prepared to buy the drop!
Cheers!
…m…
www.TheGoldUpdate.com
www.deMeadville.com
and now on “X”: @deMeadvillePro
18 April 2025 – 08:49 Central Euro Time
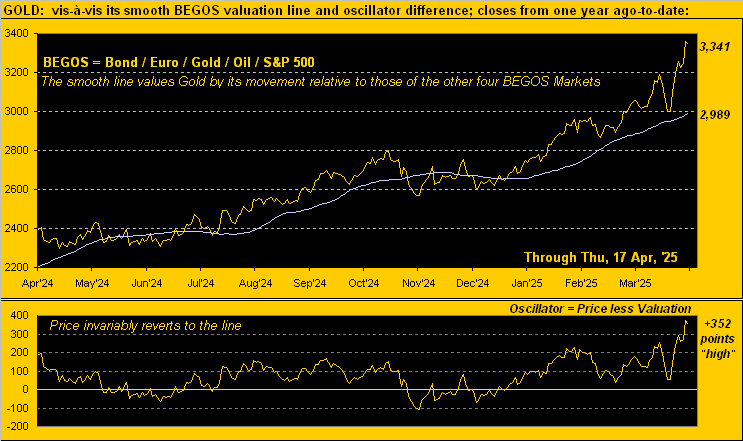
The BEGOS Markets and many global exchanges are closed as the long weekend begins. Just a few notes: the S&P 500 now at 5283 is now -14.1% below its all-time high of 6147, and is “textbook oversold” through the past 11 trading days; the P/E however remains perilously high at 39.2x, even as Q1 Earnings Season is running at an above-average pace for year-over-year improvement; still, the Spoo settled its week -371 points below its smooth valuation line (see Market Values). On the other hand, Gold — whist still fundamentally undervalued — is +352 points above its smooth valuation line and is “textbook overbought” these past five sessions. More tomorrow in our 805th consecutive Saturday edition of the Gold Update. StateSide bourses resume trading on Monday, however those for Europe not until Tuesday. Bonne Fête de Pâques à Tous!
17 April 2025 – 08:44 Central Euro Time
This week’s final trading day finds at present the Euro, Swiss Franc, Gold and Copper below the day’s Neutral Zones, whilst above same is the Spoo; BEGOS Markets’ volatility is light-to-moderate. Gold has recorded yet another All-Time High, thus far today reaching up to 3372: price in real-time is currently +356 points above its smooth valuation line (see Market Values). Looking at correlations amongst the five primary BEGOS components, our best at present is positive between Oil and the Spoo, (the hedge notion thus being Long one and Short the other one). The Euro by its Market Profile is on its second most heavily-traded apex of the past fortnight at 1.1400, (the most heavily-traded being 1.1080). And the Econ Baro rounds out its week with metrics including April’s Philly Fed Index and March’ Housing Starts/Permits.
16 April 2025 – 08:44 Central Euro Time
Gold is significantly higher this morning in having made another All-Time High at 3312: price is +1.8% whereas that for Silver is but +0.7%, Copper weighing there -1.2%. Only the Bond and Silver are at present within today’s Neutral Zones; above same are the Euro, Swiss Franc and Gold, whilst below same are Copper, Oil and the Spoo; session volatility for the BEGOS Markets is mostly moderate. By Market Rhythms, our two best on a 24-test basis currently are (per usual) the non-BEGOS Yen’s both daily Price Oscillator and Parabolics; on the 10-test basis, the present best are the Spoo’s 4hr Moneyflow and again the Yen’s daily Price Oscillator. For the Econ Baro today we’ve April’s NAHB Housing Index, plus March’s Retail Sales and IndProd/CapUtil, along with February’s Business Inventories.
15 April 2025 – 08:40 Central Euro Time
Gold is the sole BEGOS Market at present outside (above) its Neutral Zone; session volatility is very light to this time, although again, EDTRs (see Market Ranges) remain extremely wide: for example, that for the Spoo today is 245 points, (and yes, brokers have been broadcasting full initial margin requirements during recent sessions). Looking at Market Trends, the Euro, Swiss Franc, and Gold are in ascent, the other five BEGOS components in descent. The Spoo by Market Values is -295 points “low” vis-à-a its smooth valuation line; the S&P 500 itself is for eight consecutive sessions “textbook oversold”, albeit fundamentally the Index continues as vastly overvalued, the futs-adj’d “live” P/E 39.8x at this instant; its yield is 1.421% vs. 4.195% annualized on the 3mo U.S. T-Bill. The Econ Baro awaits April’s NY State Empire Index, plus March’s Ex/Im Prices.
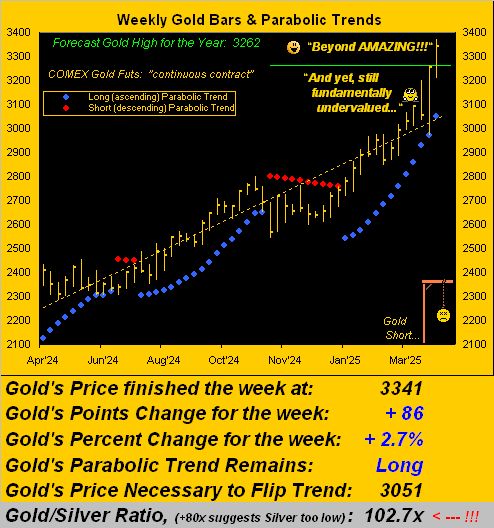
14 April 2025 – 08:51 Central Euro Time
Gold on Friday tapped our forecast high for this year of 3262 indeed reaching a point higher to the now new All-Time High of 3263, all as detailed in The Gold Update. The abbreviated trading week at present finds both the Euro and Spoo above their respective Neutral Zones for today; the other six BEGOS Markets are within same, and session volatility is light-to-moderate. Gold vis-à-vis its BEGOS Market Value shows (in real-time) as +277 points “high”; the yellow metal’s largest volume support price is 3160 (see Market Profiles). The Dollar Index since Friday has been trading below 100, that round number having previously proven as support during the second half of last September. Oil’s cac volume these next two days is moving from May into that for June. Nothing is due today for the Econ Baro, albeit 13 metrics are scheduled across the next three days. And Q1 Earnings Season picks up its pace a bit as the week unfolds.
The Gold Update: No. 804 – (12 April 2025) – “Gold Taps Our Year’s Forecast High of 3262”

Given 2025’s eventual total of 252 trading days, Gold reached our forecasted 3262 in just 70 sessions, which for those of you scoring at home means 72% of the year is still in the balance.
Thus the obvious question begged is: ![]() “Where Do We Go from Here?”
“Where Do We Go from Here?”![]() –[Chicago, ’70].
–[Chicago, ’70].
Despite Gold having already achieved our upside goal, our call for getting there has been completely upside down. En route to 3262, we’d anticipated Gold initially to pullback lower into the 2800s/2700s/2600s, even specifically to as low as 2507(!) Instead through these first 15 weeks of 2025, just two have been down. Such like stint hasn’t occurred since having penned the second edition of The Gold Update away back on 28 November 2009!
But to Pete Cetera’s above crooning question, remember our writing at New Year that “…applying the ‘expected yearly trading range’ method, the year’s low approximates … 2507. Then would follow the ascent to [the] forecast high of 3262…”
Our good man Squire then later questioned: “But mmb, what if the 2625 low is already in for this year?” to which we responded “…were that to turn out to be the case, then our forecast for a 3262 year’s high may be deemed in hindsight as modest.”
Similar was the case last year (for which we sought 2375, price then moving well beyond that to 2802). And now year-to-date, the low of 2625 (06 January) remains in place.
And thus as just penned this past 22 March: “…’IF‘ the low for this year is already in place … Gold has a shot at 3400 (or purely in the ‘expected yearly trading range’ equation, 3380), fundamentally supported by Federal Reserve interest rate cuts in concert with a slowing StateSide economy…” Yep, no kiddin’, keep readin’.
However, one only gets one shot at a forecast; re-forecasting is verboten! But given price’s present momentum, 3400 from here (+4.5%) seems a mere stone’s throw, barring it suddenly going all wrong for Gold.
That stated, the tug-of-war continues between Gold being technically near-term overbought vs. fundamentally broad-term undervalued. The latter case is made evident by the opening Gold Scoreboard, price today (3255) being -15% below its Dollar debasement valuation of 3830.
But by our BEGOS Markets’ value method, the following year-over-year graphic of Gold vis-à-vis its smooth valuation line (2962) shows price presently as +293 points — i.e. +10% — too “HIGH”:
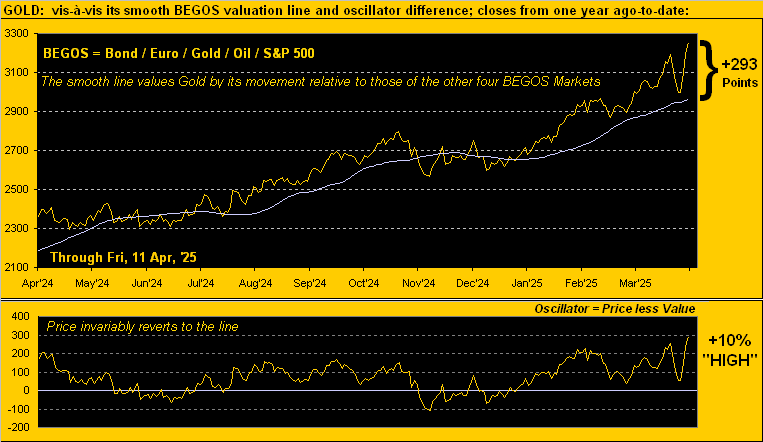
“So +293 points above value is pretty high, eh mmb? Congrats on the call, by the way…”
Thanks Squire. And indeed the current +293-point deviation is the second-highest century-to-date. ‘Twas only higher by +311 points upon the then All-Time Closing Gold High of 1900 back on 22 August 2011, from which in two months Gold fell -15% (snowballing to a -44% fall per the end of 2015). But more “recently” by percentage deviation, the last time ’twas by this much (+10%) was on 08 March 2022, after which price fell from 2058 to 1695 (-4.5%) come that year’s Bastille Day (14 July).
To be sure, if one labels “TT!” (“Trump Tariffs!”) as geopolitically Gold-boosting bedlam, price’s admirable rally is justifiable. The Dollar Index just took quite a hit in sporting a weekly settle below 100 for the first time since that ending (believe it or not again) on Bastille Day 2023. A Swiss Franc that day cost $1.1680 … today ’tis $1.2368. Got Gold? Got Swiss?? Here’s the solid “Safe-Haven Two-Fer” that one cannot miss: Miss Helvetia!
Such mirthful jubilation aside, you strident Gold aficionados well-understand what follows geopolitically-induced price spikes: reversion to the mean. Yes, we fully comprend that “It’s different this time” … ’tis always different this time … until ’tisn’t. We thus remain sensitively wary for Gold’s price to be suddenly jerked into reverse. Indeed such down stints have been lurking of late: on each of 03, 04 and 07 April, Gold recorded intra-day declines of more than -100 points; they’ve just been lost in the sensationalized shuffle.
Shuffling down net-net since mid-February is the Economic Barometer. Perhaps worse: are we DEflating? After all, the Bureau of Labor Statistics recording deflationary readings in three of its four key Price Indices for March: the headline paces at both the Consumer and Producer levels were negative as was the latter’s core pace. ‘Course the “Fed-favoured” paces of Personal Consumption Expenditures shan’t be released by the Bureau of Economic Analysis until 30 April. But should negativity also therein lie, the Federal Open Market Committee surely shall cut their Bank’s Funds Rate per the 07 May Policy Statement. Too, of the Baro’s nine incoming metrics this past week, just two were “positive”: March’s Treasury Budget was less negative, and Wholesale Inventories for February were worked down. So in going to the year-over-year picture, just as the stock market can be a hedge against inflation, so too can it be a broken dam to deflation as such ebbing tide lowers all boats:
Toward the wrap, here’s the stack:
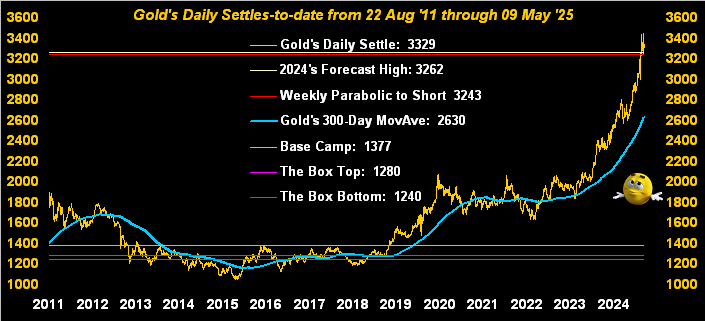
The Gold Stack
Gold’s Value per Dollar Debasement, (from our opening “Scoreboard”): 3830
Gold’s All-Time Intra-Day High: 3263 (11 April 2025)
2025’s High: 3263 (11 April 2025)
10-Session directional range: up to 3263 (from 2973) = +290 points or +9.8%
Gold’s All-Time Closing High: 3255 (11 April 2025)
Trading Resistance: none by the Profile
Gold Currently: 3255, (expected daily trading range [“EDTR”]: 75 points)
Trading Support: nearby 3247 and 3235, then 3160
10-Session “volume-weighted” average price magnet: 3116
The Weekly Parabolic Price to flip Short: 2970
2025’s Low: 2625 (06 January)
The 300-Day Moving Average: 2549 and rising
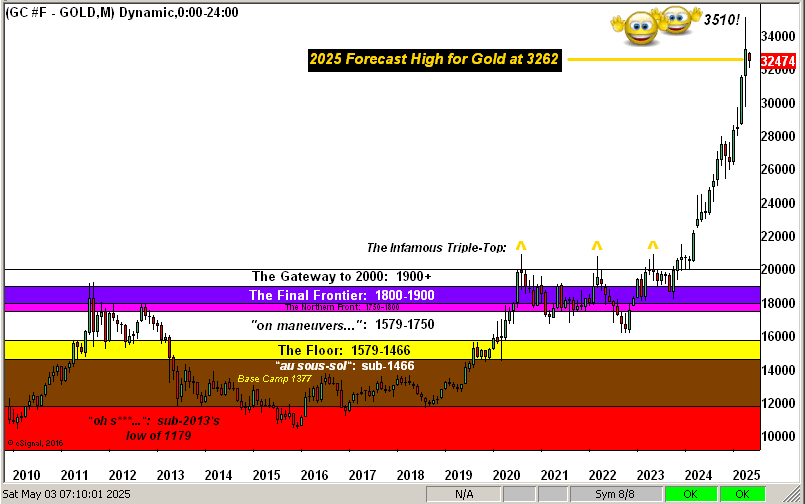
The 2000’s Triple-Top: 2089 (07 Aug ’20); 2079 (08 Mar’22); 2085 (04 May ’23)
The Gateway to 2000: 1900+
The Final Frontier: 1800-1900
The Northern Front: 1800-1750
On Maneuvers: 1750-1579
The Floor: 1579-1466
Le Sous-sol: Sub-1466
The Support Shelf: 1454-1434
Base Camp: 1377
The 1360s Double-Top: 1369 in Apr ’18 preceded by 1362 in Sep ’17
Neverland: The Whiny 1290s
The Box: 1280-1240
So does Gold’s stellar run stop here, essentially at our 3262 forecast high for this year? Until we actually experience the coming effect of “TT!”, its babble and prattle shall the markets still rattle. But like everything else, be it geopolitically, monetarily, financially or whateverly, “TT!” eventually will fall from the FinMedia headlines and, in turn, Gold experience descent to some extent. Either way, what a gut-grippin’ Gold ride we’ve spent!

11 April 2025 – 08:43 Central Euro Time
Gold has come quite near to our 3262 forecast high for this year, trading this morning up to 3242 before pulling back; our “high if an up day” for Gold today is 3257, thus 3262 is plausible were there an ensuing price push. Gold is, as is the Euro, at present above its Neutral Zone for today; the balance of the other six BEGOS Markets are within same, and volatility is firmly moderate, the Euro notably having already traced 138% of its EDTR (see Market Ranges). By Market Values, extreme deviations remain for the five primary BEGOS components: in real-time the Bond shows as -3^19 points below its smooth valuation line, the Euro as +0.055 points above same, Gold as +260 points above same, Oil as -7.52 below same and the Spoo as -422 points below same. The Swiss Franc (1.2233) is essentially at a 14-year high. ‘Tis March wholesale inflation day for the Econ Baro via the PPI, plus the initial April Sentiment read from UofM.
10 April 2025 – 08:51 Central Euro Time
Yesterday sported the fourth largest percentage low-to-high run since at least 1980 for the S&P 500: +10.8%. More on “Wacky Wednesday” in next Saturday’s 804th edition of The Gold Update. At present, only Gold is above today’s Neutral Zone whilst below same are both Copper and Oil; BEGOS Markets’ volatility is moderate, again within the context that EDTRs (see Market Ranges) have been blown out. We’ve gone on quite a bit in recent weeks about the Spoo being too low vis-à-vis its smooth valuation line (see Market Values), Tuesday’s differential being -839 points: a substantive portion of that was reduced yesterday such that now in real-time ’tis -340 points. Looking at correlations amongst the five primary BEGOS components, the best currently is negative between the Euro and the Spoo, (the hedge notion thus to be simultaneously Long or Short both of them). Metrics for the Econ Baro today include retail inflation for March via the CPI, and late in the session the month’s Treasury Budget.
09 April 2025 – 08:50 Central Euro Time
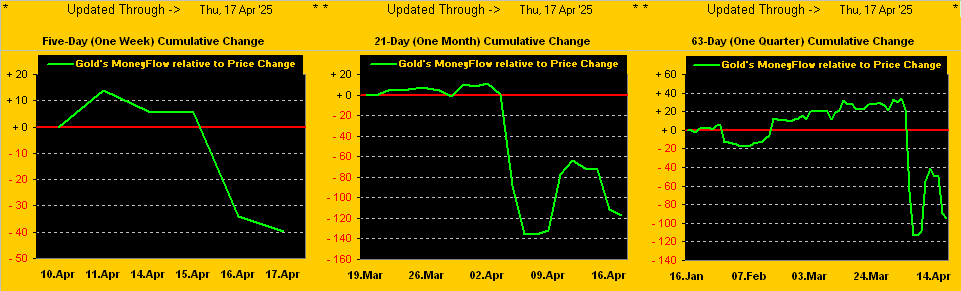
At present, only Oil is within today’s Neutral Zone; above same are the EuroCurrencies and Metals Triumvirate, whilst below same are the Bond and Spoo; BEGOS Markets’ volatility is moderate-to-robust. By Market Rhythms our best are currently (10-test basis) the non-BEGOS Yen’s daily Price Oscillator and Gold’s 2hr parabolics; again (on a 24-test basis) we’ve the Yen’s daily Price Oscillator and the Bond’s daily Moneyflow. At Market Trends, save for the EuroCurrencies, the “Baby Blues” of trend consistency are falling for the six other BEGOS components. Our internally-measured MoneyFlow for the S&P 500 is inconsistent across its three key timeframes: the one-week measure suggests the Index ought be +50 points higher than ’tis; the one-month measure +136 points higher; but the one-quarter measure -919 points lower: the take-away is near-term higher, then broad-term lower, which too is the near-term technical stances per by the Spoo’s Market Values, but broad-term the fundamental reality of the very high P/E (“live” now 35.0x futs-adj’d). The Econ Baro awaits February’s Wholesale Inventories. Then late in the session come the FOMC Minutes from the 18-19 March meeting.
08 April 2025 – 08:52 Central Euro Time
The BEGOS Markets at present find the Euro, Swiss Franc, Gold, Oil and the Spoo above their respective Neutral Zones for today; none of the other three components are below same, and volatility is moderate, albeit in the context that EDTRs (see Market Ranges) have substantively widened in recent sessions: for example, a year ago today the Spoo’s EDTR was 51 points (price then 5257) whereas for today (price currently 5174) ’tis 165 points. Gold’s “Baby Blues” (see Market Trends) of trend consistency yesterday broke below the key +80% axis, making us anticipative of still lower price levels: by Market Values in real-time, Gold still is +79 points above its smooth valuation line; the Spoo however is -681 points below same, even as the S&P 500 itself fundamentally remains quite overvalued give its “live” (futs-adj’d) P/E at 37.1x. Nothing is due today for the Econ Baro, however as previously noted, Q1 Earnings Season has commenced, which you can follow day-by-day on that page.
07 April 2025 – 08:45 Central Euro Time
Selling of equities looks to continue: adjusting the Spoo at present to Fair Value, the S&P 500 (were the StateSide market to open at this instant) would trade sub-5000 for the first time since 25 April a year ago. ‘Tis worth noting with the Spoo -4.4%, the -7% “lock limit” would apply at 4740. At present along with the Spoo below their respective Neutral Zones are both Gold and Oil; above same are the Bond, Euro, Swiss Franc and Silver; volatility for the BEGOS Markets is again firmly moderate and then some: both Silver and Copper (the latter at present back inside today’s Neutral Zone) have traced in excess of 200% of their EDTRs (see Market Ranges). The Gold Update cites the yellow metal still as being technically overbought near-term but fundamentally undervalued broad-term, whilst ’tis the opposite cases for the S&P 500, (technically oversold, fundamentally overvalued). The Econ Baro looks late in the session to February’s Consumer Credit. And Q1 Earnings Season gets underway.