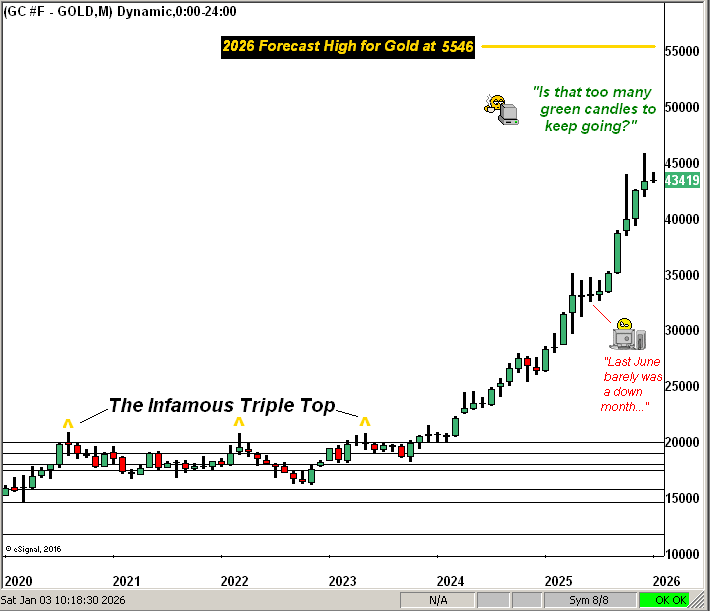
Gold’s cac volume is rolling from February into that for April with an additional +39 points of premium, and — with or without — a fresh All-Time High has been reached thus far today at 5318 (April) or 5279 (February). Presently for the BEGOS Markets we’ve the Bond, Gold, Silver and the Spoo above their respective Neutral Zones for today, whilst below same are the two EuroCurrencies; session volatility is moderate-to-robust, Gold having traced 115% of its EDTR. Gold by Market Values is +803 points above its smooth valuation line; and dominant Market Profile support for the yellow metal (basis April) is 5121. Of note the current 5312 price is -234 points (-4.2%) below our forecast high for this year of 5546. The Spoo is positioned such that the S&P 500 (were it to open at this instant) would trade above 7000 for the first time. And much ado shall be FinMedia-made about “The Dow” approaching the 50,000 milestone. Nothing is due today for the Econ Baro. And we look for no change in the FedFunds rate come the FOMC’s Policy Statement at 19:00 GMT.
 Mark
Mark
27 January 2026 – 08:46 Central Euro Time
Silver’s late-in-the-session drop yesterday of -12% prompted us to query on “X” (@deMeadvillePro) as to if the high was in place. However this morning, Silver is back above its Neutral Zone for today as are Gold, Copper and the Spoo; Oil is below same, and BEGOS Markets’ volatility is moderate, save for Silver which already has traced 141% of its EDT (see Market Ranges). Silver’s high yesterday was 117.70 whereas present price is 112.44 (+8.3% on the session). For the S&P 500, earnings improvements have driven the P/E down to 47.3x — still a dangerously high ratio — but at least well off it having been above 64x in the prior week. Thus far in Q4 Earnings Season, 52 constituents have reported of which 38 (73%) have bettered their bottom lines from Q4 a year ago, which is an above average pace. For the Econ Baro today we’ve the January read of Consumer Confidence.
26 January 2026 – 08:41 Central Euro Time
Gold, having settled Friday at 4983, gapped higher to begin the week in opening at 5013 and since has traded to as high as 5108; Silver has reached 109.32. The Gold Update underscores the overvaluation fundamentally and technically for the precious metals, whilst nonetheless maintaining our Gold target for this year of 5546. Presently, the Bond, Euro, Swiss Franc, Gold and Silver all are above today’s Neutral Zones; within same are Copper, Oil and the Spoo; session volatility for the BEGOS Markets is moderate-to-robust. Going ’round the Market Values horn for the five primary BEGOS components in real-time: the Bond is -1^17 points below its smooth valuation line, the Euro -0.005 points below same, Gold +653 points above, Oil +2.83 points above, and the Spoo -71 points below valuation. In “shutdown” arrears for the Econ Baro we’ve November’s Durable Orders.
The Gold Update: No. 845 – (24 January 2026) – “Silver Taps 100 Whilst Gold Scrabbles for 5000”

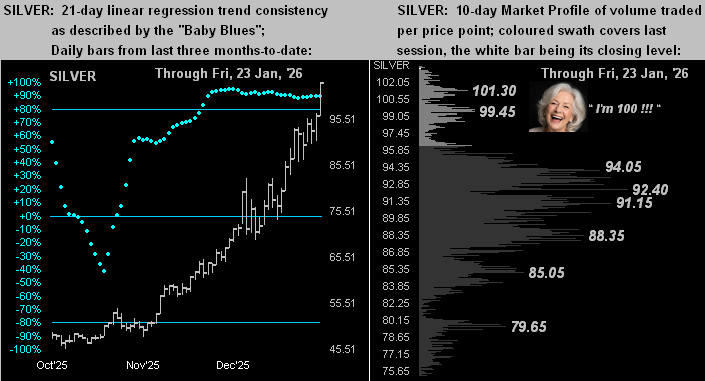
Silver yesterday (Friday) at 15:10 GMT saw the current front month contract (March) achieve 100.00 for the very first time, en route to trading as high as 103.53 before settling the week at 103.26. Hearty congratulations to Sweet Sister Silver!
Gold however was unable to keep pace in the day’s milestone race, reaching “only” up to another All-Time High at 4991, rather than (as yet) eclipsing 5000 in closing at 4983.
Thus, on marches the metals’ mania mayhem with Gold year-to-date up now a net +15% and Silver +46%. (For you stock jocks, the S&P 500 thus far is +1%; have a great day).
Wonderful as ’tis in maintaining our 5546 forecast Gold high for 2026, we’ve this prudent cash management reminder from the “Metals Meltdown Dept.” … just in case you’re scoring at home:
- Back at Gold’s 06 September 2011 record high of 1923, price by December four years hence had “corrected” -46%;
- Back at Silver’s 25 April 2011 record high of 49.80, price by December four years hence had “corrected” -73%.
“But mmb, you’ve already said that’s not gonna happen again, right?”
No one “knows” with certainty Squire, however we very much doubt it. To be sure, we’re in the third massive metals “spike” since 1980, (recall then by 1982 Gold having succumbed -66% and Silver -88%). Means reversion does happen.
The big difference between (yes we have to reprise it) ![]() “Now and Then”
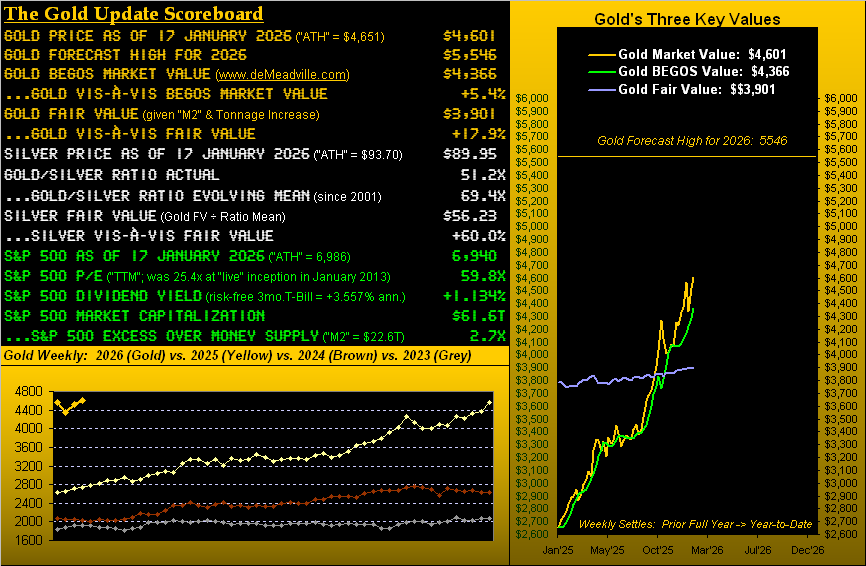
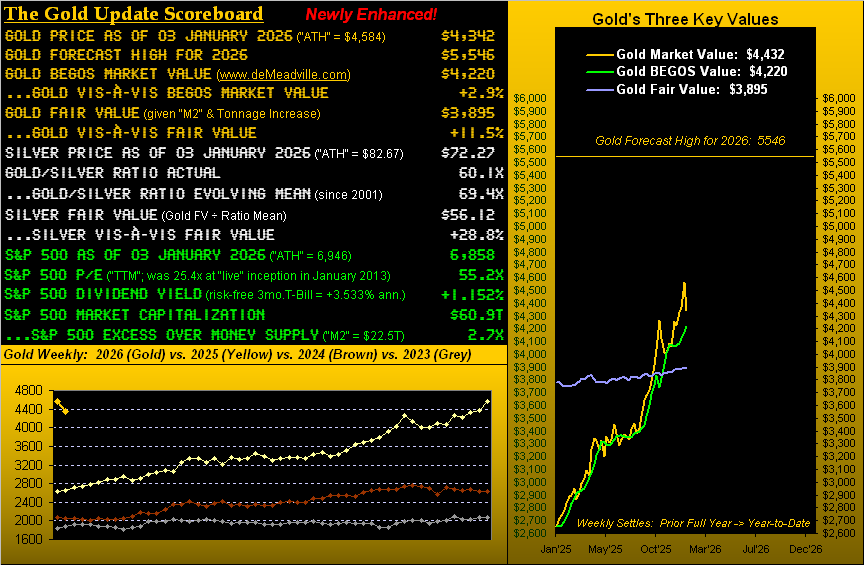
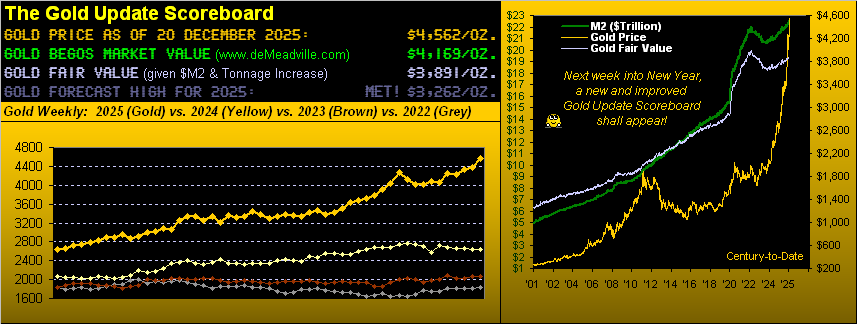
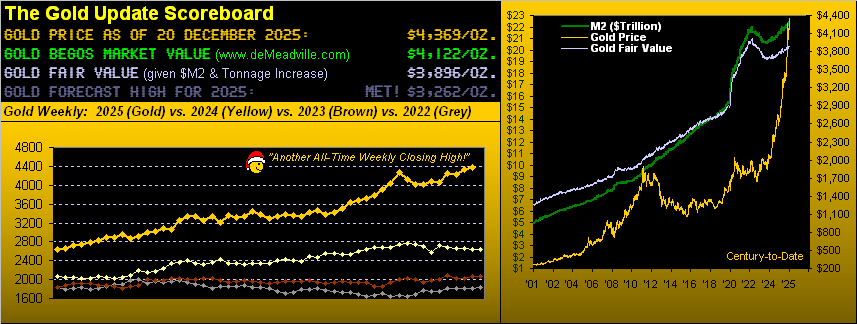
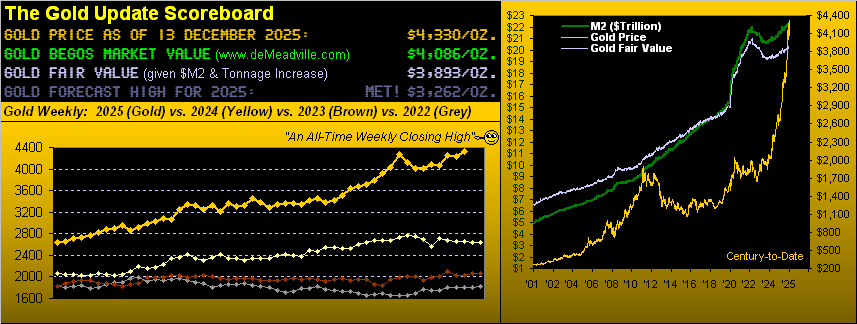
“Now and Then”![]() –[BeaTles, ’23] is back then the precious metals couldn’t get a seat in the theatre, let alone a back stage pass; now Gold and Silver are on centerstage aglow in all the lights. Too, as we described in last year’s final missive: the perception of Gold has morphed from a yield-less, irrelevant relic to meme-like stock proportions, and seriously is becoming more widely recognized as a foundational mitigant to debt-driven Dollar debasement and geopolitical jitters, overvaluation be damned. To wit per the above opening Gold Scoreboard:
–[BeaTles, ’23] is back then the precious metals couldn’t get a seat in the theatre, let alone a back stage pass; now Gold and Silver are on centerstage aglow in all the lights. Too, as we described in last year’s final missive: the perception of Gold has morphed from a yield-less, irrelevant relic to meme-like stock proportions, and seriously is becoming more widely recognized as a foundational mitigant to debt-driven Dollar debasement and geopolitical jitters, overvaluation be damned. To wit per the above opening Gold Scoreboard:
Gold at present is +12.7% above its BEGOS Market Value (4421 by price’s movement relative to those of the five primary BEGOS Markets being the Bond, Euro, Gold, Oil and S&P 500) and further ’tis +27.6% above Fair Value (3905 by price’s 45-year regression to the debasing Dollar via “M2”, countered by the increase in the supply of Gold).
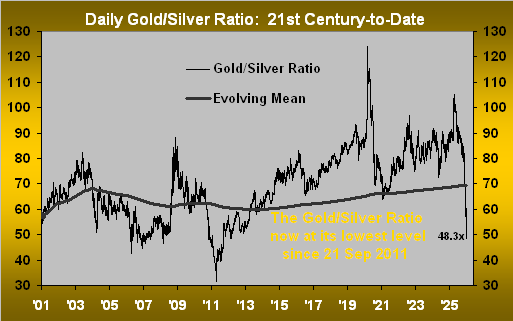
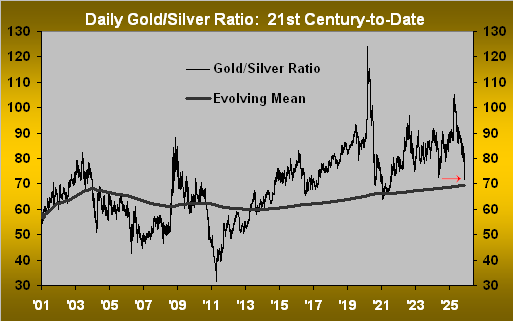
As for Silver, she is +83.4% above her Fair Value (56.30 given that for Gold divided by the evolving mean of the Gold/Silver ratio). And such ratio now at 48.3x is a 14-year low as shown below by the day across the past 25 years:

Note therein the reference to the “live” price/earnings ratio of the S&P 500 now at 59.1x. If you’ve forgotten the math, we’ve not forgotten it for you:
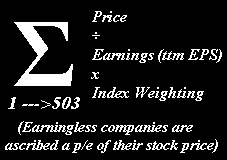
And yes, that p/e of 59.1x remains stratospherically excessive even as Q4 Earnings Season thus far has been very positive for the S&P: of the 46 constituents having reported, 74% have bettered their bottom lines from Q4 a year ago. But the overall high level of price — and thus practically no yield — inevitably is problematic given the yield in Treasuries remains more than triple that of S&P, and without risk of capital loss, (’tis assumed anyway…gulp…) But we get it: “Debt ain’t sexy.” So, cue Fleetwood Mac from ’76: ![]() “You can go your own way…”
“You can go your own way…”![]()
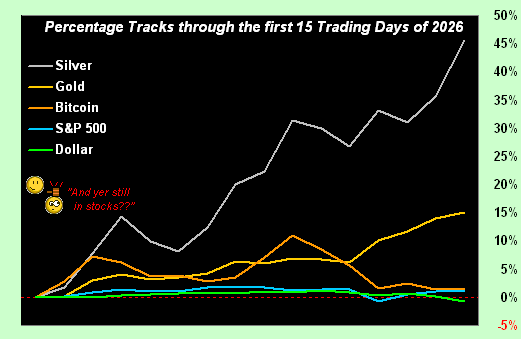
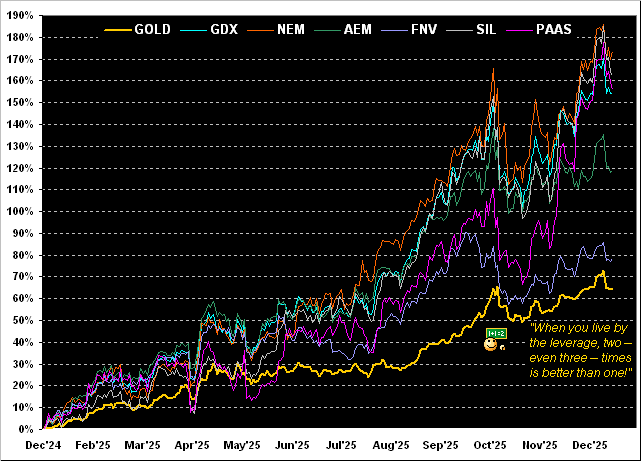
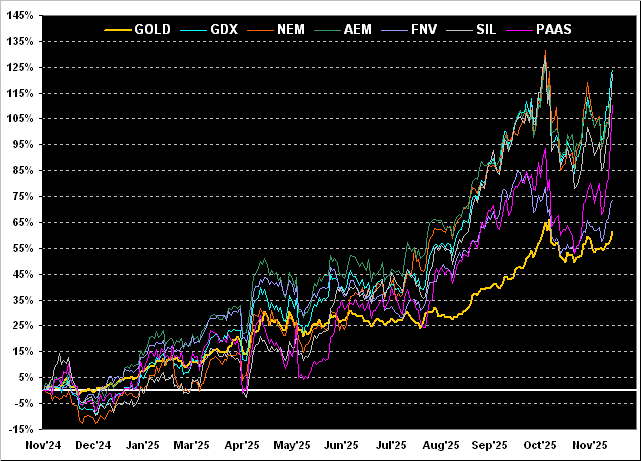
Into the new week, ’tis time for Gold 5000, (again barring “The Sell”). Gold has begun 2026 with a bang, indeed its best opening 15 trading days by percentage gain of any year so far this century, (which for you WestPalmBeachers down there is since 01 January 2001). And certainly the same (understatement) can be said for Silver, her having thus far gone nuclear! Regardless of what can be deemed as too far too quickly — especially with respect to overvaluation — we close with this graphic of the early year-to-date percentage tracks for each of Silver (+46%), Gold (+15%), Bitcoin (+1%), S&P 500 (+1%) and the Dollar Index (-1%):
‘Course with “only” 236 trading days remaining in 2026, what possibly could go wrong? For Gold and Silver the trend is Long!
Cheers!
…m…
www.TheGoldUpdate.com
www.deMeadville.com
and now on “X”: @deMeadvillePro
23 January 2026 – 08:45 Central Euro Time
Presently we’ve the Euro and Swiss Franc below their respective Neutral Zones for today, whilst above same are Gold, Silver and the Spoo; BEGOS Market’s volatility is again light-to-moderate. Milestones on tap: Gold 5000 (record high this morning 4970) and Silver 100 (record high this morning 99.40). The S&P 500’s “live” P/E (futs-adj’d) is 64.4x. Tomorrow’s 845th consecutive edition of The Gold Update (milestones made or not) shall nonetheless continue to celebrate the amazing run of the precious metals, albeit we’ll again caution valuation as having become quite upside extreme, (although certainly not as much as is the S&P). Too, we’ll make mention of December inflation as some metrics (CPI) in “shutdown” arrears have finally been reported. The Econ Baro concludes the week with the revised look at the UofM Sentiment Survey. And with some 10% of S&P constituents having thus far reported earnings for Q4, some 76% of those have bettered their bottom line of Q4 a year ago; but by the aforementioned P/E, the overall level of earnings remains tellingly weak relative to the price of the Index.
22 January 2026 – 08:34 Central Euro Time
Silver is the sole BEGOS Market at present outside (above) its Neutral Zone for today; session volatility has slowed a bit from recent days, thus far looking light-to-moderate. Looking at Market Rhythms for pure swing consistency, our Top Three through yesterday are — on a 10-test basis — Gold’s 12hr Parabolics, the Swiss Franc’s 4hr Price Oscillator, and Silver’s 4hr Parabolics; on a 24-test basis ’tis the Swiss Franc across the board by the 2hr Price Oscillator, 4hr Moneyflow and 4hr MACD. The P/E of the S&P 500 settled last evening at a whopping 63.7x; the yield is 1.156%; (the 3mo T-Bill annualized is 3.588%). The Econ Baro looks in “shutdown” arrears to Personal Income/Spending along with the attendant “Fed-favoured” PCE data; too, in arrears, shall be what is being termed a “revision” to Q3 GDP and its Chain Deflator.
21 January 2026 – 08:43 Central Euro Time
Gold records yet another All-Time High this morning at 4891 and is above its Neutral Zone for today as are both the Bond and Spoo; the Swiss Franc is below same, and session volatility for the BEGOS Markets is mostly moderate, Gold being the exception with a 142% tracing of its EDTR (see Market Ranges). Yesterday, both Gold and Silver, along with the Euro and Swiss Franc, moved and settled above their most volume-dominant Market Profile levels. Gold in real-time at 4845 is +446 points “high” above its smooth valuation like (see Market Values), of note, Silver at present is just mildly lower today at 94.45, whereas Gold is +1.7%. Scheduled for the Econ Baro are December’s Housing Starts/Permits, plus purportedly in “shutdown” arrears Construction Spending for both September and October.
20 January 2026 – 08:40 Central Euro Time
The BEGOS Markets’ two-day session continues with further record highs for both Gold (4727) and for Silver (94.75); both at present are above their Neutral Zones for this session, as too are Copper, the Euro and Swiss Franc; below same are the Bond and Spoo, and volatility (it being a double-day) is mostly robust, although Silver (despite its new high), Copper and Oil have traced no more than 70% of their EDTRs (see Market Ranges). Looking at Market Values (in real-time) for the five primary BEGOS components: the Bond is -2^15 points “low” vis-à-vis its smooth valuation line, the Euro -0.016 points “low”, Gold +342 points “high”, Oil +1.14 points “high” and the Spoo -76 points “low” having in this session crossed beneath its valuation line that portends still lower prices near-term. The Dollar Index — which had a firm start to the year — has given back more than that which was gained. Again, there is no Econ Data due until tomorrow. And mind our Earnings Season page as Q4 reporting picks up its pace this week.
19 January 2026 – 08:46 Central Euro Time
Given the StateSide holiday, ’tis a two-day session (for Tuesday settlement) for the BEGOS Markets. Therein at present we’ve both the Bond and Spoo below the session’s Neutral Zones, whilst above same are the Euro, Swiss Franc, Gold and Silver; volatility is moderate-to-robust, the two EuroCurrencies both having already exceeded 100% of today’s EDTR tracings (see Market Ranges). The Gold Update in maintaining our 5546 price forecast for this year nonetheless continues to cite the current overvaluation of Gold and Silver in this “Metals’ Mania Mayhem!”, noting that intra-week selling increased over that prior, even as prices further rose, and indeed are into higher record territory today (Gold thus far to 4698 and Silver to 94.37). The S&P 500 remains beyond any imaginable level of overvaluation, the futs-adj’d “live” P/E at this moment 59.2x. The reporting pace of Q4 earnings increases as the week unfolds. And nothing is scheduled for the Econ Baro until Wednesday.
The Gold Update: No. 844 – (17 January 2026) – “Metals’ Mania Mayhem!”

With all that in your metals’ pack, here’s the stack:
The Gold Stack (continuous contract pricing):
Gold’s All-Time Intra-Day High: 4651 (14 January 2026)
2026’s High: 4651 (14 January 2026)
10-Session directional range: up to 4651 (from 4356) = +295 points or +6.8%
Gold’s All-Time Closing High: 4634 (14 January 2026)
Trading Resistance: 4603 / 4621 / 4643
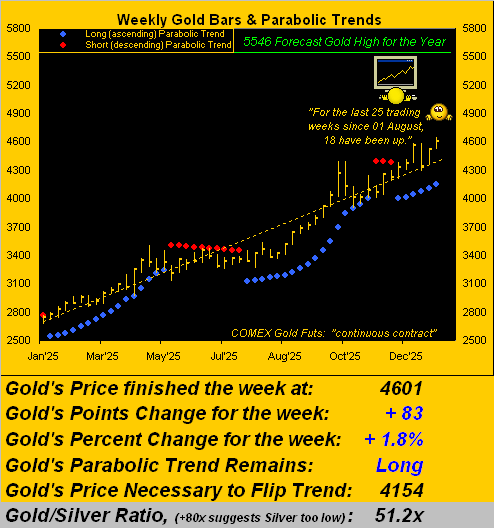
Gold Currently: 4601, (expected daily trading range [“EDTR”]: 86 points)
10-Session “volume-weighted” average price magnet: 4548
Trading Support: 4496 / 4471 / 4459
2026’s Low: 4319 (02 January)
The Weekly Parabolic Price to flip Short: 4154
Gold’s Fair Value per Dollar Debasement, (from our opening “Scoreboard”): 3901
The 300-Day Moving Average: 3401 and rising
The 2000’s Triple-Top: 2089 (07 Aug ’20); 2079 (08 Mar’22); 2085 (04 May ’23)
The Gateway to 2000: 1900+
The Final Frontier: 1800-1900
The Northern Front: 1800-1750
On Maneuvers: 1750-1579
The Floor: 1579-1466
Le Sous-sol: Sub-1466
The Support Shelf: 1454-1434
Base Camp: 1377
The 1360s Double-Top: 1369 in Apr ’18 preceded by 1362 in Sep ’17
Neverland: The Whiny 1290s
The Box: 1280-1240
To wrap, in the midst of this metals’ mania mayhem, we ought not be put off by some degree of price retrenchment, especially with 5546 for our forecast high as the year goes by.
“And here’s a surprise, mmb! Copper’s sister Coppélia just sent us this!”

Now Squire, do behave out there. And indeed, folks, stay with your Gold and Silver!
Cheers!
…m…
www.TheGoldUpdate.com
www.deMeadville.com
and now on “X”: @deMeadvillePro
16 January 2026 – 08:45 Central Euro Time
Both Silver and Copper are below their respective Neutral Zones for today, whilst above same is the Spoo, (“live” fut’s-adj’d S&P 500 P/E now 60.7x); BEGOS Markets’ session volatility ranges from light (Bond and Euro EDTR tracings of 26%) to robust (Copper’s 102%); EDTRs are updated daily on the Market Range page. Gold has dipped below its most volume-dominant Market Profiles support of 4621, price currently 4612; however the precious metals remain extremely high vis-à-via their Fair Value as we’ll depict in tomorrow’s 844th consecutive Saturday edition of The Gold Update; obviously too, given lack of earnings support, the S&P remains overvalued by a massive margin; the riskless 3mo T-Bill yield (3.565%) is 3.1x that of the S&P’s dividend yield (1.131%). The Econ Baro wraps its busy week of 20 incoming metrics with January’s NAHB Housing Index and December’s IndProd/CapUtil.
15 January 2026 – 08:43 Central Euro Time
The “live” P/E of the S&P 500 settled yesterday at 60.2x. Meanwhile, we’ve presently the EuroCurrencies, Metals Triumvirate and Oil all below today’s Neutral Zones; within same are the Bond and Spoo, and session volatility for the BEGOS Markets is moderate-to-robust, with both Silver and Copper already having traced in excess of 100% of their respective EDTRs for today (see Market Ranges). All-time high metals’ readings recorded yesterday were: Gold 4651, Silver 93.56, and Copper 6.154. Through the first nine trading days of 2026, the Dollar Index has recorded a net daily gain six times. Our S&P leading MoneyFlow continues to thin with a bit of a negative bent, (see S&P 500: MoneyFlow). And the Econ Baro awaits January’s Philly Fed and NY State Empire Indices, plus in “shutdown arrears”, November’s Ex/Im Prices.
14 January 2026 – 08:38 Central Euro Time
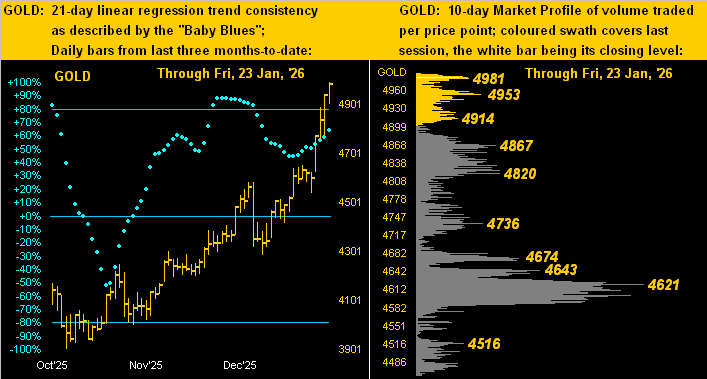
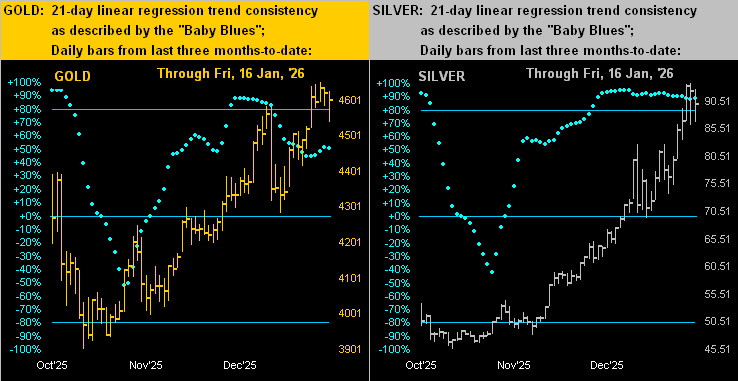
Record highs continue for Gold, Silver (91.37!), Copper and the Spoo/S&P 500. Per last evening’s post on “X” (@deMeadvillePro) the S&P settled yesterday with a “live” P/E of 59.9x. This morning, all three elements of the Metals Triumvirate are at present above today’s Neutral Zones; the rest of the BEGOS Markets are within same, and session volatility is pushing toward moderate. Gold (4643) is in real-time +312 points above its smooth valuation line (see Market Values); Market Profile support is 4621, followed by 4603; (the most volume-dominant support is still 4459); and by its Market Trend, Gold’s “Baby Blues” of linreg trend consistency have ceased their recent fall. The Econ Baro looks to in “shutdown” arrears November’s Retail Sales, PPI, and purportedly October’s Business Inventories, plus Q3’s Current Account. And late in the session comes the Fed’s “Tan Tome”.
13 January 2026 – 08:46 Central Euro Time
On the heels of record highs yesterday for Gold, Silver and the S&P 500, we’ve at present both the Bond and Gold below today’s Neutral Zones; the balance of the BEGOS Markets are within same, and session volatility is light-to-moderate, except for the non-BEGOS Yen which has traced 118% of its EDTR (see Market Ranges for those of the BEGOS Markets). By Market Trends, all are linreg positive, save for the two EuroCurrencies. Looking at Market Profiles, volume-dominant supports are as follows: Bond 115^16, Gold 4459, Silver 75.90, Copper 5.8650, Oil 58.00, and the Spoo 6953; volume-dominant resistance for the Euro is 1.172 and for the Swiss Franc 1.271. Oil’s cac volume is rolling from February into that for March. And for the Econ Baro we’ve December’s CPI and Treasury Budget, plus purportedly in “shutdown” arrears, September’s New Home Sales.
12 January 2026 – 08:39 Central Euro Time
The BEGOS Markets finally appear to be waking up to the new year. The Gold Update cites sovereign invasions, currency concerns, and now we read of Chairman Powell facing an investigative issue. At present, both the Bond and Spoo are below today’s Neutral Zones, whilst the two EuroCurrencies and Metals Triumvirate are above same; only Oil at the moment is inside its Neutral Zone; session volatility is mostly robust. Too, The Gold Update points to the yellow metal’s year-to-date growth pace as sufficiently steep such that our forecast high for this year — 5546 — could be reached as swiftly as by February’s end, albeit this highly is unlikely as markets do not move in a straight line. ‘Tis a very busy week for the Econ Baro, although nothing for today is scheduled. And Q4 Earnings — which has had quite a weak start with just 43% of 23 reporting companies having beaten their Q4s of a year ago — looks later in the week to the major financial entities.
The Gold Update: No. 843 – (10 January 2026) – “Six Days into ’26, Gold and Silver Net Upticks”
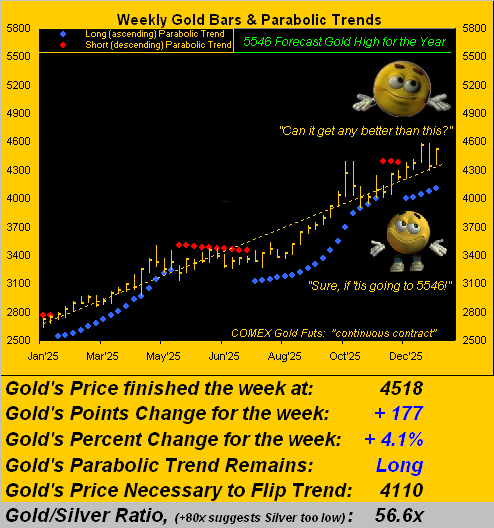
Six trading days into 2026 find Gold having already netted a year-to-date gain of +4.3% and Silver +12.4%. Or … just in case you’re scoring at home … to go deeper inside the data for the 138 hours so far traded, 81(59%) have been up for Gold and 75 (54%) have been up for Silver.
Moreover, from the “‘Tis Too Early to Extrapolate Dept.”, Gold at its current year-to-date regressed growth pace would achieve our 5546 forecast high for 2026 come 27 February. Too early, indeed, perhaps too much detail. Yet it punctuates just how positive are the precious metals’ internals thus far into the young year.
“And like you say, mmb, markets don’t move in a straight line…”
‘Tis axiomatic, Squire, given markets’ means reversion is natural phenomenon ![]() “do-doo-de-do-doo”
“do-doo-de-do-doo”![]() –[Henson, ’69]. For as we’ve herein quipped over the years: “The markets are never wrong; but they can be vastly misvalued.”
–[Henson, ’69]. For as we’ve herein quipped over the years: “The markets are never wrong; but they can be vastly misvalued.”
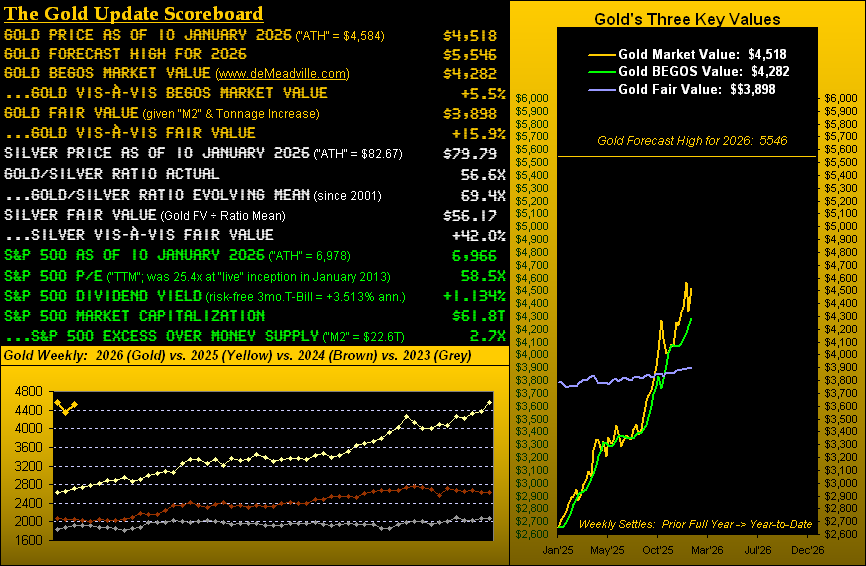
And thereto, overvaluation is the present state of both the precious metals — and far more so — that of the S&P 500. As depicted in our above newly-enhanced Gold Scoreboard, whereas Gold settled this past week yesterday (Friday) at 4518, ’tis +5.5% above its BEGOS Market Value* of 4282, and further, +15.9% above Fair Value of 3898. Too, Silver’s settle at 79.79 is +42.0% above her Fair Value of 56.17. So clearly there will be price retrenchment for both the yellow and white metals as the year unfolds, albeit within the broader context of Gold getting to 5546.
(*Valuing Gold by its price movement relative to those of the five primary BEGOS Markets: Bond, Euro, Gold, Oil, S&P 500).
As to the S&P 500, today’s market capitalization of $61.8T is 2.7x the supportive StateSide liquid money supply (“M2”) of $22.6T. And as we wrote in last Thursday morning’s Prescient Commentary, the S&P: “…settled [Wednesday] with a “live” P/E of 57.2x, more than double from its inception 13 years ago [meaning] earnings have since grown at less than half the rate of the S&P itself…” Then yesterday, the S&P recorded yet another record high (6978), boosting such price/earnings ratio to now 58.5x per the Scoreboard .
Again we reprise Jerome B. Cohen: “…in bull markets the average [P/E] level would be about 15 to 18 times earnings…” What that means for you WestPalmBeachers down there is by buying the S&P as a whole unit today, you’d pay $58.50 for something that earns $1.00 (an implied yield of 1.709%, the actual dividend yield by the Scoreboard being 1.134%), all whilst facing a “means reversion” capital risk of worse than -50% upon it all going wrong.
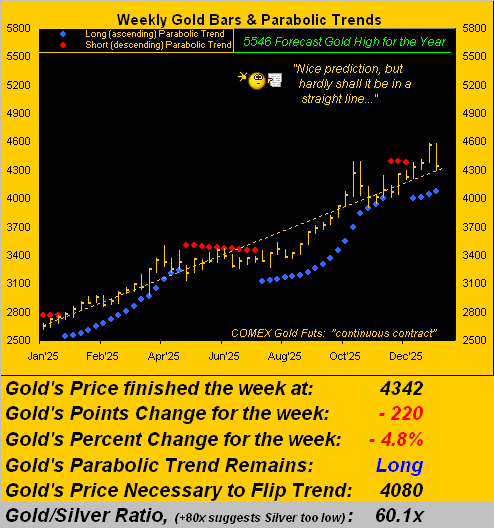
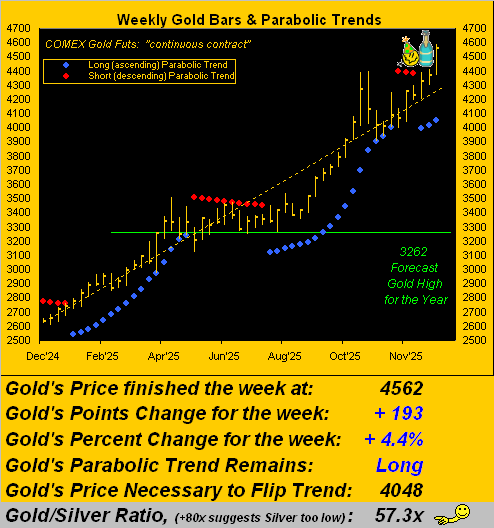
‘Course for Gold, ’tis all going well, (and by present valuation too well, but hardly shall we complain). For the 52 weekly settles from one year ago-to-date, Gold is trending higher at a rate of +1.1% per week. At such pace, price a year from now would be dubiously 7843. Comparably, by century-to-date, there’s been but one other mutually-exclusive similar pace: from mid-May 2005 to mid-May 2006, (price recording a +69% run from 421 to 712). History — as is its wont — has thus repeated as we go to Gold’s weekly bars since this a date year ago, the blue-dotted parabolic Long trend now five weeks in duration:
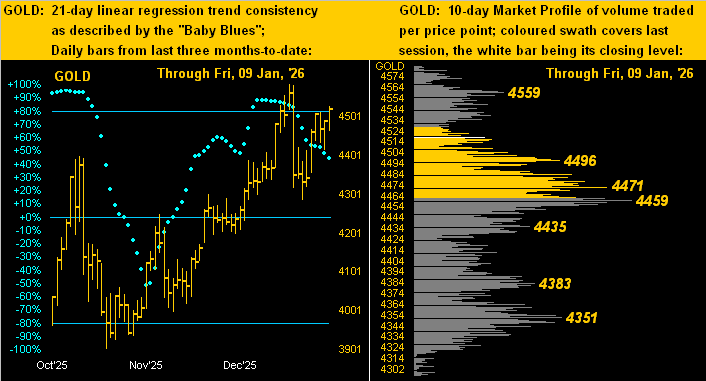
Supportive indeed for the precious metals are the aforementioned concerns over the world becoming a bit more wobbly. Regardless, anticipated trimming of recently netted gains “ought” not be too much of a concern. As to technically monitoring it all, we’ve this from our Market Rhythms’ analyses, with the corollary that ’tis — whilst current — measured via hindsight per each study’s last ten swing signals, (even as “shorting Gold is a bad idea”):
- Gold: for pure swing consistency, its best study of late has been the Parabolics on the 12hr time frame, else if targeting a profit per swing, the daily MACD;
- Silver: for pure swing consistency, her best study of late has been the Parabolics on the 30mn time frame, else if targeting a profit per swing, the 2hr MACD.
And, as always, remember: just because a technical study has profitably panned-out ten times in-a-row, ever-shifting market dynamics can bring such streak to an abrupt halt time and again.
“Yer sure givin’ it all away today, mmb…”
Just our way of humbly sharing with our valued readers what we’re seeing, Squire. Here’s to Gold and Silver!

Cheers!
…m…
www.TheGoldUpdate.com
www.deMeadville.com
and now on “X”: @deMeadvillePro
09 January 2026 – 08:36 Central Euro Time
Toward rounding out the first full trading week of 2026 , we’ve at present the Euro, Swiss Franc and Spoo below their respective Neutral Zones for today, whilst Copper is above same; BEGOS Markets’ volatility is moving toward moderate. Save for the Metals Triumvirate, EDTRs (see Market Ranges) are near or even below where they were at this time a year ago. The 30mn MACD for both Oil and the Spoo has been their best Market Rhythm on pure swing basis. By their Market Profiles, Oil finds volume-dominant support at 58.00 and the Spoo at 6953. At Market Trends, the Euro’s linreg (in real-time) has rotated from positive to negative, the Dollar Index continuing to get the currency bid thus far into the new year. The Econ Baro looks to January’s UofM Sentiment Survey, December’s Payrolls data, and in “shutdown” arrears, Housing Starts/Permits for perhaps both September and October. And tomorrow brings the 843rd consecutive Saturday edition of The Gold Update.
08 January 2026 – 08:36 Central Euro Time
The Spoo as a “continuous contract” topped 7000 yesterday for the first time; intraday, the S&P 500 made an all-time high (6966) and settled with a “live” P/E of 57.2x, more than double from its inception 13 years ago: that means earnings have since grown at less than half the rate of the S&P itself. At present, we’ve Gold, Silver and the Spoo all below their respective Neutral Zones for today; the balance of the BEGOS Markets are within same, and session volatility is mostly moderate. The Euro yesterday settled below its smooth valuation line (see Market Values) for the first time since 25 November, a portent of still lower prices near-term; at Market Trends, the Euro’s “Baby Blues” of trend consistency are accelerating lower as, too, are those for the Swiss Franc, and to an extent for Gold. The Econ Baro looks to some catch-up metrics today from the “shutdown”: included are November’s Consumer Credit, October’s Trade Deficit and Wholesale Inventories, and Q3’s initial read of Productivity and Unit Labor Costs.
07 January 2026 – 08:41 Central Euro Time
The Bond is at present above its Neutral Zone for today, whilst below same are Oil and all three elements of the Metals Triumvirate; session volatility for the BEGOS Markets is mostly moderate, save for the Spoo which thus far has traced just a wee 18% of its EDTR (see Market Ranges). Oil is now the only BEGOS component in negative linreg, albeit as noted yesterday, the “Baby Blues” of trend consistency continue to ascend, even as price is lower today; broadly, Oil’s best Market Rhythm — in hindsight with a profit target of 2.70 points per swing — has been its daily EMA, having reached that target the last 10 of 10 times; (too as noted yesterday, Oil’s best Market Rhythm on a pure swing basis has been the 4hr Moneyflow). Scheduled today for the Econ Baro are December’s ADP Employment data and ISM(Svc) Index, along with (purportedly for November) Factory Orders and Business Inventories.
06 January 2026 – 08:41 Central Euro Time
At present, we’ve the Bond below its Neutral Zone for today, whilst above same are both Silver and Copper; BEGOS Markets’ volatility is moderate across-the-board. Oil yesterday settled above (and currently is on) Market Profile support at 58.00: on a pure swing basis, Oil’s best Market Rhythm has been the 4hr Moneyflow; and by its Market Trend, although Oil’s linreg remains negatively sloped, but its “Baby Blues” of trend consistency are rising for the sixth-consecutive session. The Spoo at 6955 is -39 points below is continuous contract all-time high of 6994 (26 December ‘2025): the futs-adj’d “live” P/E of the S&P 500 is 55.7x and the yield 1.138% vs. the “risk-free” 3mo T-Bill annualized yield of 3.515%. Nothing is scheduled for the Econ Baro today; and as noted, Q4 Earnings Season is underway.
05 January 2026 – 08:43 Central Euro Time
Not surprisingly, the precious metals are getting a geo-political boost, both Gold and Silver, as well as Copper, at present above today’s Neutral Zones; below same are the EuroCurrencies and Oil, whilst quietly within are the Bond and Spoo; session volatility for the BEGOS Markets spans from light for the Spoo to robust for Copper. The Gold Update has selected 5546 as the yellow metal’s forecast high for this year, even as price is currently overvalued both by its Fair and BEGOS Market Values. Going ’round the Market Values horn in real-time for the five primary BEGOS components: the Bond is -2^03 points “low” vis-à-vis its smooth valuation line, the Euro is essentially in sync with same, Gold is +200 points “high”, Oil -2.35 points “low” and the Spoo +60 points “high”. The Econ Baro looks to December’s ISM(Mfg) Index. And Q4 Earnings Season gets underway.
The Gold Update: No. 842 – (03 January 2026) – “We Forecast Gold’s High for ’26 at 5546”

However, that raises the question of a barrier to Gold 5546: for if the Fed were not to cut… on verra…
In summary, yes Gold is — for the present– overvalued (and certainly so is Silver … again see the opening Scoreboard). But hardly would we sell here. More prudently, should Gold as the months unfold break below Fair Value (currently 3895), ’tis an opportunity to buy “mohrrrr….”
Either way, we’ll wrap it here with this observation: if Gold is overvalued, then the S&P 500 is massively so. Per our final 2025 Prescient Commentary from last Wednesday morning, we wrote: “The S&P 500 — which a year ago closed with its ‘live’ P/E at 46.1x — now finds it at 55.1x.” As depicted earlier in the BEGOS Markets’ Standings, the S&P sported a +16.4% gain for 2025; in turn, its Price/Earnings ratio increased (finishing the year at 54.6x) by +18.4%. For you WestPalmBeachers down there, that means relative to share prices, earnings growth for the Index as a whole wasn’t there! “Whoopsie…”

“GOT GOLD???”
…m…
www.TheGoldUpdate.com
www.deMeadville.com
and now on “X”: @deMeadvillePro
02 January 2026 – 08:41 Central Euro Time
Whereas the final trading day of 2025 saw all eight BEGOS Markets record a down day, this start to 2026 finds five of the eight to the upside: the Metals Triumvirate, Oil and Spoo all at present are above today’s Neutral Zones; below same are the Bond and Swiss Franc, (only the Euro is currently within its Neutral Zone); session volatility is moderate across the board. Tomorrow’s 842nd consecutive Saturday edition of The Gold Update — with its newly enhanced Scoreboard — shall also of course feature the final 2025 Standings of the BEGOS components, as well as our annual forecasted price for Gold’s high. As for “the now”, by Market Trends, Gold’s “Baby Blues” of linreg consistency continue to drop, as do those for the EuroCurrencies, and to a degree, for the Spoo, too. The Econ Baro awaits Construction Spending: because of the recent StateSide “shutdown”, there is source conflict as this being the report for October or November. On verra… Let the year commence.
31 December 2025 – 08:46 Central Euro Time
The final trading day of 2025 is a full session for the BEGOS Markets. At present, we’ve the Euro, Swiss Franc, Silver, Copper and Spoo all below their respective Neutral Zones for the session; the other BEGOS components (Bond, Gold and Oil) are within same, and volatility is mostly moderate-to-robust, the precious metals again to this hour already having traded in excess of 100% of their EDTRs (see Market Ranges); the EDTR for Gold is 90 points and for Silver ’tis 4.30 points; for pure swing trading, Gold’s best Market Rhythm is its 12hr Parabolics, whereas for Silver ’tis her 30mn Parabolics. As anticipated, Gold’s “Baby Blues” of linreg consistency (see Market Trends) have confirmed falling beneath the key +80% axis: structural support spans the 4200s, (which today already have been tapped per the session low thus far at 4283). The S&P 500 — which a year ago closed with its “live” P/E at 46.1x — now finds it at 55.1x. The Econ Baro (its 36 missing “shutdown” metrics notwithstanding) concludes the year with last week’s Initial Jobless Claims. Back Friday for the full session. A Safe and Happy New Year to All!
30 December 2025 – 08:36 Central Euro Time
Yesterday’s substantive selling in the precious metals found Gold’s intraday high-to-low drop of -5.8% ranking 19th-worst century-to-date, whilst that for Silver of -15.1% ranked 6th-worst. At present, both metals above above their Neutral Zones for today, as too are both Copper and Oil; the balance of the BEGOS Markets are within same, and session volatility is light-to-moderate, save for the two precious metals already having traced in excess of 100% of their EDTRs (see Market Ranges). Gold’s “Baby Blues” of linreg consistency (see Market Trends) have dropped (in real-time) below the key +80% axis, confirmation of which likely leads to lower prices near-term. Yesterday’s -0.3% fall in the S&P 500 was internally weaker, the MoneyFlow regressed into S&P points having been -0.7%. The Econ Baro looks to December’s Chi PMI. And the FOMC’s 09-10 December meeting Minutes shall be released late in the session.
29 December 2025 – 08:39 Central Euro Time
On the heels of the current edition of the Gold Update entitled “Yes, Gold REALLY Is Getting Ahead of Itself”, the precious metals are taking a bit of a pounding this morning: with all three elements of the Metals Triumvirate presently below today’s Neutral Zones, Silver — which began the session north of 80 in trading to a record high of 82.67, is now 75.52 , -5.2% having traded 266% of its EDTR (see Market Ranges), and Gold is 4491 with a 165% EDTR tracing. The Bond is at present above its Neutral Zone, and session volatility for the BEGOS Markets is mostly robust as skewed by the metals; notably quiet is the Spoo with just a 27% EDTR tracing. By Market Values (in real-time) for the five primary BEGOS components: the Bond is -1^27 points “low” vis-à-vis its smooth valuation line, the Euro +0.012 points “high”, Gold +314 points “high” in spite of today’s selling, Oil -2.20 points “low”, and the Spoo +135 points “high”. Due for the Econ Baro is November’s Pending Home Sales.
The Gold Update: No. 841 – (27 December 2025) – “Yes, Gold REALLY Is Getting Ahead of Itself”

Good grief, Squire, how did that WestPalmBeacher get in here?
“He didn’t, mmb, it’s just some kinda AI infiltration…”
Well, we simply must get on to our Amsteg security team. Honestly…
To Gold: With specific respect to this week’s title, our missive from back on 06 September, (the 14th anniversary of 2011’s All-Time Intraday Gold High at 1923), was queryingly entitled “Is Gold (Again) Getting Ahead of Itself?” The key word therein is “Again”. Because prior, we’d originally postulated about Gold having gotten ahead of itself away back on 01 October 2011 (Update No. 98), price having settled that Friday (30 September 2011) at 1627 and thus already -15% from the 1923 record high of just four weeks earlier.
But annoyingly, such postulation was far more prescient than that for which we planned: come 03 December 2015 — yes four years hence — Gold’s fallout from 1923 to 1045 completed an all-in correction of -45%.
“Oh no, mmb, yer not sayin’ this is gonna happen all over again … are you?”
Calme-toi, Squire. ‘Tis not gonna happen all over again, for there’s a big difference between ![]() “Now and Then”
“Now and Then”![]() –[BeaTles, ’23]:
–[BeaTles, ’23]:
- “Then”, during that massive decline, Gold was discarded as a yield-less, storagely-expensive, debasively-irrelevant relic. The 1045 bottom was -57% below its Fair Value that day of 2450.
- “Now”, having settled yesterday (Friday) at a record-high close of 4562, ’tis a +337% increase over the past 10 years, 2025 finding everyone having suddenly become a Gold expert, in turn morphing the precious metals into “meme” stocks as we’ve on occasion quipped since this past spring (seasonally and pricewise).
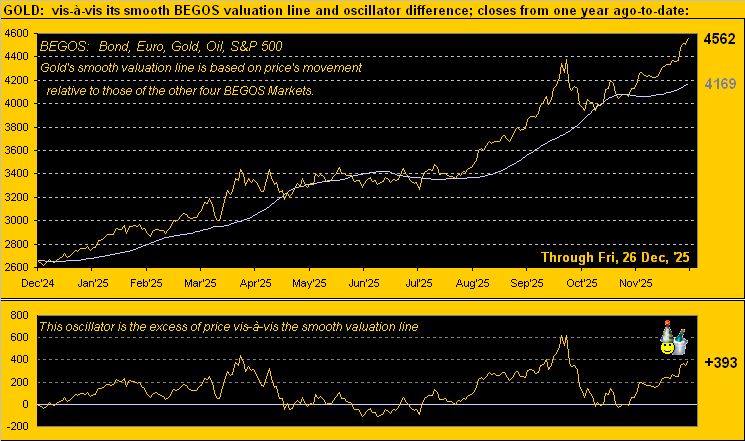
‘Tis been great for Gold, en route bringing Silver up to far more realistic pricing. But the recent overshoot of Fair Value is significant. By such metric, Gold at 4562 is now +17% above its 3891 Fair Value, whilst Silver at 79.68 is +42% above its 56.06 Fair Value. And you know, and we know, and given everybody from Bangor ME to Honolulu and right ’round the world instantly having become a Gold expert knows: the yellow metal since Nixon’s nixing of the Gold Standard (15 August 1971) has been priced sub-par relative to its Fair Value. But today, ’tis priced at that stated +17% premium. And “reversion to the mean” we ‘spect shall be seen.
Regardless of Gold’s mis-valuation, the market is never wrong: today’s 4562 level is the truth. Price’s primary driver these last 54 years is dollar debasement, offset to an extent by the increase in Gold’s supply.
Course, there is additional conventional wisdom to justify still-higher Gold: “Oh, the world is working toward war!”, they say; “Oh, the banks are going to fail!”, they say; “Oh, the fiats are finished!”, they say. And duly legitimate notions they all are. But at the end of the day, when such Gold-gyrating stimuli fall from the FinMedia fray, ’tis inevitably Dollar debasement that leads Gold’s upward way.
Thus — courtesy of the “Reverse Engineering Dept.” — we query:
“What ought be today’s level of the liquid U.S. Money Supply (“M2″) to justify 4562 Gold?”
M2 today is $22.5T and Gold’s Fair Value is 3891. So with a rough “back of the napkin” pencil scribbling — without regard for the ongoing increase in Gold’s tonnage — simple arithmetic proportion puts M2 up to $26.4T such as to be aligned with 4562 Gold today. For those of you scoring at home, that implies a +$3.9T M2 increase.
“And how long will that take, mmb?”
Squire, upon it all going wrong in the financial world, it could happen in a heartbeat. Regular readers of The Gold Update know of the “Look Ma! No Money!” crash wherein liquidation of the S&P 500’s current market capitalization of $61.5T would be readily supported by “only” $22.5T of M2. Your broker then remits to you an “I.O.U.”, stock trading ceases, and everyone “owed dough ” waits for the Federal Reserve to “print” and (in that vacuum) distribute the +$39T difference. Gold in turn would rapidly race up into the five figures.
That stated, following the Fed’s last series of rate hikes — which rightly rebased the Dollar in reducing M2 from $22.0T in April of 2022 to $20.6T come October 2023 — the money supply since has steadily returned to debasing, indeed at a regressed trending rate of +$15.7B per week.
Thus: at that pace from today’s M2 level of $22.5T to the $26.4T level supportive of Gold now at 4562 would take 250 weeks, i.e. some five years! But wait, it gets worse: account along the way for an increase in the Gold supply (typically some +2,770 tonnes per year) and empirically, it would take even longer for Gold to rightly be at today’s 4562. Yes, Gold REALLY has gotten ahead of itself; but far be it from us to stand in the way of the “bigger fish to fry” global financial stability concerns.
So relax: hardly are we bearish on Gold. We love what’s happening! But — the current “metals mania” aside — as we oft caution given Gold is a major liquid market, price shan’t ascend in a straight line, let alone move lower as such. And for the present being priced some +17% above Fair Value, Gold too is +9.4% (+393 points) above its BEGOS Market Value of now 4169:
And now into New Year we go, the record-high precious metals miraculously ![]() “Going to a Go-Go”
“Going to a Go-Go”![]() –[The Miracles, ’65]. As teased in the opening Gold Scoreboard, we’re revamping its look and expanding its summary of what we deem as critical “need-to-know” info on Gold, Silver, and too, the S&P 500: thus you’ll have a tidy summary at the top every Saturday. Indeed next Saturday shall be our month/quarter/year-end edition of The Gold Update (plus one trading day in January), including our Gold forecast high for 2026. So don’t give it a miss, as miracles do happen!
–[The Miracles, ’65]. As teased in the opening Gold Scoreboard, we’re revamping its look and expanding its summary of what we deem as critical “need-to-know” info on Gold, Silver, and too, the S&P 500: thus you’ll have a tidy summary at the top every Saturday. Indeed next Saturday shall be our month/quarter/year-end edition of The Gold Update (plus one trading day in January), including our Gold forecast high for 2026. So don’t give it a miss, as miracles do happen!

A Safe and Happy New Year to Everybody!
…m…
www.TheGoldUpdate.com
www.deMeadville.com
and now on “X”: @deMeadvillePro
26 December 2025 – 08:43 Central Euro Time
Today’s full session for the BEGOS Markets presently finds the Bond and Swiss Franc below their respective Neutral Zones, whilst above same are all three elements of the Metals Triumvirate, both Gold and Silver having again recorded new highs at 4562 and 75.50. Session volatility is moderate, noting therein that Silver has traced 105% of its EDTR (see Market ranges). Tomorrow’s 841st consecutive Saturday Edition shall give an estimate of how much the Money Supply (“M2”) need increase to catch up in matching these otherwise overvalued levels of the precious metals. Meanwhile, Gold by its BEGOS Market Value is (in real-time) +371 points above its smooth valuation line; the Spoo is currently +147 points above same. Nearby volume-dominant Market Profile support for Gold is 4518 whilst for the Spoo ’tis 6960. Nothing is due for the Econ Baro, (albeit 36 metrics remaining missing).
24 December 2025 – 08:33 Central Euro Time
We’ve furtherance of record highs this morning for the precious metals, Gold having tapped 4555 and Silver 72.75. At present above today’s Neutral Zones are both Silver and Copper; the balance of the BEGOS Markets are within same, and volatility for the abbreviated session is pushing toward moderate; (session closures range today from 18:00 GMT for stocks to 18:15 GMT and 18:45 GMT for the various BEGOS components). The S&P 500 yesterday settled at an all-time high (6910), albeit did not achieve its record intra-day high (6920 on 29 October); by Fair Value (+50 points) to the futures, the S&P at this instant would open lower by -6 points. And per Market Values, the Spoo in real-time is +134 points above its smooth valuation line; Gold is +364 points above same as price continues to break further above Fair Value (3896). Due for the Econ Baro are last week’s Initial Jobless Claims. Back on Friday for a full session, and thus a most Merry Christmas to one and all!
23 December 2025 – 08:33 Central Euro Time
Gold has cleared the 4500 handle in trading thus far to as high as 4531, whilst Silver has cleared its 70 handle in thus far reaching up to 70.16: whilst we welcome such lofty prices, a word to the wise is sufficient: Gold is at present +16% above Fair Value and Silver +24% above same. Too, the yellow metal is currently above today’s Neutral Zone, as are the Bond and Swiss Franc, a phenomena not unusual as we glide toward year-end. Session volatility for the BEGOS Markets is mostly moderate. Copper’s “Baby Blues” of linreg consistency (see Market Trends) continue to inch below the key +80%, albeit price has yet to respond in kind. They may be quite an array of data arriving today for the Econ Baro: problematic thereto is much conflict between our reporting sources as to what shall or shall not be issued, either timely or in arrears; we’ll have it all updated later in the session; also there is “talk” of another StateSide “shutdown” come late January.
22 December 2025 – 08:47 Central Euro Time
The current edition of The Gold Update entitled “Merry Metals!” is being well-vindicated this morning with record highs for both Gold (4453) and Silver (69.53); both are presently above today’s Neutral Zones as are Copper, Oil and the Spoo; below same is the Bond, and BEGOS Markets’ volatility is moderate, duly noting that Gold has traced 130% of its EDTR (see Market Ranges). Too, The Gold Update graphically summarizes the precious metals’ best pure swing Market Rhythms as currently Gold’s 12-hour Parabolics and Silver’s six-hour Moneyflow. The Spoo has regained the 6900s: currently 6910, the all-time high is 6975 (12 December); the futs-adj’d “live” P/E of the S&P 500 is 56.0x; the amount of money to move the S&P one point is the thinnest ’tis been since 15 October, (i.e. mind the froth). Nothing is scheduled today for the Econ Baro.
The Gold Update: No. 840 – (20 December 2025) – “Merry Metals!”


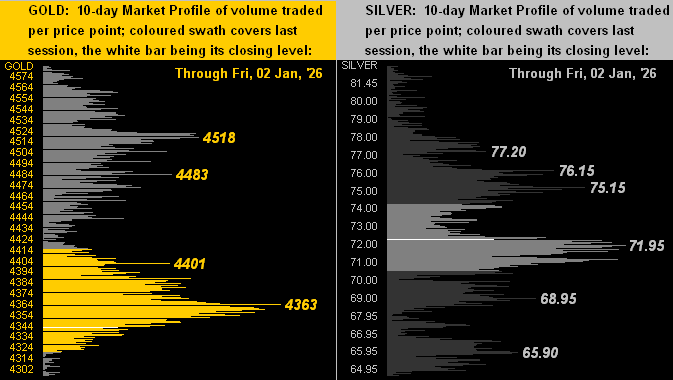
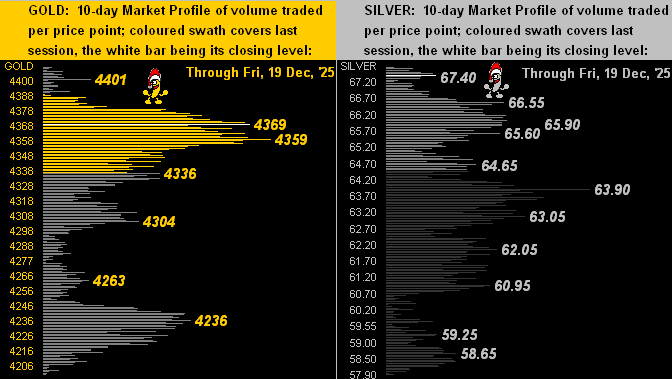
Next to our 10-day Market Profiles for Gold (below left) and for Silver (below right). With such an array of underlying support levels, ’tis truly a Santa Bananarama, which is ![]() “Really Saying Something … bop-bop shoobie do-wah”
“Really Saying Something … bop-bop shoobie do-wah”![]() –[’82]:
–[’82]:

Yet despite the Baro’s woes, the S&P 500 still seeks a Santa Claus rally, the Mighty Index now down just -14 points from November’s settle. We’ve recently pointed out that for the 24 completed Decembers thus far this century, 16 have been up, (which for you WestPalmBeachers down there means eight have been down).
Regardless, the FinMedia is “freaking out” (technical term). This past week brought two items of note from the children’s writing pool at the once highly-respected Barron’s. To wit:
—> (Tuesday) “Stock Markets Are Suffering Amid Bubble Fears” … “Suffering”? The S&P settled Tuesday a scant -1.5% below its all-time closing high. Now ’tis but -1.0%. But wait, it gets funnier:
—> (Friday) “The Stock Market Has a 10% Chance of a 30% Crash in 2026” … Since when did a 30% correction be deemed a “Crash”? More accurately, we’d opine — by employing the lost art of proper portfolio theory in concert with the S&P’s “live” price/earnings ratio of now 55.8x — that “The Stock Market Has a 100% Chance of a 50% Crash in 2026” … (write it down).
Rightly or wrongly either way, here’s the Gold Stack for Santa’s sleigh sack:
The Gold Stack (continuous contract pricing):
Gold’s All-Time Intra-Day High: 4410 (18 December 2025)
2025’s High: 4410 (18 December 2025)
10-Session directional range: up to 4410 (from 4199) = +211 points or +5.0%
Trading Resistance: Per the Profile 4410
Gold’s All-Time Closing High: 4374 (20 October 2025)
Gold Currently: 4369, (expected daily trading range [“EDTR”]: 66 points)
Trading Support: Profile notables 4369 / 4359 / 4336 / 4304 / 4263 / 4236
10-Session “volume-weighted” average price magnet: 4313
The Weekly Parabolic Price to flip Short: 4014
Gold’s Fair Value per Dollar Debasement, (from our opening “Scoreboard”): 3896
The 300-Day Moving Average: 3295 and rising
2025’s Low: 2625 (06 January)
The 2000’s Triple-Top: 2089 (07 Aug ’20); 2079 (08 Mar’22); 2085 (04 May ’23)
The Gateway to 2000: 1900+
The Final Frontier: 1800-1900
The Northern Front: 1800-1750
On Maneuvers: 1750-1579
The Floor: 1579-1466
Le Sous-sol: Sub-1466
The Support Shelf: 1454-1434
Base Camp: 1377
The 1360s Double-Top: 1369 in Apr ’18 preceded by 1362 in Sep ’17
Neverland: The Whiny 1290s
The Box: 1280-1240
Et voilà:

A Most Merry Metals’ Christmas to Everyone Everywhere!
…m…
www.TheGoldUpdate.com
www.deMeadville.com
and now on “X”: @deMeadvillePro
19 December 2025 – 08:43 Central Euro Time
Gold yesterday by its “continuous contract” reached another All-Time High at 4410; (the “front month” currently is February, which itself had reached 4433 on 20 October but with a lot of forward “premium” at that time when ’twas not yet the “front month”). Either way, more on having achieved 4410 in tomorrow’s 840th consecutive Saturday edition of The Gold Update. For the present, with session volatility for the BEGOS Markets moving toward moderate, we’ve the Bond and Swiss Franc below today’s Neutral Zones, whilst above same are Silver and Copper. Of note, Copper’s “Baby Blues” for linreg consistency (see Market Trends) yesterday dropped below their key+80% axis indicative of lower prices near-term; Copper’s best Market Rhythm of late is its daily MACD. The Econ Baro looks to December’s revision to the UofM Sentiment Survey and November’s Existing Home Sales; due too are that month’s Personal Income/Spending and “fed-favoured” Core PCE Index: instead however may come the still unreported data for October, given the “shutdown”.
18 December 2025 – 08:40 Central Euro Time
Another record high for Silver yesterday in trading up to 67.18 at which level year-to-date the white metal was up +129%; Silver currently is 66.61 and at present inside her Neutral Zone for today, as are all the BEGOS Markets, save for Oil’s being below same; session volatility is light. The NASDAQ 100 finished yesterday on a “Hobson Close” in settling on the low of the session, which by market lore is indicative of an up opening; indeed the Spoo is presently positioned for an opening S&P 500 gain of +22 points, placing the “live” futs-adj’d P/E at 54.2x. Too, the Spoo yesterday settled having crossed below its BEGOS Market Value, typically indicative of still lower prices near-term; the Spoo’s linreg trend remains up, but ’tis weakening (see Market Trends). Amongst the metrics expected today for the Econ Baro are December’s Philly Fed Index and November’s CPI; the Conference Board’s Leading (i.e. “lagging”) Indicators are “scheduled” but are not likely to be reported as the wake of the “shutdown” keeps the full view of the economy somewhat in question.
17 December 2025 – 08:40 Central Euro Time
We’ve record highs for Silver this morning, up to as much as 66.65; and even as the Dollar Index is up a firm +0.5%, all three elements of the Metals Triumvirate are at present above their respective Neutral Zones for today, as is Oil; below same are the Bond, Euro and Swiss Franc, and session volatility for the BEGOS Markets is moderate-to-robust, Silver having thus far traced 119% of its EDTR (see Market Ranges). Looking at Market Values for the five primary BEGOS components: the Bond is -2^08 points “low” vis-à-vis its smooth valuation line, the Euro +0.013 points “high”, Gold +250 points “high”, Oil -3.72 points “low” and the Spoo +62 points “high”. Incoming data for the Econ Baro remains sporadic as “scheduled” reports in arrears are not necessarily being released; there are three metrics “due” for today (including November’s Retail Sales and October’s Business Inventories), but already they are indicated as likely not to arrive; either way, data that is being released has continued to move the Baro lower month-to-date.
16 December 2025 – 08:49 Central Euro Time
Presently we’ve the Metals Triumvirate and Spoo all below today’s Neutral Zones; the other BEGOS Markets are within same, and volatility thus far again is moderate. Save for Silver and Copper, EDTRs (see Market Ranges) of late have been narrowing. And by Market Trends, save for the Bond and Oil, the six other BEGOS components are in 21-day linreg uptrends. The Spoo’s moving from its December cac into that for March has added +59 points of premium to price; the March Spoo yesterday meekly moved up through significant Market Profile resistance before being swiftly sold back down; currently 6839, such resistance is 6908 up to 6926; the Spoo’s EDTR is 78 points. There are 11 metrics “scheduled” today for the Econ Baro, some in arrears and some timely; they notably include: November’s Payrolls data (to fold in as able some of that for October which was not reported), IndProd/CapUtil, October’s Retail Sales, plus September’s Housing Starts/Permits and Business Inventories.
15 December 2025 – 08:37 Central Euro Time
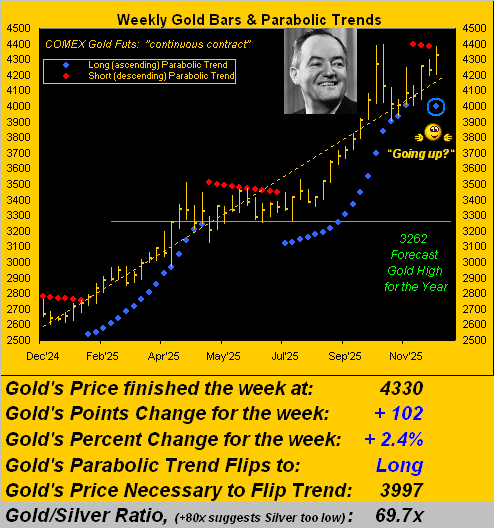
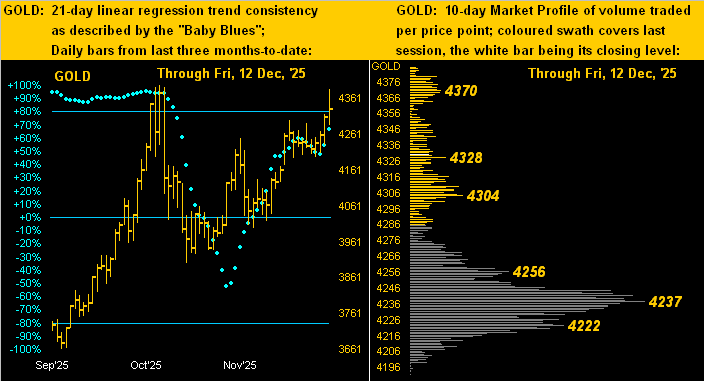
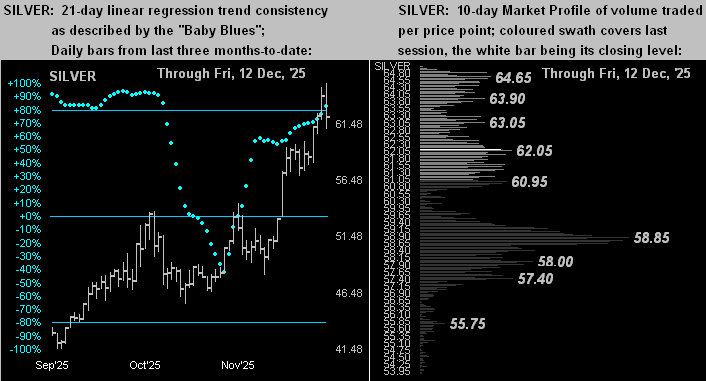
The final full trading week of the year begins, finding at present the Bond and Metals Triumvirate above their respective Neutral Zones for today; none of the other BEGOS Markets are below same, and session volatility is moderate. The Gold Update celebrates Silver having surpassed 60, and the yellow metal’s weekly parabolic trend having flipped from yet another “short-lived” Short stint (just 3 weeks) to Long; presently 4377, Gold is only -21 points below its record 4398 high; by their Market Profiles, Gold’s most volume-dominant support is 4237 and for Silver (currently 63.43) ’tis 58.85. Oil’s cac volume is moving from January into that for February, and that for the Spoo from December into March. Purportedly “scheduled” this week for the Econ Baro are 26 metrics, some delayed, some current: for today we await December’s NY State Empire Index and the NAHB Housing Index.
The Gold Update: No. 839 – (13 December 2025) – “Gold Beams Back To Long; Silver Screams So Strong!”
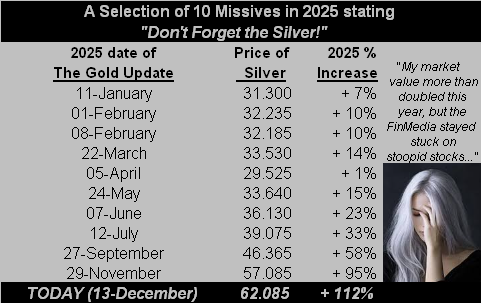
Indeed, Sweet Sister Silver, few took notice of you until just recent weeks. And yet, what an incredible year you’ve had! Like Gold, your settle yesterday at 62.09 is an All-Time Weekly Closing High, which per the above table places you +112% year-to-date, let alone your having also en route achieved an All-Time Intraday High to 65.09, at which price you momentarily were +122% in 2025.
Moreover: as herein a week ago graphically portrayed would be inevitable, the Gold/Silver ratio fully reverted to its evolving mean (69.4x century-to-date), penetrating it to 66.7x during Thursday; (it settled the week at 69.7x).
And for the “johnny-come-lately” FinMedia came the usual “having just figured it out” hype. “Oh Silver is going to 100!” they say; “Oh Silver is gonna hit 200!!” they say; “Oh Silver will get to 300!!!” they say. (Yes, we’ve seen all three prognosticative “reports”).
But we “say” let’s instead do the math, ok? For what reasonably is Silver’s Fair Value today?
Again, ’tis a simple calculation as we’ve previously presented. Per the opening Gold Scoreboard, the Fair Value for the yellow metal is presently 3893. Divide that by the mean of the Gold/Silver ratio (69.4x) et voilà the Fair Value of the white metal is now 56.08. Thus currently priced at 62.09, we may “say” that Silver is +11% overvalued. Too, by her “textbook technicals” (our cocktail of Relative Strength, Stochastics and John Bollinger’s Bands), Silver is now 22 consecutive trading days “overbought”; (by comparison, Gold and Copper both are 11 days “overbought”) … all that just in case you’re scoring at home.
But: at least Silver finally has achieved an area of rational market valuation. “Brava Brava, Sista Silva!!”
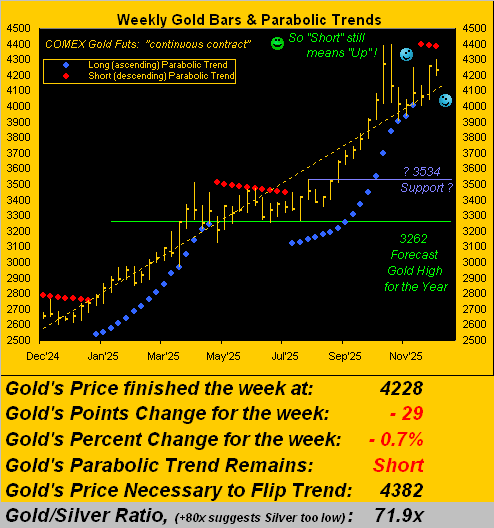
As for good old precious Gold, on its way to making this fresh All-Time Weekly Closing High, the weekly parabolic Short trend again met a “short-lived” end. Since February 2024, there have been five such parabolic Short trends of 3, 3, 10, 10 & 3 weeks; but those Long have been 17, 16, 17, 16 & 17 weeks. Indeed, the similarity of the Long trends’ durations is striking: ![]() “Uh oh, it’s magic”
“Uh oh, it’s magic”![]() –[The Cars, ’84]. And now a new one has begun, (technically come Monday’s open),
–[The Cars, ’84]. And now a new one has begun, (technically come Monday’s open),
However, ’tis actually not magic; rather ’tis math that makes the next graphic’s newly-encircled blue dot appear. And today priced at 4330, Gold in 2025 is +64%, with the All-Time Intraday High from 20 October still in place at 4398. As for the just “failed” Short trend of only three red-dotted weeks, it opened on Monday 24 November at 4069 and was snuffed out yesterday at 4330. (Reminder: “Shorting Gold is a bad idea”). Rather, we’re “pleased as punch” indeed, HHH:
Thus year-to-date for the precious metals ’tis been great, albeit arguably quite extended given both Gold and Silver presently +11% above Fair Value. In fact by rounding out the Metals Triumvirate, Copper also is having a fine year +33%, its sixth-best this century. That, too, has brought some bounce to Sister Silver from her industrial metal aspect, although we can also credit Copper as being money, certainly so from the Bronze Age (2000 BC).
Regardless, per our title, Gold has beamed back to Long with Silver screaming so strong! Which reminds us that upon blending in your Osterizer precious Gold with industrial Copper and pressing “puree”, you of course get Silver! (Metallurgists, please hold your email):

Either way, collect all three today!!!
Cheers!
…m…
www.TheGoldUpdate.com
www.deMeadville.com
and now on “X”: @deMeadvillePro
12 December 2025 – 08:39 Central Euro Time
Presently, all eight BEGOS Markets are within today’s Neutral Zones, and session volatility is light. Silver yesterday traded up to a record high of 64.72, however by Fair Value, the white metal has become quite overvalued: more on that in tomorrow’s 839th consecutive Saturday edition of The Gold Update. Amongst the five primary BEGOS components, we’ve currently no notable correlations. The Dollar Index yesterday traded down to its lowest level (98.135) since 24 October. The S&P 500 yesterday reached its highest level (6903) since the all-time high of 6920 on 29 October. Volume for the currencies (Euro, Swiss Franc and the non-BEGOS Yen) is moving from their respective December cacs into those for March. And nothing is scheduled today for the Econ Baro, albeit some four dozen metrics remain missing per the six-week Oct-Nov StateSide “shutdown”.
11 December 2025 – 08:41 Central Euro Time
The Bond is presently above its Neutral Zone for today, whilst below same are Copper, Oil and the Spoo; session volatility for the BEGOS Markets is firmly moderate. As anticipated, the FOMC voted with dissent to nonetheless cut the FedFunds rate -25 bps to the 3.50%-3.75% target range: the S&P 500 responded in moving to its highest level (6901) since 29 October (wherein the all-time high of 6920 still stands); however, overnight selling has pushed the Spoo (6840) lower towards its BEGOS Market Value (6801), the futs-adj’d “live” P/E at 57.7x. Silver has recorded another record high this morning at 63.25, however has since slipped back into today’s Neutral Zone. And incoming metrics “scheduled” in arrears today for the Econ Baro are both September’s Trade Deficit and Wholesale Inventories.
10 December 2025 – 08:42 Central Euro Time
Silver yesterday topped 60.00 for the first time and thus far today has traded to as high as 62.14, the Gold/Silver ratio having fully reverted to its century-to-date evolving mean of 69.4x, the ratio currently 68.3x; the white metal is at present above its Neutral Zone for today, as is Copper; the rest of the BEGOS Markets are within same, and session volatility is light. Silver’s best Market Rhythm is currently (if seeking a targeted outcome of 0.52 points) is the 12hr MACD, or on a pure swing basis the 6hr MACD; of note, Gold these last couple of weeks continues not to confirm Silver’s rally. What is “scheduled” for the Econ Baro versus that which is actually released of late is patchy at best: expected for today is November’s Treasury Budget, plus in arrears, Q3’s Employment Cost Index. Then come 19:00, look for the FOMC (not unanimously) to lower the FedFunds rate by -0.25% to the 3.50-3.75% target range.
09 December 2025 – 08:37 Central Euro Time
Only Copper is at present outside (below) its Neutral Zone for today; moreover, it already has traced 106% of its EDTR (see Market Ranges); otherwise, BEGOS Market’s volatility is mostly light. By Market Rhythms, Copper’s best is its daily MACD. Too, ’tis unusual to see one market dominating our Top Three Rhythms for pure swing consistency, but on a 10-test basis, ’tis the Euro’s 15mn Parabolics, 1hr EMA, and 6hr MACD. Yesterday’s S&P 500’s MoneyFlow (+0.2%) was firmer than the Index itself (-0.3%); the Spoo’s trading range is narrowing: the EDTR just back on 25 November was 119 points; today ’tis 83 points. “Scheduled” today for the Econ Baro are the Q3 revisions to Productivity and Unit Labor Costs, the preliminary readings for which were not reported given the “shutdown”.
08 December 2025 – 08:42 Central Euro Time
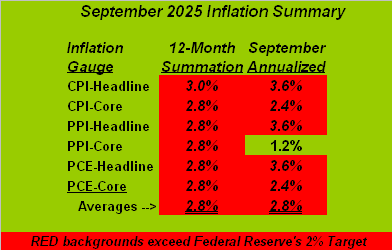
Presently, the Euro is the only BEGOS Market outside (above) its Neutral Zone for today; session volatility is light-to-moderate. The Gold Update points to Silver having nearly reached the milestone of 60.00 (59.90 on Friday); too, we calculated a Fair Value for Silver at 56.05. Also therein, September’s inflation summary table is indicative of paces running above the Fed’s desired 2% target range such that they ought not cut the Funds rate come Wednesday, but likely shall so do given a weakening jobs market at least by ADP data; (recall the BLS was shutdown for six weeks). As the Spoo meanders higher this morning, the S&P 500 looks to start its week with a “live” P/E of 58.2x. For the five primary BEGOS components per their Market Values (in real-time): the Bond is -2^10 points below its smooth valuation line, the Euro basically in sync nears its line, Gold +168 points above same, Oil in sync, and the Spoo +88 points over its line. Nothing is scheduled today for the Econ Baro.
The Gold Update: No. 838 – (06 December 2025) – “Gold Sinks Slightly as Silver Skirts Sixty”

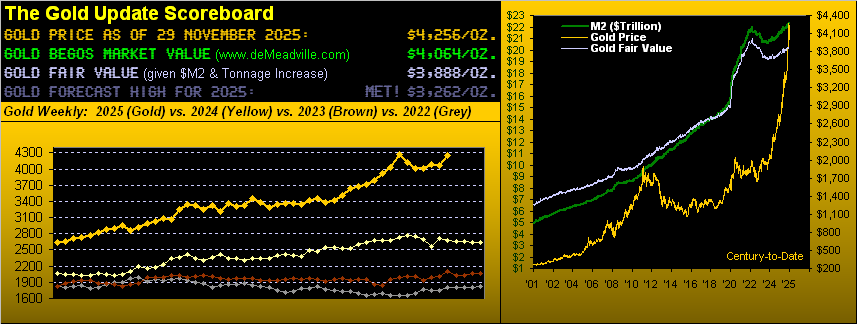
And yes, Virginia, in that display the price/earnings ratio of the S&P 500 truly is now an “off the edge of the bell curve” 58.0x, the mighty Index having settled yesterday at 6870, a mere -50 points below its all-time intraday high of 6920 (29 October). ‘Tis too bad earnings are not sufficient enough to keep pace with price, (let alone an “M2” money supply of $22.4T that is vastly unsupportive of the S&P’s $60.8T market capitalization). Reprise: ![]() “When the levee breaks…”
“When the levee breaks…”![]() –[McCoy/Minnie ’29; Led Zeppelin ’71].
–[McCoy/Minnie ’29; Led Zeppelin ’71].
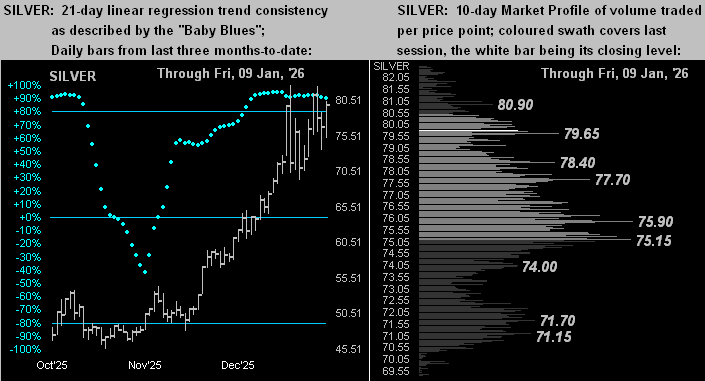
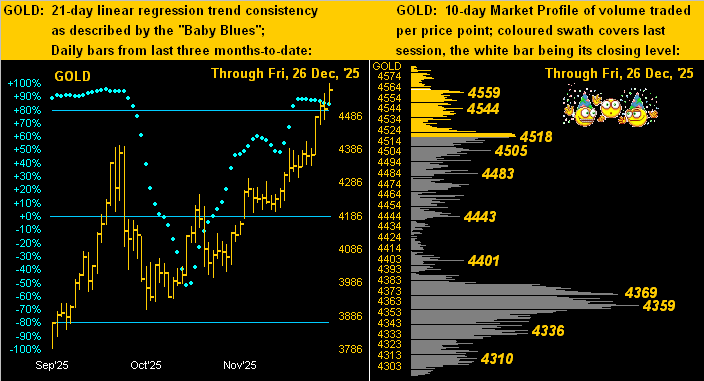
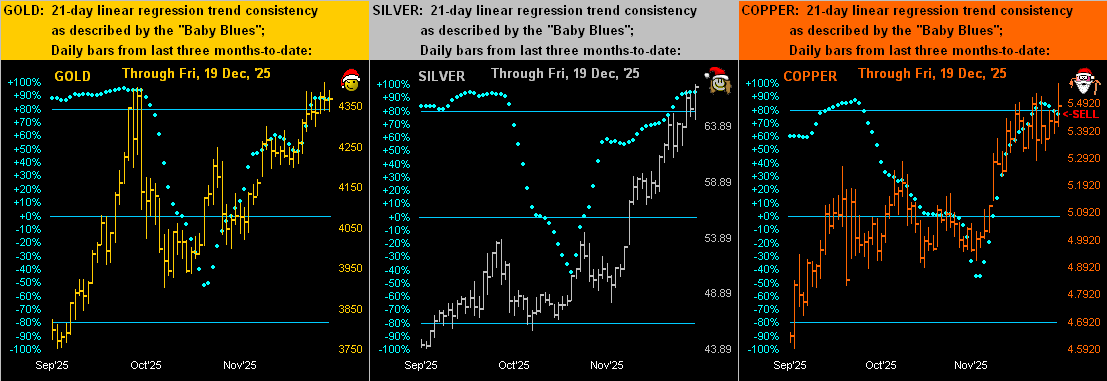
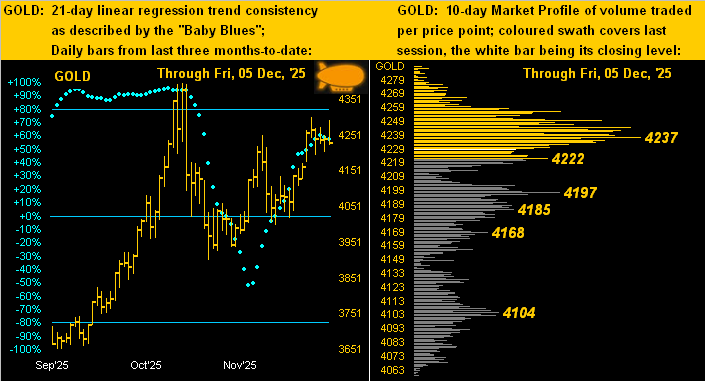
However, hovering of late as if a zeppelin unto itself has been Gold. But as we turn to the two-panel display of Gold’s daily bars from three months ago-to-date on the left and 10-day Market Profile on the right, one senses some descent. Note therein the “Baby Blues” of regression trend consistency having ticked lower for the past two days. Too, price has slipped below its most volume-dominant Profile support level of 4237. Not that this absolutely turns the tide, but it does remind us that hardly do markets move in a straight line:
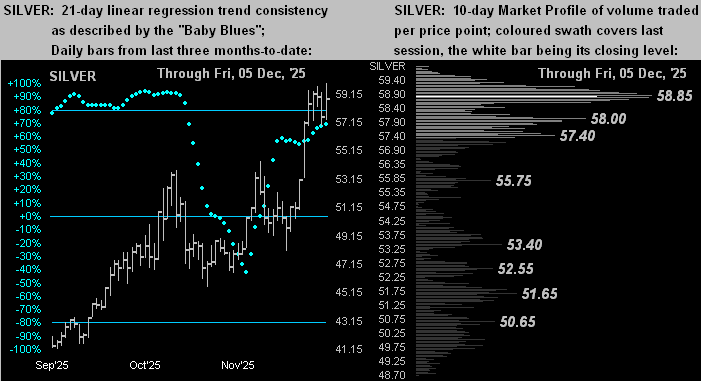
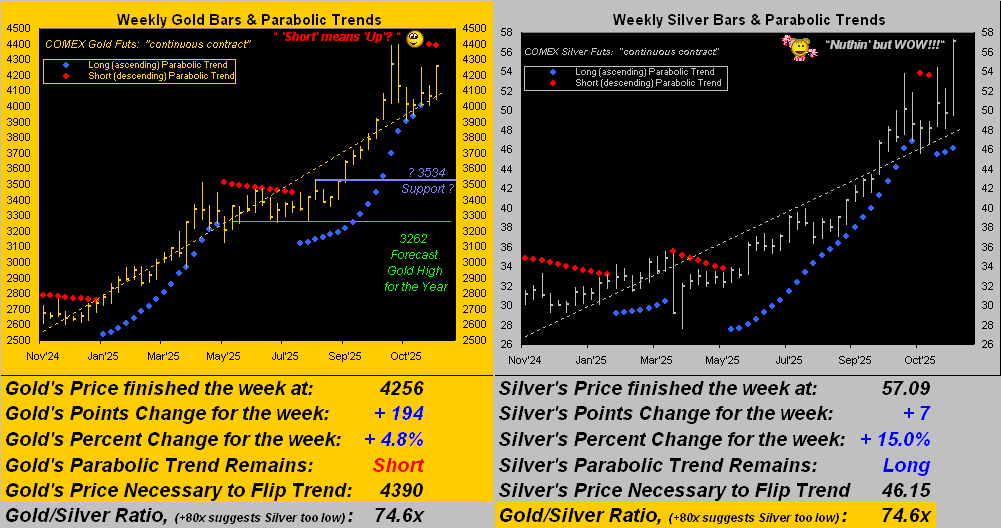
To wrap, per our title, Gold sank slightly (-0.7% net for the week) as Silver skirted sixty (+3.0% net for the week). And now Sister Silver sits at 58.80, a mere 1.20 points from 60.00, with an expected daily trading range of now 2.24 points. By such yardstick, Silver can grab 60.00 come Monday. But then there’s Wednesday and the aforementioned FOMC Policy Statement on the Funds Rate. A cut almost surely shall see Silver eclipse 60.00. But what if the Committee instead abstains?
To wit: as longtime readers of The Gold Update know, our microphones are just about everywhere, including last week at the Eccles Building in D.C. wherein a small contingent of Silver traders came down on the bus from the COMEX in N.Y. to plead Powell for another rate cut. Squire even arranged for an inconspicuous MINOX camera to capture the moment:

But should such plea fail a cut by which to abide — and prices thus decide to slide — keep Gold and Silver for the ride!
Cheers!
…m…
www.TheGoldUpdate.com
www.deMeadville.com
and now on “X”: @deMeadvillePro
05 December 2025 – 08:41 Central Euro Time
The EuroCurrencies and Metals Triumvirate are all above today’s Neutral Zones; none of the other BEGOS Markets are below same, and session volatility is on balance moderate, Copper however having already traced 130% of its EDTR (see Market Ranges). The Spoo has thus far traded up to 6884, its highest level since 13 November; too, the Spoo’s “Baby Blues” of linreg consistency (see Market Trends) have inched back above their 0% axis, the trend having rotated from negative to positive despite the “textbook overbought” condition of the S&P 500 itself; the Spoo settled last evening an excessive 126 points above its Market Magnet; currently 6882, the Spoo’s most volume-dominant supporter is 6863. Gold is completing its third week of the parabolic Short trend, the past two weeks of which have been up; more on that in tomorrow’s 838th consecutive Saturday edition of The Gold Update. And scheduled for the Econ Baro are December’s UofM Sentiment Survey, October’s Consumer Credit, plus purportedly in arrears, September’s Personal Income/Spending and “Fed-favoured” Core PCE.
04 December 2025 – 08:41 Central Euro Time
The Bond, Swiss Franc and Silver are all presently below their respective Neutral Zones for today; the balance of the BEGOS Markets are within same, and volatility to this point of the session is light-to-moderate. Silver’s daily bars have the appearance of a near-term top being put in place despite yesterday’s all-time high of 59.66, (price now 57.99); Silver’s best swing Market Rhythm if seeking a profit target (0.84 points) is the 6hr Moneyflow, whereas on a pure swing basis ’tis the 4hr Parabolics. Meanwhile the S&P 500 has worked its way up technically to a moderately “textbook overbought” condition; more importantly, the fundamental reality of the “live” (futs-adj’d) P/E of now 58.7x is essentially off the end of the Bell Curve. Metrics scheduled today for the Econ Baro include October’s Trade Deficit and September’s Factory Orders.
03 December 2025 – 08:33 Central Euro Time
Presently above today’s Neutral Zones are the Euro, Swiss Franc, Copper and Oil, whilst below same is Silver; session volatility for the BEGOS Markets is pushing toward moderate. Yesterday for the Swiss Franc, price settled above the most volume-dominant Market Profile resistor, as well as pierced above its Market Magnet. Currently topping our Market Rhythms for pure swing consistency are (on a 10-test basis) the Swiss Franc’s 8hr MACD and for Silver both its 2hr MACD and 4hr Parabolics, plus (on a 24-test basis) the Euro’s 4hr MACD, Silver’s 2hr Parabolics, and the non-BEGOS Yen’s 4hr MACD. The Econ Baro looks to November’s ADP Employment data ISM(Svc) Index, and perhaps in “shutdown” arrears September’s Ex/Im Prices and IndProd/CapUtil.
02 December 2025 – 08:44 Central Euro Time
Silver, after achieving another all-time high yesterday at 59.44 — then year-to-date +103% — is at present below today’s Neutral Zone; the balance of the BEGOS Markets are within same, and session volatility is light. The S&P 500’s mid-November correction of some -350 points and subsequent return back up was enough to unwind any textbook technical overbought/oversold conditions; however, the “live” (futs-adj’d) P/E of 56.1x remains our biggest overvaluation (understatement) concern. Specific to the Spoo by Market Trends, its linreg had rotated from positive to negative effective 17 November, but as the “Baby Blues” of trend consistency are recovering, such trend looks to rotate back to positive in a day or two, barring substantive selling; for consistent swing trading, the Spoo’s best Market Rhythm of late has been the 30mn Price Oscillator. Nothing is scheduled today for the Econ Baro.
01 December 2025 – 08:34 Central Euro Time
Both the Bond and Spoo are at present below today’s Neutral Zones, whilst above same is Oil; session volatility for the BEGOS Markets is firmly moderate as December commences. The Gold Update celebrates Silver’s remarkable year, through Friday +94.9%, and even more so this morning, having hit another all-time high at 58.61. Silver’s best Market Rhythm for pure swing consistency has been the 2hr MACD, or for targeted profit (0.84 points/cac) the 6hr Moneyflow; and Silver’s EDTR (see Market Ranges) is 2.13 points/day. Meanwhile Gold at 4275 is -123 points below its record high level of 4398 (20 October). For the Econ Baro we’ve November’s ISM(Mfg) Index plus (purportedly) September’s Construction Spending, one of 49 “missing” metrics from the StateSide “shutdown”.
The Gold Update: No. 837 – (29 November 2025) – “Gold’s New Short Trend Shoved Aside; Silver’s Rise to All-Time Highs”


“So can we play your tune, mmb?” Spin it, Squire:
![]() “Follow the Blues instead of the news, else lose yer shoes”
“Follow the Blues instead of the news, else lose yer shoes”![]()
(Squire has this closet DJ thing going on of late).
Now to peek at the Economic Barometer and accompanying S&P 500 (red line). And you know the old expression that when government is out of the way, (i.e. “gridlock is good”), the economy is less suffocated. However: even though nearly three weeks have passed since the StateSide “shutdown” was resolved, there actually is an increase in missing metrics as bureaus are strained to “catch-up”. In fact, since 01 October, there’ve been 98 scheduled Econ Baro metrics, of which half (49) are now missing; a week ago ’twas 46. All that said, such absence of data has evolved into a rising Baro such that we penned in yesterday’s Prescient Commentary “…the Econ Baro has returned to its highest level since last February, which if detected by the FOMC may see rates held steady rather than cut come the 10 December Policy Statement….”:
Sadly of course per the graphic, earnings remain unsupportive of the S&P’s catastrophically high price level. (But then again, that’s archaic old-school piffle; today nobody cares).
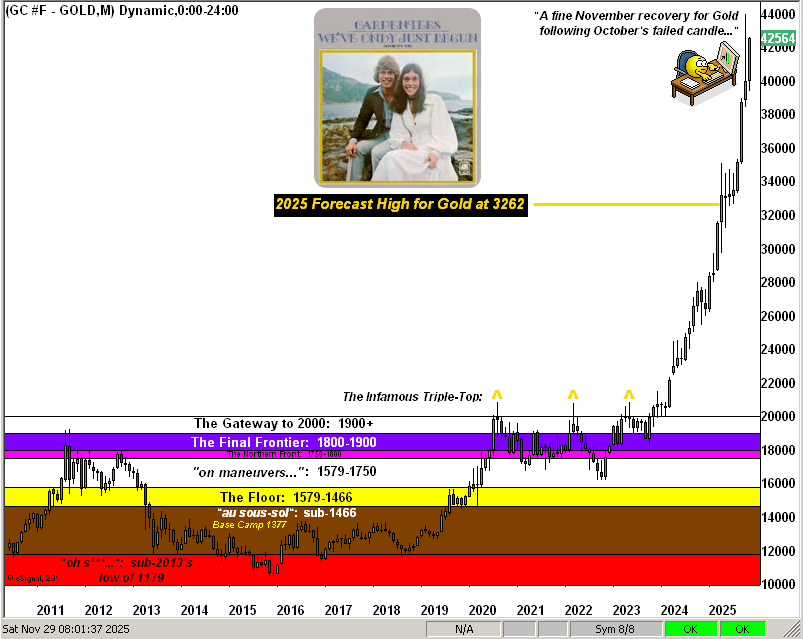
Toward this week’s wrap we’ve the Gold Structure by the month across the past 16 years. Concern over the last month’s “failed” October candle was short-lived, albeit let us be cognizant that we’ve only just begun a weekly parabolic Short trend, (which with bullish persistance, too, shall fail of its own accord).
“Here ya go mmb, Carpenters 1970…” ![]() “We’ve only just begun…”
“We’ve only just begun…”![]()
Indeed, “DJ” Squire. Aren’t you instead supposed to be on avalanche control this time of year?
“Yeah mmb, during next month up in the Haute-Tarentaise.”
You might mind the S&P as well, Squire, as when it goes over the cliff, ’tis gonna be scary! Meanwhile, here’s the happy Gold Structure:
Cheers!
…m…
www.TheGoldUpdate.com
www.deMeadville.com
and now on “X”: @deMeadvillePro