The Euro, Gold and Silver are at present above their respective Neutral Zones for today; none of the other five BEGOS Markets are below same, and session volatility is moderate. The S&P’s -2.7% decline yesterday was its worst since the -2.9% fall last 18 December, (prior to which was -3.0% last 05 August); obviously the leading aspects of our deMeadville analytics have been well ahead of the selling, technically by the Spoo’s linreg having already rotated to negative (see Market Trends) and fundamentally of course by the ongoing excessive overvaluation of the S&P given lack of earnings substance; by the Spoo’s Market Profile, overhead volume resistance spans the 5748-5797 zone. All that said, the S&P is now 10 consecutive trading days “textbook oversold”. Again, ’tis a quiet day for the Econ Baro ahead of February’s retail inflation (Wednesday) and wholesale inflation (Thursday).
 Mark
Mark
10 March 2025 – 08:45 Central Euro Time
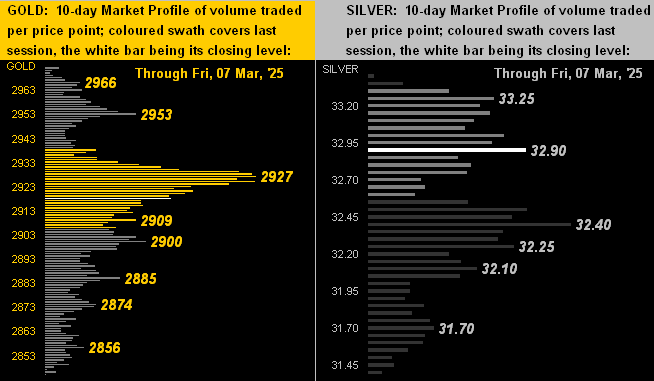
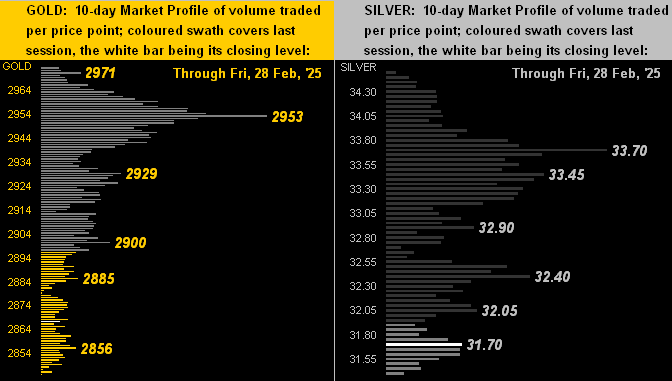
At present we’ve the Swiss Franc and Silver above today’s Neutral Zones; below same is the Spoo, and BEGOS Markets’ volatility is pushing toward moderate. The Gold Update cites the yellow metal having traced its first “inside” week year-to-date: our near-term bias remains for lower levels, and in real-time Gold’s linreg has rotated to negative (see Market Trends), the “Baby Blues” of trend consistency now below their 0% axis; by Market Profiles, Gold’s key line-in-the-sand is the volume-dominant 2927 level; and by Market Values, price in real-time is +66 points “high” above its smooth valuation line. The Econ Baro is quiet both today and tomorrow ahead of February inflation data later in the week. Too, the Spoo, Euro and Swiss Franc are due to see their cac volumes roll from March into June come week’s-end.
The Gold Update: No. 799 – (08 March 2025) – “Gold Goes Inside; Stocks Maintain Slide”
Whilst we’ve still our near-term negative bent for the price of Gold, nonetheless let’s reprise this from last week’s missive: “…one thing to watch is a stirring of geo-political jitters which as you regular readers know can quickly send Gold higher — but generally just briefly — before returning down from whence it came…”
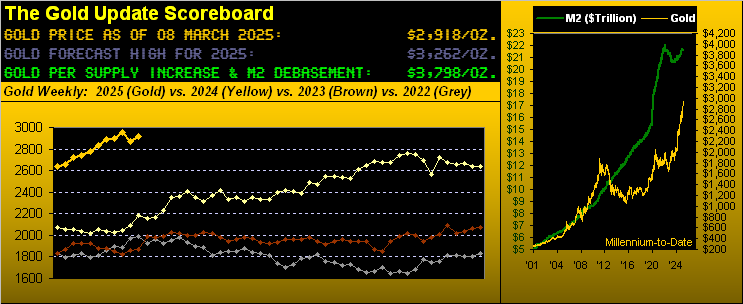
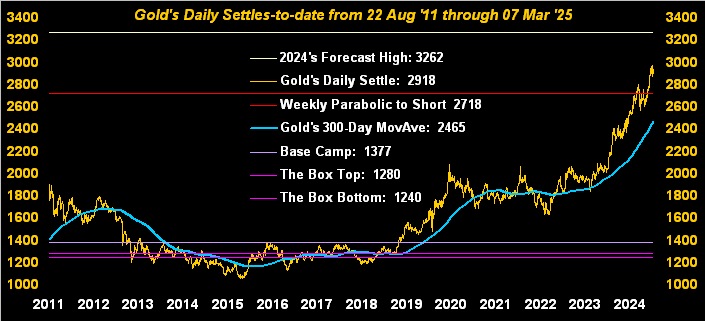
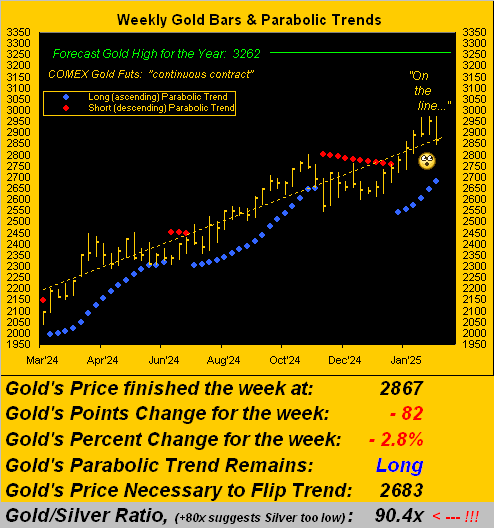
And from the prior Friday’s White House brawl to yesterday morning’s RUS/UKR missile-drone attack, such geo-political jitters — in tandem with tariff tantrums — have kept Gold aloft, price settling the week at 2918 for a net five-day gain of +1.8% (+50 points).
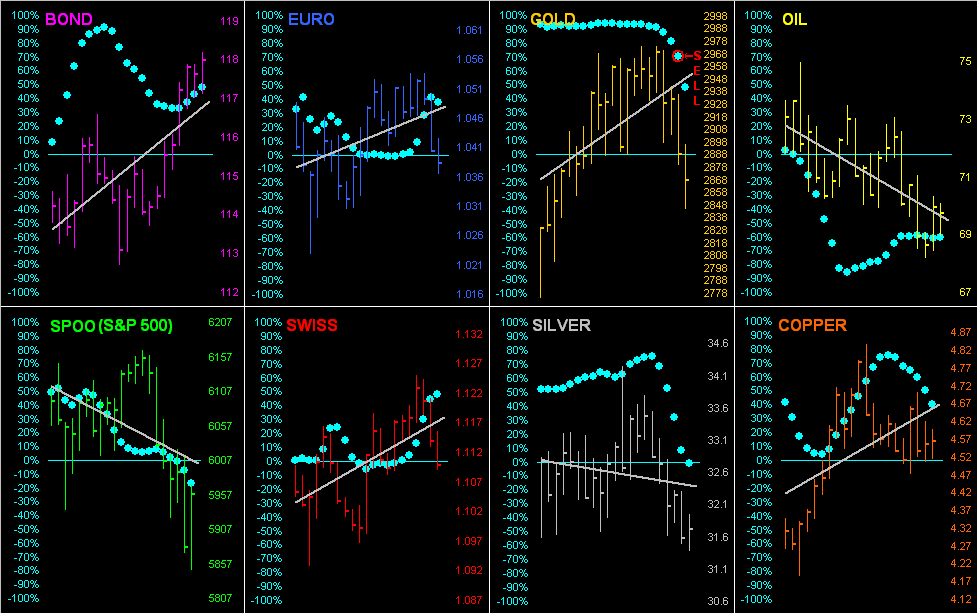
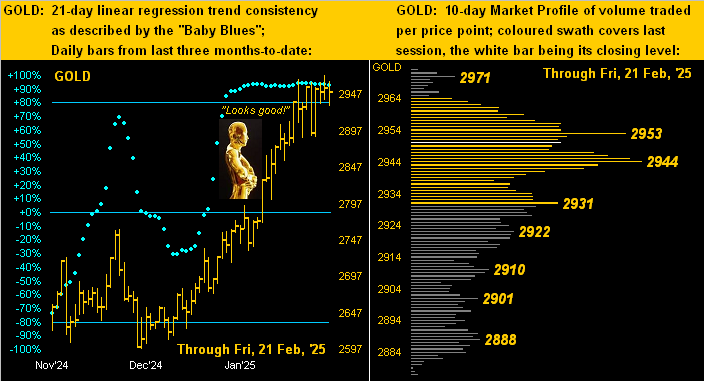
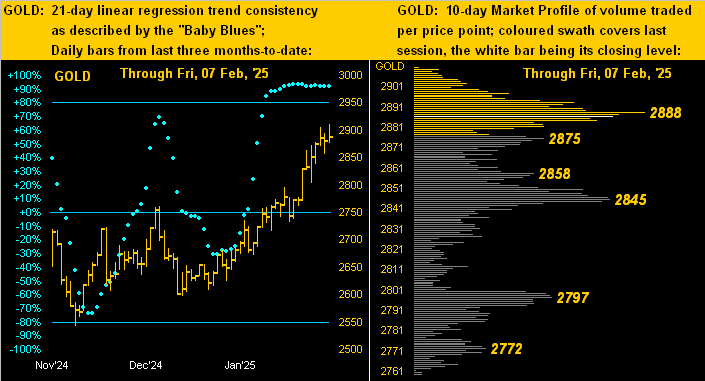
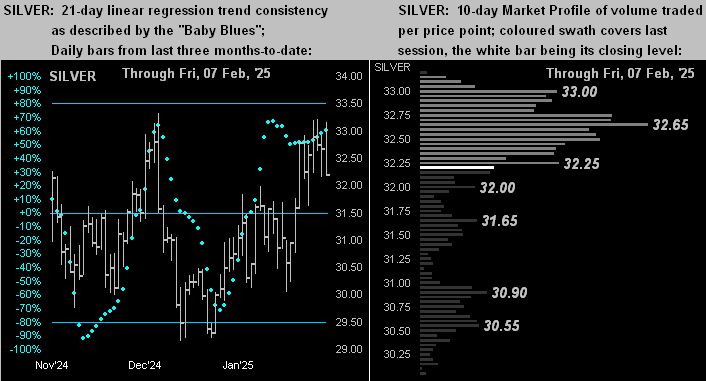
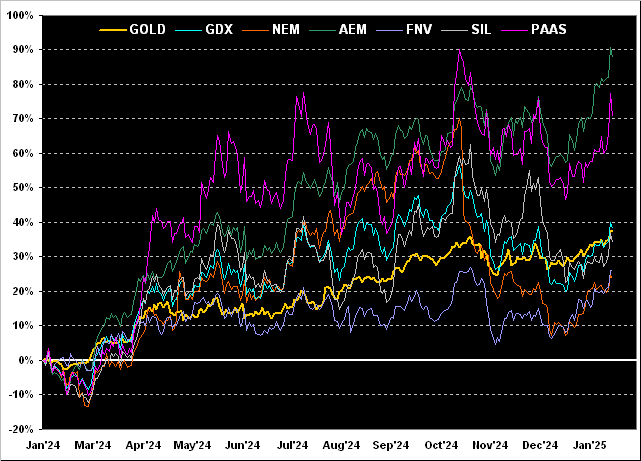
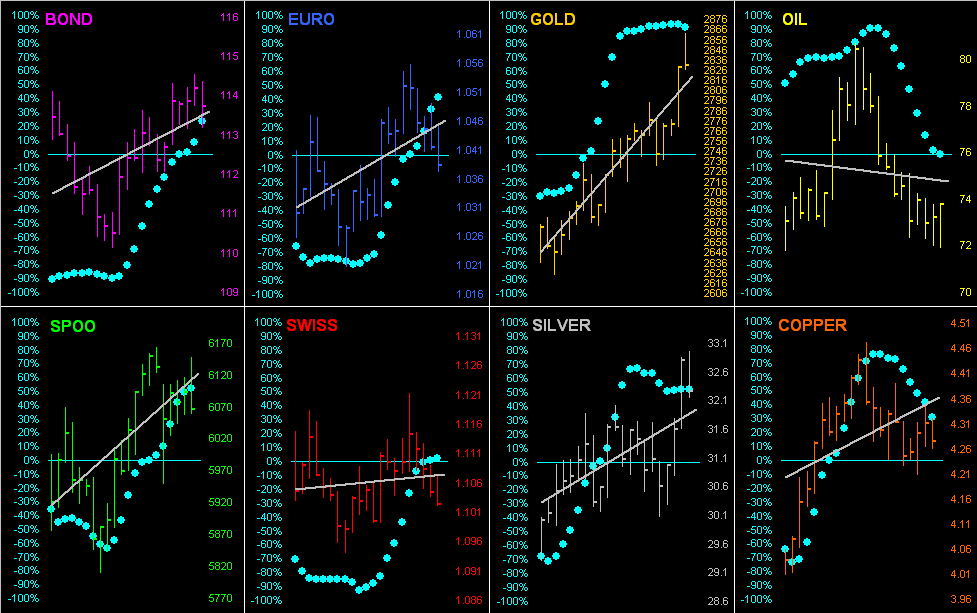
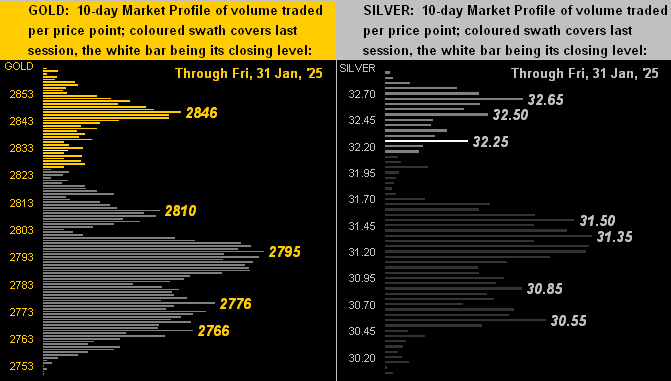
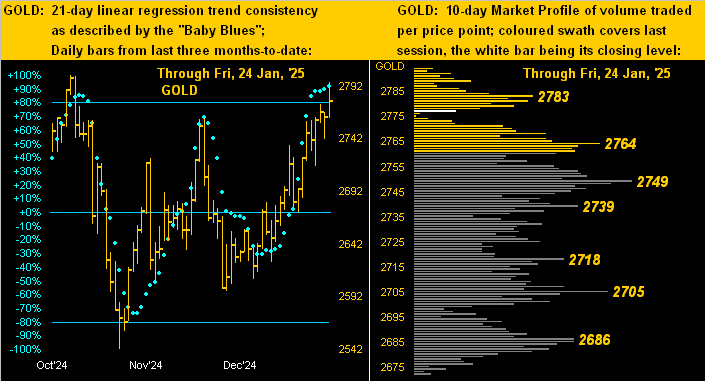
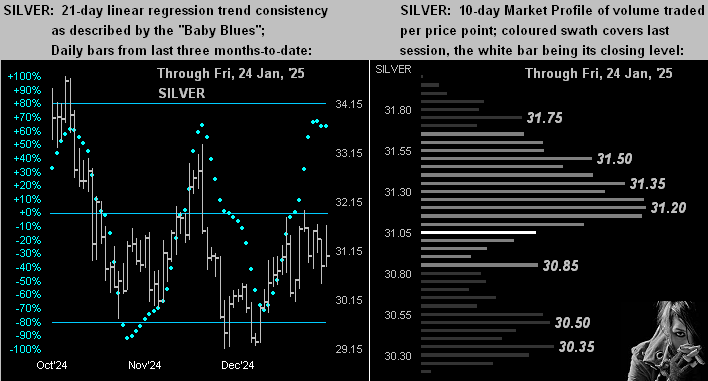
Yet, ’twas a so-called “inside week” for the yellow metal, meaning Gold printed both a higher-low but lower-high than in the week prior. ‘Tis depicted below in the left hand panel wherein the outermost green and red horizontal lines are the prior week’s range and the innermost two this past week’s range, the diagonal slants showing the difference. Still, in spite of it all, Gold’s “Baby Blues” of trend consistency continued to fall, paired here with the S&P’s folderol and Silver’s attempting a grip on the ball:
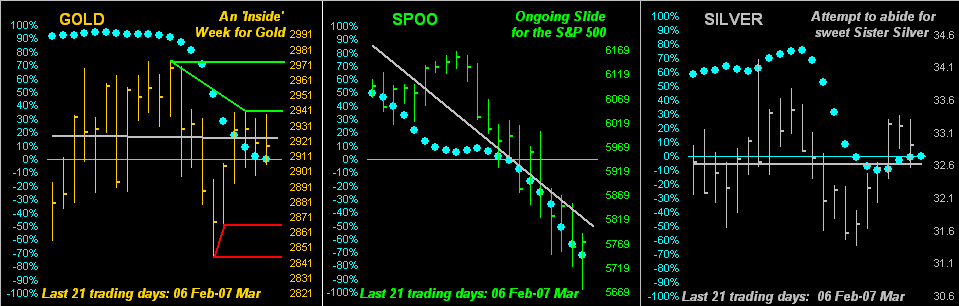
“But mmb, that’s more than just S&P folderol ’cause it’s down -6% from its high!”
We’ve on occasion been queried if Squire is paid for such “teeing-up” comments. (Rather, for the privilege of his presence on this page, he pays us).
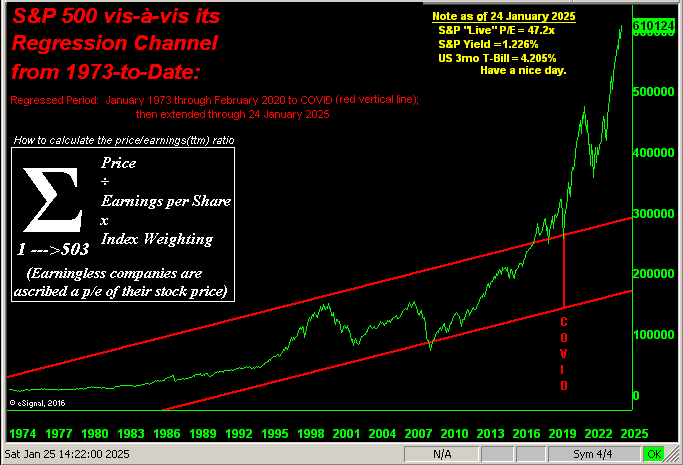
But to the point, yes, the S&P 500 (now 5770) has lost -6% of its value from the all-time high (6147) of just 13 trading days ago (19 February). Yet from our purview ’tis “nuthin’ but noise” given the mighty Index today is +765% above its FinCrisis low of 667 (06 March 2009) as well as +163% over the COVID low of 2192 (23 March 2020). Thus for you WestPalmBeachers down there, the S&P’s -6% pullback is a statistical irrelevancy. And as our regular readers know all too well, relevancy shall have returned upon the S&P’s price/earnings ratio (the “live” reading now 41.0x) having reverted to its reasonable mean in the low 20s, (which always has occurred — either up or down — since the S&P 500’s inception 68 years ago in March 1957) And in turn, the otherwise ongoing Investing Age of Stoopid shall have been eradicated. (Nevertheless, we’ve more on the FinMedia “Panic!” toward today’s wrap).
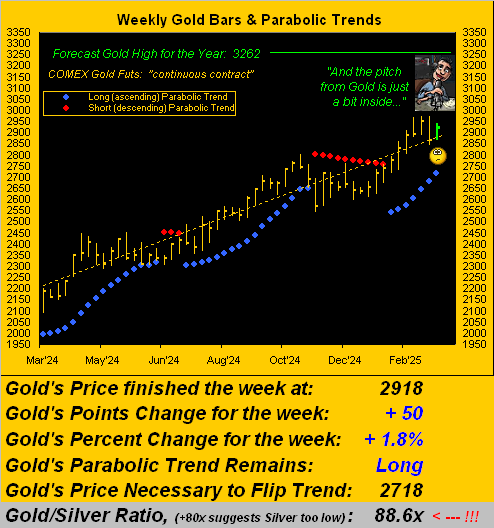
As to Gold’s ten trading weeks year-to-date, this past one (the rightmost green bar) is the first to be characterized as “inside”. Again, the inference as Gold continues to work off its extreme overbought condition is price having benefitted from geo-political and tariff trepidation; hence this past week’s buoyancy:
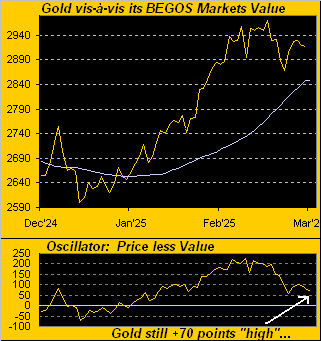
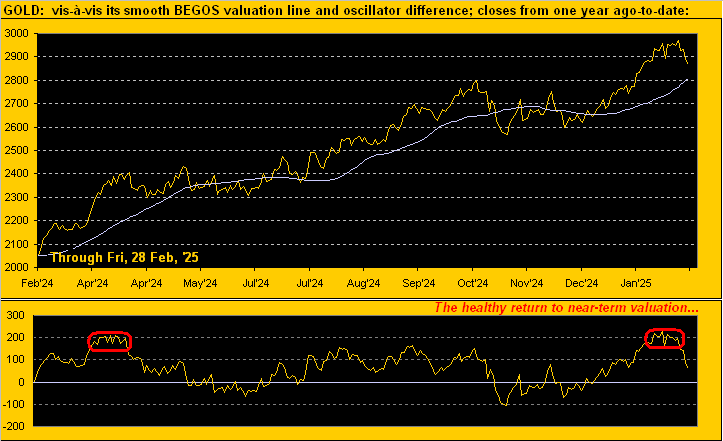
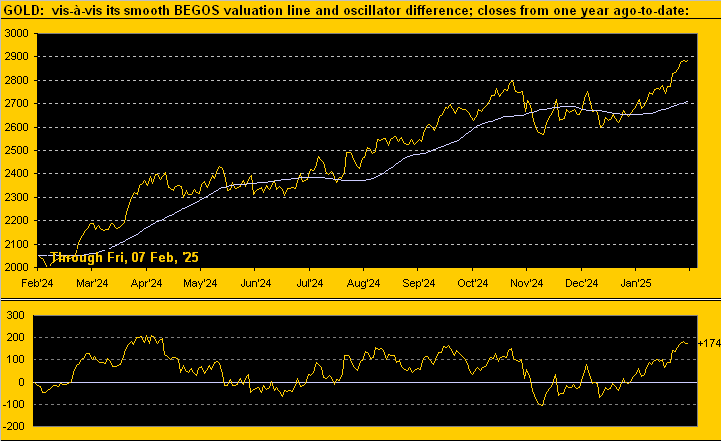
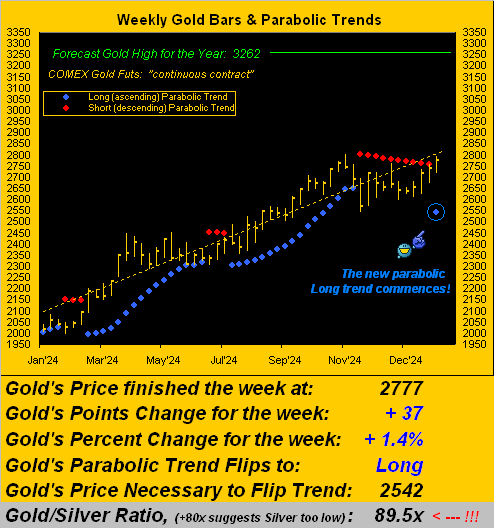
To be sure, Gold’s blue-dotted weekly parabolic remains safely Long. However, by our BEGOS Markets Values measure (in placing a near-term value on Gold per its movements relative to those of the four other primary BEGOS components, i.e. the Bond, Euro, Oil and S&P 500), price is still some +70 points “high” above its smooth grey valuation line; and of course, the two inevitibly shall eventually meet. Here they are from three months ago-to-date:
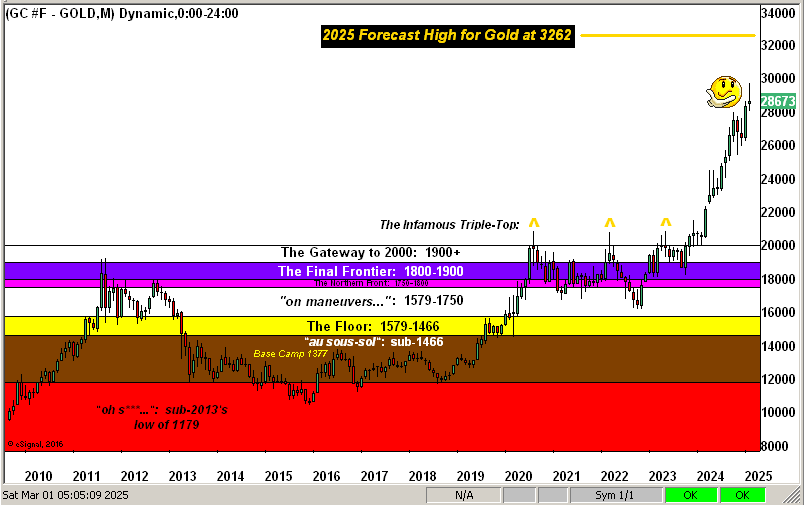
And again as you well know, we fully expect Golden Goal Two of “milestone” 3000 to trade this year, and further our forecast high for Golden Goal Three of 3262. Yet as the “Not in a Straight Line Dept.” reminds us, we see the route thereto traveling through the 2703-2641 zone, just in case you’re scoring at home.
‘Course, how lovely ‘twould be to be wrong and instead see Gold proceed from here at 2918 right up the road to the opening Scoreboard’s Dollar debasement value of 3798. Highly unlikely anytime soon, although in responding at a gathering this past week to the query “Is Gold now going to 10,000?” we said “No, and likely somewhat lower near-term, yet 4,000 perhaps is possible in two years or so…”
But obviously the bogeyman in the room is inflation — which most broadly is a Gold positive — but intermediately a threat to price should the Federal Open Market Committee resort to raising rates. The good news there, however, is both retail and wholesale inflation by consensii are expected to have somewhat slowed their February paces from those for January. Next Wednesday (the Consumer Price Index) and Thursday (the Producer Price Index) shall tell the tale.
Indeed let’s segue to the Economic Barometer which took a bit of a boffing during the week. Of the 15 incoming metrics, only five improved period-over-period. Most impressive were January’s Factory Orders which increased from December, that month’s decrease being favourably revised, and which beat consensus. But the stinker was the backup in January’s Wholesale Inventories, which accumulated over those for December, that month’s depletion revised to a slower pace, and were a bit more bloated than consensus. Too came the not so rare dichotomy of February’s Payrolls taking a rather severe hit per ADP, but by the Bureau of Labor Statistics actually increased. “What’s your source?” Here’s the Baro:
Toward closing, in light of the S&P 500 (which year-to-date is now down -1.9%, “OMG!”) having just recorded its weakest week (-3.1%) of the ten thus far this year, as we earlier teased, let’s check in with a few of Friday’s “FinMedia Freakout” finales:
Bloomy: “Wall Street’s Big Selloff Puts Pressure on America’s Rich Households” Lovin’ this one, for how many times have we written: “Marked-to-market everyone’s a millionaire; marked-to-reality nobody’s worth squat”;
DJNw: “Most Americans can’t afford life anymore…” So is DJNw’s assumption here the alternative? That’s a bummer.
CNBS: “The oversold stocks due for a technical bounce after a brutal week.” Truly ’tis dumbing down of the word “brutal”; we’ve haven’t had “brutal” since March 2020; and from 2008 into 2009, we regularly ate “brutal” for breakfast. So what leads to “brutal”? The aforenoted “live” S&P P/E of 41.0x.
“So then is the S&P about to crash, mmb?”
Obviously no one knows, Squire. What will eventuate over time is the reversion of the S&P’s P/E to a level of normalcy, as earlier cited in the low 20s via: 1) a doubling in earnings without the stock market rising, or 2) a 40%-50% stock market “correction”, or 3) a![]() “Combination of the Two”
“Combination of the Two”![]() –[Big Brother and the Holding Company, ’68]
–[Big Brother and the Holding Company, ’68]
Either way, we wrap with a wry note: per this penning, there remain two full weeks of winter. Yet for some reason of absurdity, StateSide folks early tomorrow move their clocks to summer hours. What that means for The Gold Update is — by adhering to its time-honoured traditional uploading each Saturday at 11:00 PacCoastTime — ’twill be an hour earlier here EuroSide at 19:00 for our next three editions (15, 22 and 29 March) until we then nudge our clocks forward come 30 March.
And specific to next week’s piece, beware the Ides of March, for it brings our 800th consecutive Saturday edition of The Gold Update…
He had Gold … do you? Currency then … Currency NOW!
Cheers!
…m…
www.TheGoldUpdate.com
www.deMeadville.com
and now on “X”: @deMeadvillePro
07 March 2025 – 08:40 Central Euro Time
StateSide ’tis February’s Payrolls day for the Econ Baro (and late in the session January’s Consumer Credit). At present we’ve the Bond, Euro, Swiss Franc and Oil all above their respective Neutral Zones for today; volatility for the BEGOS Markets is light. The S&P 500 remains “textbook oversold” such that a so-called “dead cat bounce” may be warranted; however the Index’s broader technical picture is facing a negative crossover on the monthly MACD that seemingly can confirm into April; given the unsustainably high “live” P/E of 40.4x, the S&P ought deservingly suffer rough sledding at least over the near-to-medium term, especially with the short-term U.S. Treasuries yielding better than triple that of the S&P (4.197% vs. 1.343%). ‘Tis to worthy to note that from the S&P’s March 2009 low, the Index has increased by as much as 822%: thus this 7% pullback is essentially noise; indeed were it not for COVID and the monetary creation thereto, the S&P today (5739) would instead be ’round 3000.
06 March 2025 – 08:44 Central Euro Time
Presently we’ve the Bond below its Neutral Zone for today, whilst Oil is above same; the BEGOS Markets’ volatility for this time has calmed to mostly light. Amongst the five primary BEGOS components, we’ve now a positive correlation between the Euro and Gold, which makes sense give the Dollar’s demise notably this week. Copper’s +4.9% net gain yesterday was the largest since 04 November 2022: at Market Trends, Copper’s rally was sufficient to stall the otherwise falling “Baby Blues” of trend consistency. Meanwhile, that measure for the Spoo continues to drop, albeit the S&P 500 itself is now seven days “textbook oversold”; still, the “live” P/E of the S&P (futs-adj’d) is a horribly high 43.1x. Today’s incoming metrics for the Econ Baro include January’s Trade Deficit and Wholesale Inventories, plus the revisions to Q4’s Productivity and Unit Labor Costs.
05 March 2025 – 08:38 Central Euro Time
The Euro, Silver and Copper are all at present above today’s Neutral Zones; the other five BEGOS Markets are within same, and session volatility is moderate-to-robust, Copper notably having traced 170% of its EDTR (see Market Ranges). As has oft been the case of late, we’ve no notable correlations amongst the five primary BEGOS components. In looking at Market Rhythms for pure swing consistency, our 10-test basis cites the Swiss Franc’s 1hr Parabolics as best, whilst on a 24-test basis we show both the non-BEGOS Yen’s daily Parabolics and the Euro’s daily MACD. The Dollar Index has thus far traded today down to its lowest level (105.280) since 11 November, Gold getting a bit of a bid in the balance, albeit to the extent ’tis geo-politically driven, we look for Gold to resume working lower (as detailed in the current edition of The Gold Update). The Econ Baro awaits February’s ADP Employment data and ISM(Svc) Index, plus January’s Factory Orders. Then late in the session brings the Fed’s Tan Tome.
04 March 2025 – 08:41 Central Euro Time
Both the Bond and Swiss Franc are at present above today’s Neutral Zones, whilst below same are Copper and Oil; session volatility for the BEGOS Market’s is moderate, (which you may be noting is the case ’round this time more frequently of late). Yesterday’s whirl back down in the S&P 500 ought not be too much of an eyeopener given the Spoo’s 21-day linreg trend having last week rotated from positive to negative, as presently is the stance as well for both Silver and of course Oil over recent weeks; by Market Trends, those for the other five BEGOS components are positive; however Gold’s “Baby Blues” of trend consistency are in freefall as are those for Copper. Too for the S&P per our Moneyflow page, all three time bases (weekly, monthly, quarterly) point to still lower levels ahead for the Index. Nothing is due today for the Econ Baro with then 13 incoming metrics remaining from tomorrow through the week’s balance.
03 March 2025 – 08:29 Central Euro Time
At present the Bond is below its Neutral Zone for today, whilst above same is the Euro; the BEGOS Markets’ volatility is mostly moderate. The Gold Update cites the anticipated fall having commenced for the yellow metal; as written: “…should the present selling become more substantive … ‘twould be reasonable to find price reach down into the 2703-2641 zone…” By Market Values, Gold — after having been better than +200 points “high” above its some valuation line — is now +56 points “high”. Notably too by that same metric, the Bond remains nearly +4 points “high”, the Euro basically in line, Oil -4.55 points “low” and the Spoo -104 points “low”. Despite the S&P 500’s +1.6% Friday rally, the Index is actually mildly “textbook oversold”; more meaningfully however, the overall weak level of earnings doesn’t support the “live” P/E of 44.0x. Q4 Earnings Season is complete with 69% of the S&P’s constituents bettering their bottom lines from Q4 a year ago, an above-average showing over 66% for the past eight years. The Econ Baro begins its week of 15 incoming metrics with February’s ISM(Mfg) Index and January’s Construction Spending.
The Gold Update: No. 798 – (01 March 2025) – “Thank Goodness Gold Finally Falls”

‘Course contra to our wary stance — courtesy of the FinMedia — emerged the “Suddenly Everybody’s a Gold Expert Dept.” proclaiming the price of 3000 being imminent. And thus it did not happen, oft normal in such market-amateur hysterias.
Rightly instead, Gold as anticipated whirled ’round down to record its third worst week in better than a year, this time dropping -2.8% (-82 points) in settling yesterday at 2867. Or to put it to music, we cue the Swiss rock band Gotthard from their ’07 song “The Call”: ![]() “The higher they fly, the harder they fall…”
“The higher they fly, the harder they fall…”![]()
“And, mmb, that really applies now to the stock market, eh?”
Frighteningly so, Squire. Indeed to quote George Kennedy in “The Eiger Sanction” (Universal, ’75): “They won’t even know it’s coming until it hits.” Or as a valued charter reader of The Gold Update has on occasion queried: “Does it really matter which snowflake causes the avalanche?”
Then this past Thursday (per our daily Prescient Commentary) came Gold’s “Baby Blues” of trend consistency at long last breaking down below their +80% axis (as we’ll later see), which is key in having generated this signal in the end-of-day work spree:
“The obvious question then is, mmb?”
Squire, “How low is low?” Thus here we go: should the present selling become more substantive from the current 2867 level, ‘twould be reasonable to find price reach down into the 2703-2641 zone. To be sure: we still expect Golden Goal Two of “milestone” 3000 to eventually trade, directly or indirectly en route to Golden Goal Three of 3262 as our forecast high for this year. But as we’ve herein reminded since New Year (Gold then 2639), the road to 3262 can quite fairly pass through the lower 2500s. Is that to where this down run is heading? Nobody knows. But ’tis better to get the year’s low place before the high.
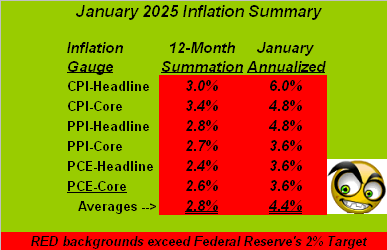
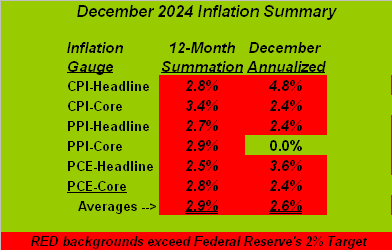
And as we been emphasizing, a wayward wrench dropped into the Gold works is inflation. Recall our title from two missives ago included the phrase “Fed’s Next Hike”. Apparently “hike” is not an allowable utterance at large. Rather, press musings oscillate between “cut” and “pause”, with a lean of late toward the latter. This results from their not implementing math. Most notably came yesterday’s “Fed-favoured” inflation report for January’s Personal Consumption Expenditures. The headline number — rather than easing — remained steady at +0.3% whilst the core number’s pace increased from +0.2% to +0.3%. Here thus is our inflation summary for January:


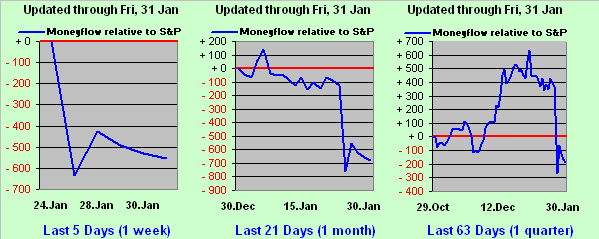
As for yesterday’s S&P 500 big post-White House brawl rally, we eye it as a “dead cat bounce” given the significant deterioration of late in the Index’s Moneyflow regressed into S&P points. By the website’s S&P Moneyflow page, the Index per this leading indicator “ought be” some 180-to-230 points lower than currently ’tis (5955). Still, a tip of the cap to just concluded Q4 Earnings Season: therein, 454 S&P 500 constituents reported, 69% of them bettering their bottom lines from a year ago, which across the past 31 reporting quarters has averaged 66%. But as we point out ad nauseam, the overall level of earnings remains terribly weak given the price of the Index, the “live” price/earnings ratio of the S&P now 43.3x. So stay suspect when it comes to stocks.
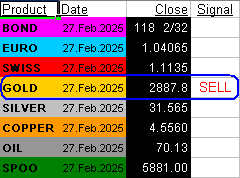
Not suspect a wit (per the “SELL” in the table earlier displayed) is the inevitable cascade in Gold’s “Baby Blues”, the red-encircled dot below confirming such signal. So as is our month-end wont, here we go ’round the horn for all eight BEGOS components across the past 21 trading days (one month). And you know the jingle: ![]() “Follow the blues, instead of the news, else lose yer shoes”
“Follow the blues, instead of the news, else lose yer shoes”![]() :
:
So thus far for 2025 we’ve two months down (both net-net up for Gold) and ten to go. As noted, in the year’s balance remain Golden Goal Two of “milestone” 3000 and our projected Golden Goal Three of 3262 for the high. Yet ahead of such ascent we’ve this current descent, for which as stated we are thankful given major markets are not unidirectional. However, one thing to watch is a stirring of geo-political jitters which as you regular readers know can quickly send Gold higher — but generally just briefly — before returning down from whence it came. Either way, in the words of The Gold Update’s first ever reader away back in 2009 (JGS): “We’ll watch it together.”
So be a cool cat and stay with your Gold!

28 February 2025 – 08:42 Central Euro Time
Gold’s “Baby Blues” (see Market Trends) confirmed falling below their key +80% axis, indicative of still lower prices; more tomorrow in the 798th consecutive Saturday edition of The Gold Update. Along with the yellow metal at present, Copper, Oil and the Swiss Franc are all below today’s Neutral Zones; above same is the Bond, and BEGOS Markets’ volatility is firmly moderate. The Moneyflow of the S&P 500 continues to be weaker than the down move in the Index itself: yesterday’s change in the S&P was -1.6%, however the Money suggested a change of -3.1%: as this is a leading indicator, we look for further selling in the S&P; mind our S&P Moneyflow page. ‘Tis the final day of Q4 Earnings Season. And the Econ Baro wraps its week, indeed the month, with February’s Chi PMI plus January’s Personal Income/Spending and “Fed-favoured” Core PCE.
27 February 2025 – 08:45 Central Euro Time
Both the Swiss Franc and Gold are below today’s Neutral Zones; the other six BEGOS Markets are within same, and volatility is again moderate, although like yesterday ’round this time, Oil has traced but 18% of its EDTR (see Market Ranges). At Market Trends, Gold’s “Baby Blues” of trend consistency are provisionally (in real-time) dropping below their key +80% axis, indicative (upon confirmation) of lower prices near-term: recent missives of The Gold Update have been anticipative of a run down; looking at Market Values in real-time, Gold is +107 points “high” above its smooth valuation line. By that metric for the other four primary BEGOS components: the Bond shows as nearly +4 points “high”, the Euro as essentially in line, Oil as -6.25 points “low” and the Spoo now as -76 points “low”. The week’s selling in the S&P 500 has actually pushed it down into “textbook oversold” territory, however the Index remains dangerously high by its “live” (futs-adj’d) P/E of 44.6x. Included in today’s incoming metrics for the Econ Baro are January’s Durable Orders and Pending Home Sales, plus the first revision to Q4 GDP.
26 February 2025 – 08:40 Central Euro Time
The Bond and the EuroCurrencies are at present below their respective Neutral Zones for today; the balance of the BEGOS Markets are within same, and volatility is moderate, save for Oil which has traced just 15% of its EDTR (see Market Ranges). For the S&P 500, similar to that from Monday, on Tuesday whilst the Index fell -0.5%, the Moneyflow was instead suggestive of a -1.6% fall, again indicative of further selling still to come (see our S&P Moneyflow page). The Spoo’s 21-day linreg trend confirmed rotating to negative, the “Baby Blues” of trend consistency now having moved below their 0% axis (see Market Trends); should the selling turn more substantive, we’d look in due course for the S&P 5400s. The Bond’s cac volume is rolling from March into June, whilst that for Silver from March into May. And the Econ Baro awaits January’s New Home Sales.
25 February 2025 – 08:35 Central Euro Time
The Bond is above its Neutral Zone for today, whilst below same are Gold and Copper; session volatility for the BEGOS Markets is light. As anticipated, in real-time the Spoo’s 21-day linreg trend line has rotated to negative (see Market Trends) as has been that for Oil for the past few weeks; such trend for the other six BEGOS components is positive, albeit with weakening “Baby Blues” (which depict trend consistency) in decline for the Bond and all three elements of the Metals Triumvirate. The MoneyFlow of the S&P 500 was notably more negative yesterday (-1.2%) than that of the Index itself (-0.5%), suggestive of lower price levels near-term. The Econ Baro looks to February’s Consumer Confidence.
24 February 2025 – 08:41 Central Euro Time
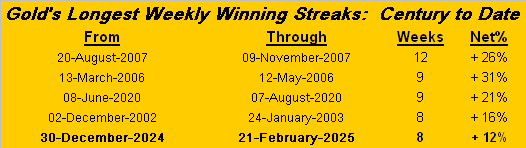
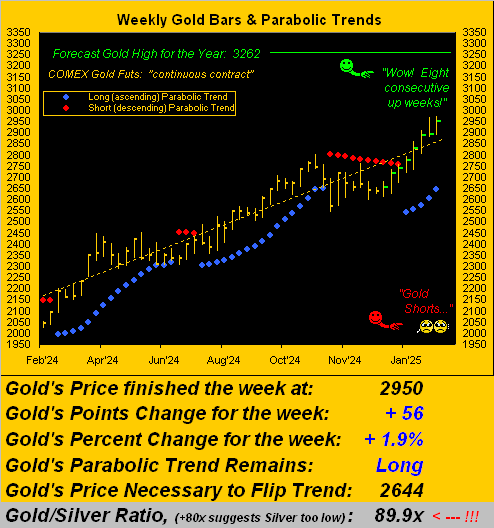
Into the new week we’ve presently both the Euro and Spoo above today’s Neutral Zones; none of the other BEGOS Markets are below same, and volatility is mostly moderate. The Gold Update (as was the case a week ago) gives a near-term bearish bias strictly by technicals and the deMeadville proprietary measures (see Gold under BEGOS Markets): an affective metric this week shall be Friday’s release of PCE inflation data; either way, Gold completed an eighth consecutive up week for just the fifth time (mutually-exclusive basis) this century and currently priced at 2954 is -46 points below “Golden Goal Two” of “milestone 3000”. Nothing is due today for the Econ Baro. And, barring laggards, this is the final week of Q4 Earnings Season: with 402 S&P 500 constituents thus far having reported, 69% have improved their bottom lines from Q4 of 2023, a somewhat better-than-average improvement pace; problematic remains the extreme 45.2x P/E ratio.
The Gold Update: No. 797 – (22 February 2025) – “Gold Higher Every Week Year-to-Date”
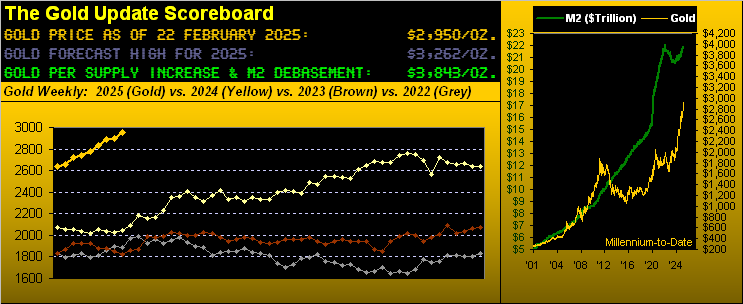
Speaking of scoring, to wrap, the U.S. Treasury (as you’ve no doubt read) presently “scores” the United States Bullion Depository supply of Gold at $42/oz. Therein said facility — just on the outskirts of Fort Knox, Kentucky — is “officially” (in round numbers) some 147,300,000 ounces of Gold according to “AI” (“Assembled Inaccuracy”), for an accounting value of $6,174,000,000. That is how much the U.S. Federal Government spends about every 10 hours. (Do the math if you must, starting with the annual spend of $6,740,000,000,000). Makes ya feel kinda small, what? However: marked-to-market at $2950/oz. puts the value — were it all liquidated at that price — to a supply total of $433,650,000,000 which essentially would run the federal government for one month. That’s it.
Au contraire Auric. Even if near-term the yellow metal gets sold, you can buy a lot of mint juleps with an ounce of Gold!
Cheers!
…m…
www.TheGoldUpdate.com
www.deMeadville.com
and now on “X”: @deMeadvillePro
21 February 2025 – 08:35 Central Euro Time
Copper is the sole BEGOS Market at present outside (below) its Neutral range for today; however, session volatility is pushing toward moderate. Gold indeed made another marginal All-Time High yesterday in reaching 2973 (from the prior 2968); as you well know, the yellow metal — whilst still significantly undervalued vis-à-vis Dollar debasement — is extremely near-term overbought: more in tomorrow’s 797th consecutive Saturday edition of The Gold Update. The Spoo’s EDTR (see Market Ranges) has been narrowing since a recent peak at 93 points on 07 January: through yesterday, ’tis now 64 points; again, we’re minding the Spoo’s 21-day linreg trend (see Market Trends) for its rotating from positive to negative. The Econ Baro wraps its week with metrics which include January’s Existing Home Sales.
20 February 2025 – 08:31 Central Euro Time
The Swiss Franc, Gold and Silver are all at present above their respective Neutral Zones for today; none of the other BEGOS Markets are below same, and volatility is light, (save for the non-BEGOS Yen which has traced 103% of its EDTR, which for the BEGOS components can be seen at Market Ranges). Correlations amongst the five primary BEGOS components have been messy of late with no notably directional pairings therein. Gold appears poised to set another All-Time High (above 2968) as the day unfolds: the high thus far this session is 2967. The S&P 500 is entering its 21st consecutive trading day as “textbook overbought”; the Spoo’s “Baby Blues” look to slip into negative territory within the next few sessions as the linreg trend rotates to negative, (barring a firm rally). And amongst the metrics due for the Econ Baro are February’s Philly Fed Index and January’s Leading (i.e. “lagging” given the Baro) Indicators.
19 February 2025 – 08:33 Central Euro Time
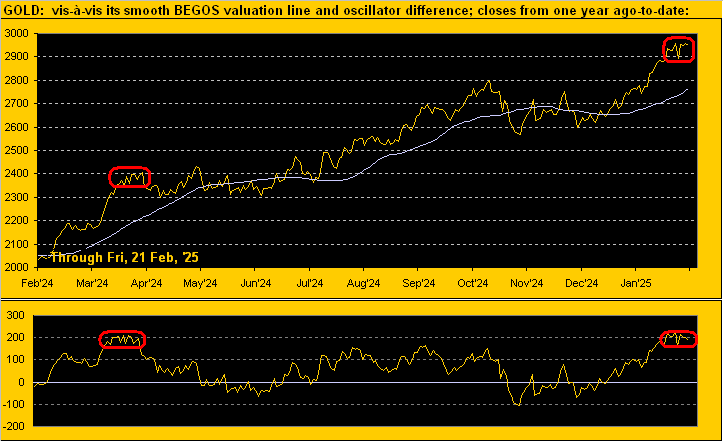
At present, only Oil is outside (above) today’s Neutral Zone; session volatility for the BEGOS Markets is quite light. Looking at Market Rhythms for pure swing consistency, on a 10-test basis the best currently are the Bond’s daily Moneyflow, Copper’s 30mn Price Oscillator as well as the red metal’s 2hr Parabolics; on a 24-test basis our leaders are (as oft has been the case) the non-BEGOS Yen’s daily Price Oscillator and daily Parabolics, plus the Euro’s 4hr MACD. The flow into Gold is being maintained, price (2950) in real-time +203 points above its smooth valuation line; today marks the 22nd consecutive trading session for Gold with its “Baby Blues” (see Market Trends) above their key +80%, a stretch which for any BEGOS Market is remarkable. The Econ Baro looks to January’s Housing Starts/Permits; and late in the session come the Minutes from the FOMC’s 28/29 meeting.
18 February 2025 – 08:48 Central Euro Time
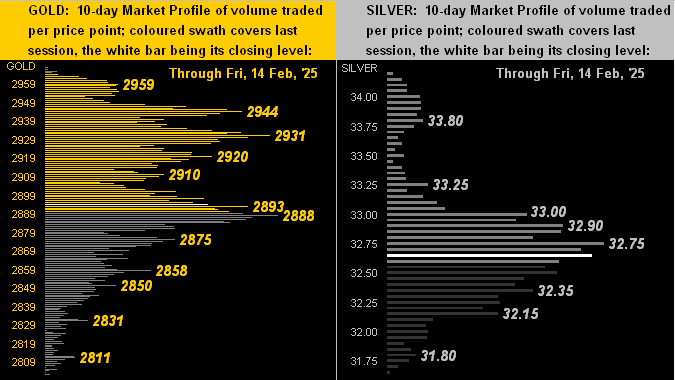
Into the session’s second day, as expected the BEGOS Markets have increased their range traveled: at present below their Neutral Zones are the Bond, Euro, Swiss Franc and Copper, whilst above same are Gold, Silver, Oil and the Spoo, with overall volatility firmly moderate, leaning toward robust as the day develops. Were the S&P 500 to open at this instant, ‘twould be at an all-time high of 6140 (vs. the actual-to-date of 6128). Going ’round the Market Values horn for the five primary BEGOS components (in real-time), we show both the Bond and Euro as nearly on their smooth valuation lines, Gold as +185 points “high” above same, Oil -4.35 points “low” and the Spoo as +94 points “high”. With Gold at 2925, the volume-dominant overhead Market Profile resistors are 2931 and 2944. The Econ Baro awaits February’s NY Empire State and NAHB Housing Indices.
17 February 2025 – 08:42 Central Euro Time
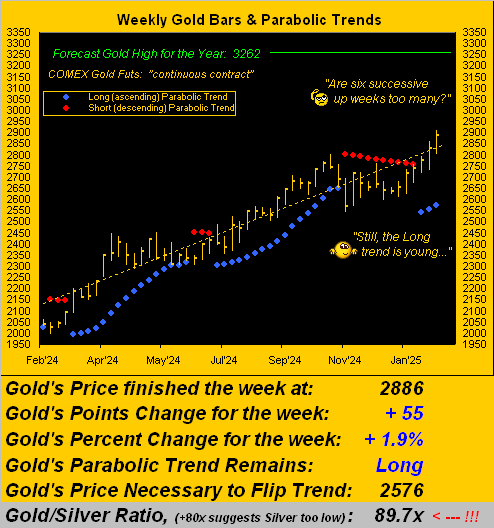
The BEGOS Markets begin the week with a two-day session (for Tuesday settlement); at present, we’ve the Bond below today’s Neutral Zone, whilst above same is Gold; session volatility already is pushing toward moderate and likely by this time tomorrow shall be mostly robust. The Gold Update graphically depicts last week’s price spike to the new All-Time High of 2968; still, we are cautious of Gold’s near-term extensive stance, seven consecutive up weeks now recorded; price is “textbook overbought” for the last 25 trading days, and (in real-time) ’tis +171 points above it smooth valuation line (see Market Values). Too, the inflation scare has us once again musing of the Fed potentially having to revert to raising rates. To this point in Q4 Earnings Season, 361 S&P 500 constituents have reported, of which 70% have bettered their bottom lines from Q4 of 2024: again, that is an above-average rate of improvement, albeit the Index itself remains catastrophically high with the “live” (futs-adj’d) P/E at this instant 47.8x.
The Gold Update: No. 796 – (15 February 2025) – “Gold’s Price Spike; Fed’s Next Hike”
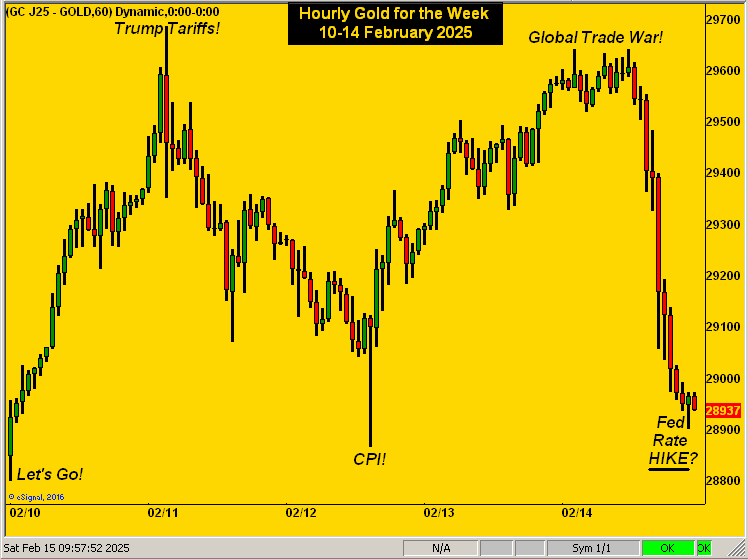
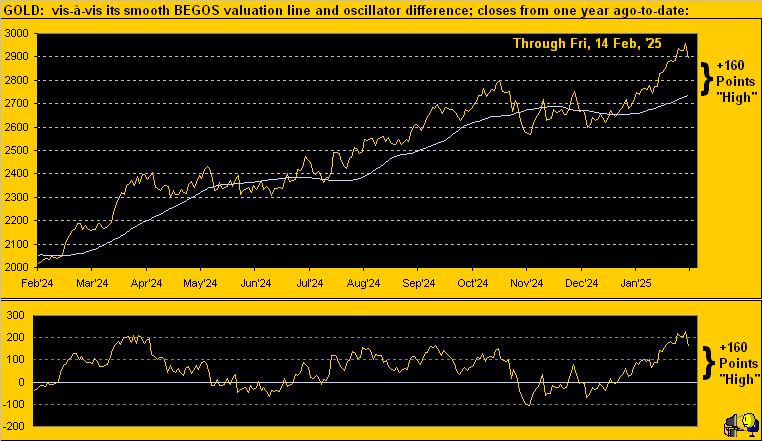

So if you are thinking that we are thinking “down” is Gold’s watchword for this ensuing week, yes we agree, albeit as aforementioned, price of late is being headline-driven. Still as we turn to the stack, Gold year-to-date is well in the black:
The Gold Stack
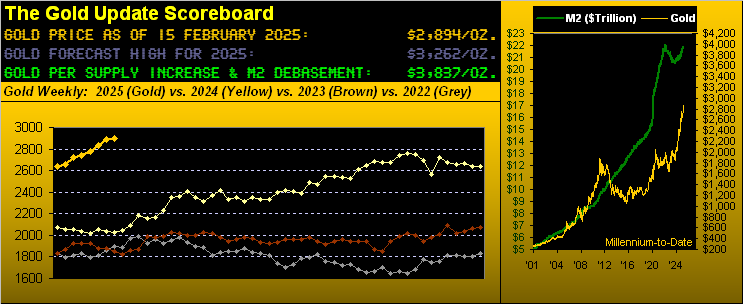
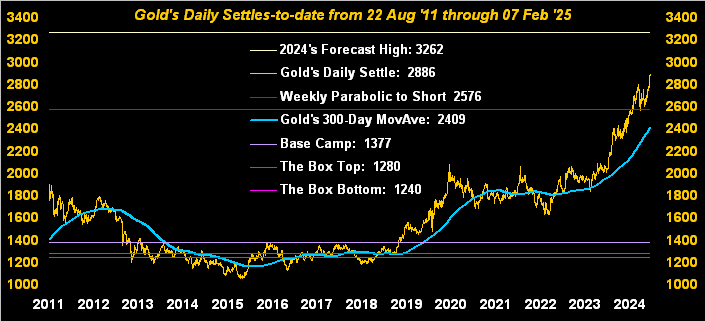
Gold’s Value per Dollar Debasement, (from our opening “Scoreboard”): 3837
Gold’s All-Time Intra-Day High: 2968 (11 February 2025)
2025’s High: 2968 (11 February)
10-Session directional range: up to 2968 (from 2802) = +166 points or +5.9%
Gold’s All-Time Closing High: 2957 (13 February 2025)
Trading Resistance: notable overhead Profile nodes 2931 and 2944
10-Session “volume-weighted” average price magnet: 2903
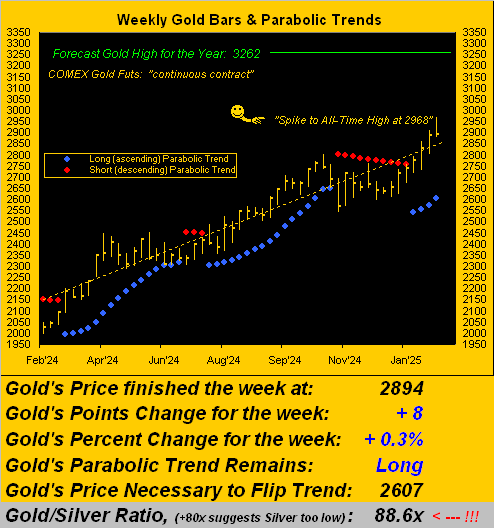
Gold Currently: 2894, (expected daily trading range [“EDTR”]: 34 points)
Trading Support: most notably 2888, then 2875
2025’s Low: 2625 (06 January)
The Weekly Parabolic Price to flip Short: 2607
The 300-Day Moving Average: 2424 and rising
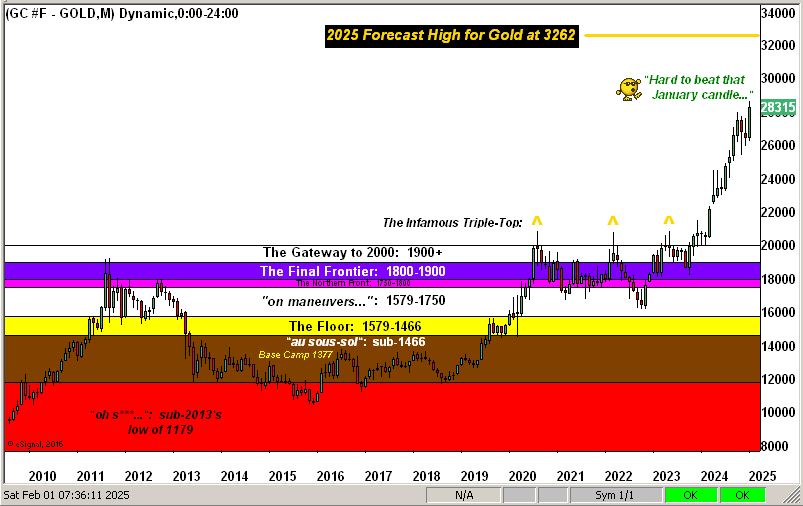
The 2000’s Triple-Top: 2089 (07 Aug ’20); 2079 (08 Mar’22); 2085 (04 May ’23)
The Gateway to 2000: 1900+
The Final Frontier: 1800-1900
The Northern Front: 1800-1750
On Maneuvers: 1750-1579
The Floor: 1579-1466
Le Sous-sol: Sub-1466
The Support Shelf: 1454-1434
Base Camp: 1377
The 1360s Double-Top: 1369 in Apr ’18 preceded by 1362 in Sep ’17
Neverland: The Whiny 1290s
The Box: 1280-1240
Next week brings just a moderate dose of data for the Econ Baro, notable of which come Thursday (20 February) is the Conference Board’s Leading Indicators for January. Again for regular readers, you know our penchant for referring to such metric as “lagging” given the Baro has already told the tale. Thus the consensus for a flat January — or maybe +0.1% at best — makes sense.
Just ensure your Gold and Silver portfolio shares are many percent!
Cheers!
…m…
www.TheGoldUpdate.com
www.deMeadville.com
and now on “X”: @deMeadvillePro
14 February 2025 – 08:25 Central Euro Time
We’ve both Silver and Copper at present above today’s Neutral Zones; the balance of the BEGOS Markets are within same, and volatility is mostly light, save for Silver which already has traced 110% of its EDTR (see Market ranges). Barring January being an outlier, the pace of inflation is increasing away for the Fed’s +2.0% preference; more tomorrow in the 796th consecutive Saturday edition of The Gold Update; to that end, Gold thus far today has traded up to 2064, just 4 points shy of its 2068 All-Time High achieved this past Tuesday; as a caution, Gold in real-time is +226 points “high” above its smooth valuation line (see Market Values). Too in real-time, Oil’s “Baby Blues” have provisionally moved above their -80%; as previously noted, confirmation of that condition typical brings higher prices near-term. And ’tis a busy day to end the week for the Econ Baro, scheduled metrics being January’s Retail Sales, Ex/Im Prices and IndProd/CapUtil, plus December’s Business Inventories.
13 February 2025 – 08:25 Central Euro Time
The Euro, Swiss Franc, Gold and Copper are all at present above today’s Neutral Zones; none of the other BEGOS Markets are below same, and volatility is mostly moderate. The Bond’s “Baby Blues” (see Market Trends) confirmed settling below their +80% axis: price already has moved lower into structural support of the 113s; were that to crack, a re-test of January’s lows in the 110s would be in order, especially should inflation be re-accelerating. By that same study, Oil’s “Baby Blues” are mildly curling back upward (-81% in real-time): a settle above -80% would suggest higher price levels; too, Oil’s cac volume is rolling from March into April. And the Econ Baro awaits January’s wholesale inflation data via January’s PPI.
12 February 2025 – 08:35 Central Euro Time
At present, all eight BEGOS Markets are within their respective Neutral Zones for today, and session volatility is light with January’s retail inflation metrics in the balance. Going ’round the Market Rhythms horn for pure swing consistency, currently the leaders (on a 10-test basis) are the Bond’s daily Moneyflow, the Euro’s 30mn Parabolics, Copper’s 15mn Price Oscillator, and the non-BEGOS Yen’s daily Parabolics; too, (on a 24-test basis) is again the Yen’s daily Parabolics as well as its daily Price Oscillator, plus the Euro’s 4hr MACD. And at Market Trends, despite the Spoo’s being in a 21-day linreg uptrend, its “Baby Blues” of the trend consistency are dropping for the fourth consecutive session. As noted, the Econ Baro awaits January’s CPI, plus (purportedly) late in the session the Treasury’s Budget. And per Humphrey-Hawkins, FedChair Powell, having testified yesterday before The Senate, concludes today with The House.
11 February 2025 – 08:47 Central Euro Time
Both Silver and Copper are at present below today’s Neutral Zones; the six other BEGOS Markets are within same, and session volatility is light-to-moderate. The S&P 500 is now “textbook overbought” through the past 14 consecutive trading days: there were significantly longer overbought stints during 2024, but ’tis something of which to be aware, especially given the “live” (futs-adj’d) P/E now at 48.8x and a yield of 1.243% less than a third of that for the 3mo US T-Bill of 4.228% annualized. At Market Trends we’re minding the Bond’s “Baby Blues” of trend consistency which are just starting to roll over to the downside with inflation data due both tomorrow and Thursday. And at Market Values the most extreme deviation is Gold’s being (in real-time) +216 points “high” above its smooth valuation line, pricing reaching another All-Time High earlier today at 2968. Again, ’tis a quiet session for the Econ Baro.
10 February 2025 – 08:34 Central Euro Time
The week starts finding at present the Swiss Franc below today’s Neutral Zone, whilst above same are both Gold and Silver; BEGOS Markets’ volatility is moderate. The Gold Update muses the 3000 level as within reasonable distance by month’s end, however cautions that price has risen for six consecutive weeks (which historically is a bit of an outlier); still, the weekly parabolic trend is Long and we maintain our forecast high for this year at 3262; more immediately, Gold (in real-time) is +200 points “high” above its smooth valuation line (see Market Values); too, price is quite stretched above its 300-day moving average, (nearly +20%). Q4 Earnings Season continues to run at an above average pace for S&P 500 constituents bettering their bottom lines from Q4 a year ago: 71% of the 286 reports thus far have so done; ‘course it remains very problematic that the overall level of S&P 500 earnings is too low to support the extremely high Index itself, (the “live” futs-adj’d P/E at this instant 48.4x). ‘Tis a back-loaded week for the Econ Baro with 13 metrics due beginning on Wednesday.
The Gold Update: No. 795 – (08 February 2025) – “Gold Teases 2900; to 3000 Unencumbered?”

So to sum it all up: Gold is having a fabulous run, that realistically shall become at least a bit undone given the reality which herein penned a week ago that “hardly are markets unidirectional”.
Yet so stated, per our title, is the tease at 2900 to in turn bring 3000 unencumbered? Such query puts us back in mind better than 20 years ago when (admittedly out of ignorance) we’d gawk at FinTV thinking we could be on the cutting edge of markets’ directions.
“Oh that was pretty ignorant, mmb…”
Squire, your affirmation of such is illustriously inspiring. But to our point: rumbling ’round the floor of the New Stock Stock Exchange in those days was one Arthur D. Cashin, Jr. And we’ve always remembered this quip from him: “Usually, if a stock gets to 90, it’s goin’ to 100.”
Thus by such theory you can see where we’re going with this: Gold having now reached 2900 means ’tis going to 3000, albeit by what we’ve herein noted today, perhaps not directly … but eventually. Because as aforementioned, Golden Goal Three for this year remains our forecast high for 3262!
Cheers!
…m…
www.TheGoldUpdate.com
www.deMeadville.com
and now on “X”: @deMeadvillePro
07 February 2025 – 08:45 Central Euro Time
As was the same situation ’round this time yesterday, the Swiss Franc is presently below its Neutral Zone whilst above same is Copper; session volatility for the BEGOS Markets is light. The futs-adj’d “live” P/E of the S&P 500 is 49.6x: ’twill be interesting to see if (i.e. “when”) 50x is reached, the Index as a whole remaining extraordinarily expensive if not outright dangerous. As it ought be a rangy day for the Spoo with January’s Payrolls due, key apices in the Market Profile are 6099, 6086, 6076, 6065, 6047 and 6025. Gold’s remarkable resilience continues: more on that in tomorrow’s 795th consecutive Saturday edition of The Gold Update. And for the Econ Baro in addition to the jobs data for January, we’ve also February’s UofM Sentiment Survey, and for December both Wholesale Inventories and Consumer Credit.
06 February 2025 – 08:39 Central Euro Time
The Swiss Franc is at present below its Neutral Zone for today, whilst above same is Copper; BEGOS Markets’ volatility is mostly light. Currently we find no compelling correlations amongst the five primary BEGOS components. Still, we can go ’round the horn by their Market Values as follows (in real-time): the Bond is 1^09 points “high” above its smooth valuation line (recall our year-end comment above a potential run up into the 116s, price currently 116^02); the Euro is -0.012 points “low”; Gold — which yesterday cleared the 2900 level for the first time — is +174 points “high” and in a sixth consecutive up week; Oil is -3.34 points “low”; and the Spoo is just +32 points “high”. Incoming metrics for the Econ Baro include Q4’s Productivity and Unit Labor Costs.
05 February 2025 – 08:40 Central Euro Time
We’ve at present the Euro, Swiss Franc and Gold above today’s Neutral Zones; below same is the Spoo, and BEGOS Markets’ volatility is mostly moderate. Looking at Market Ranges, most of the components’ EDTRs are around the mid-point of where they’ve been from a year ago at this time; those for Gold and the Euro are a bit above their mid-points. At Market Trends, all save for Oil are in 21-day linreg uptrends, including the Spoo even as it is struggling of late to stay upright. And for Market Rhythms on a pure swing basis for consistency, our top four (10-test basis) are currently the non-BEGOS Yen’s daily Parabolics (see too yesterday’s comment), the Bond’s daily Moneyflow, Gold’s 30mn Moneyflow, and the Spoo’s 2hr Parabolics. The Econ Baro awaits January’s ADP Employment data and ISM(Svc) Index, plus December’s Trade Deficit.
04 February 2025 – 08:32 Central Euro Time
For the second consecutive week the Spoo on Monday has gapped considerably lower, yet by week’s end (in this case just after this morning’s open) come all the way back up to “fill the gap”. Regardless, the Spoo is back on the skids, at present below its Neutral Zone for today, as too are the Euro, Swiss Franc and Gold; the other BEGOS Markets are within their respective Neutral Zones, and session volatility is moderate. The non-BEGOS Yen’s daily Parabolics flipped to Short effective today’s opening price (0.0064910); we mention this as ’tis been a leading study for pure swing consistency in our Market Rhythms going back better than a year. The Econ Baro looks to December’s Factory Orders.
03 February 2025 – 08:47 Central Euro Time
The Dollar is getting a very health bid, such that — save for the Bond (at present above today’s Neutral Zone) and Oil — the six other BEGOS Markets are in the red and all below said Neutral Zones; volatility is mostly robust. The Gold Update celebrates the yellow metal’s new All-Time High (furthered today up to 2862 basis the April cac) whilst again warning of the extreme overvaluation and fragility of the S&P 500; at this instant (per the Spoo and adjusting for Fair Value) were the stock market to open, the S&P would gap down -1.8% to 5931 from Friday’s 6041 settle. Our best Spoo Market Rhythm for pure swing consistency (10-test basis) is currently the 6hr MACD. And the Econ Baro commences its week with January’s ISM(Mfg) Index and December’s Construction Spending.
The Gold Update: No. 794 – (01 February 2025) – “Gold Achieves Golden Goal 1 of 3 – A Fresh All-Time High”


To wrap, as noted we’ve (yet another) cautionary note with respect to the S&P 500. The Index’s all-time closing high is 6119 as of just seven trading days ago on 23 January. But since the ensuing six trading days — including the “Daunt de DeepSeek” of Monday, 27 January (prior to which you’ll recall we’d last week penned “…the next … ‘correction’ … shall morph Wall Street emotion from ‘No Fear!’ into ‘Nuthin’ BUT Fear!’…”) — the S&P has lost a net -78 points to now sit at 6041 (en route having been down as many as -156 points to 5963 during that Monday’s quickie-crash). Moreover, (hat-tip Dow Jones Newswires), Deutsche Bank suggested such “…impact may see market deflate as in dot-com bust…” Yet it giddily then came all the way back to “fill the gap”. Oh is Wall Street — albeit now terribly fragile — ever so relieved that it didn’t all go wrong (yet).
But here’s the part for which they’ve not been informed (barring their following the website’s MoneyFlow page): the S&P’s net change from the all-time high to right now via the MoneyFlow regressed onto the S&P scale is -668 (“minus six-hundred sixty-eight”) points. In other words for those of you scoring at home: the S&P is now -78 points below its all-time closing high; but by its MoneyFlow ’tis -668 same-scale points below same. And as you know, flow leads dough:
Or to reprise Bachman Turner Overdrive from back in ’74: ![]() “You Ain’t Seen Nothing Yet…”
“You Ain’t Seen Nothing Yet…”![]()
Thus let it be Gold that gets your dough!
Cheers!
…m…
www.TheGoldUpdate.com
www.deMeadville.com
and now on “X”: @deMeadvillePro
31 January 2025 – 08:34 Central Euro Time
Gold yesterday achieved our anticipated All-Time High in eclipsing the 2802 level (February); the “continuous contract” now being on April (including the 27 points of fresh premium as herein noted in Wednesday’s comment) currently finds price at 2850; more of course tomorrow in the 794th consecutive Saturday edition of The Gold Update. At present for the BEGOS Markets we’ve the Bond below its Neutral Range for today, whilst above same is the Spoo; session volatility is yet again light. Amongst the correlations of the five primary BEGOS components, the best currently is negative between the Bond and Spoo. And (save for Oil), the seven other components are all in 21-day linreg uptrends (see Market Trends). ‘Tis a highly-visible data day for the Econ Baro, the incoming metrics being Q4’s Employment Cost Index, January’s Chi PMI, and December’s Personal Income/Spending featuring the “Fed-Favoured” Core PCE.
30 January 2025 – 08:45 Central Euro Time
At present for the BEGOS Markets we’ve the Bond, Gold and Silver all above their respective Neutral Zone’s for today, whilst below same is Oil; session volatility is again light to this point. Going ’round the Market Values horn (in real-time) for the five primary BEGOS components finds the Bond basically only -1 point “low” vis-à-vis its smooth valuation line, the Euro -0.009 points “low”, Gold +91 points “high”, Oil spot on its valuation line, and the Spoo now only +23 points “high”, albeit the S&P 500 itself remains “textbook overbought”; again, our Moneyflow page for the S&P is projecting negatively. Q4 Earnings Season for the S&P 500 now shows 105 constituents having reported of which 72% having beaten their bottom lines from a year ago, an above-average pace, albeit the “live” (futs-adj’d) P/E of 45.7x remains dangerously excessive, now nearly double what ’twas a dozen years ago. Today’s incoming metrics for the Econ Baro include December’s Pending Home Sales, plus the first peek at what (by consensus) may be an stagflationary Q4 GDP (the real result slowing with the inflation element increasing).
29 January 2025 – 08:45 Central Euro Time
All three elements of the Metals Triumvirate are at present below today’s Neutral Zones, as too is the Swiss Franc; the balance of the BEGOS Markets are within same, and volatility is light. Gold’s cac volume is rolling from February into that for April, with 27 points of additional premium: note the All-Time High for Spot Gold itself is 2790, whereas ’tis 2802 (February) and 2847 (April); the latter’s present price is 2792. Per Market Rhythms, our top two for pure swing consistency are (on a 10-test basis) the Bond’s daily Moneyflow and the non-BEGOS Yen’s daily Price Oscillator, and (on a 24-test basis) the latter for the Yen plus its daily Parabolics. Yesterday’s relief rally for the S&P 500 only recouped some 30% of Monday’s monetary outflow; again, mind the S&P 500 Moneyflow page; however, the rally did find the Spoo whipsaw back above its smooth valuation line (see Market Values); either way, the Index itself is “textbook overbought” and the “live” (futs-adj’d) P/E at this instant is 46.5x. Nothing is due for the Econ Baro today with the FOMC’s Policy Statement arriving late in the session (19:00 GMT).
28 January 2025 – 08:36 Central Euro Time
We’ve at present the Euro, Swiss Franc and Silver below today’s Neutral Zones; Oil is above same, and BEGOS Markets’ volatility is mostly moderate. Yesterday’s -1.5% drop in the S&P 500 pales in comparison to its actual monetary outflow which was equivalent to a -11.5% S&P drop: remember, this is a leading indicator suggestive of still lower levels near-to-mid-term for the S&P. The Bond has performed splendidly as foreseen by its “Baby Blues” (see Market Trends) some two weeks ago. The Metals Triumvirate took quite a thumping yesterday, Silver notably so as the Gold/Silver ratio is back above 90x (90.3x in real-time); the current edition of The Gold Update mentioned the possibility of Gold “dropping like a stone”, and so it did to start the week with the FOMC and then key inflation data in the balance; nonetheless, Gold’s fresh weekly parabolic Long trend offers some 200 points of downside protection before such trend would reverse. The Econ Baro awaits January’s Consumer Confidence and December’s Durable Orders.
27 January 2025 – 08:46 Central Euro Time
Save for the Bond (at present above today’s Neutral Zone), “red” is the watchword to begin the week for the seven other BEGOS Markets, all (save for Oil) at present below their respective Neutral Zones; of note, Silver, Copper and the Spoo are all down better than -1%. Session volatility is firmly moderate. The Gold Update highlights price’s weekly parabolic trend having flipped from Short-to-Long, whilst citing three key levels for which to watch: 2802 (the next All-Time High), 3000 (as a “milestone”), and then — however not necessarily on this Long run — 3262 as our forecast high for this year (see 04 January’s edition). By Market Values, the Spoo in real-time has provisionally crossed beneath its smooth valuation line: if confirmed by close, we’d anticipate the Spoo revisiting at least the 5900s, (which obviously is but within a day’s trade from here, distance-wise). ‘Tis a key data week for the Econ Baro: mind inflationary readings from both Q4 GDP (Thursday) and the December’s PCE (Friday); today brings December’s New Home Sales.
The Gold Update: No. 793 – (25 January 2025) – “Gold Goes Long with Three Golden Goals”

In sum, we anticipate further near-term rising for Gold, barring — as duly noted — an inflation/Fed-hike scare.
Moreover, let’s close with this critical notion: in addition to the three Golden goals herein described, there is, of course, a fourth:
- Goal Four: 3822 = the opening Scoreboard’s current Dollar debasement valuation of Gold, even as adjusted for the yellow metal’s own supply increase. No, we shan’t get there within this new weekly parabolic Long trend, let alone this year. But ’tis sitting out there…

Reprise: “Got Gold?”
Cheers!
…m…
www.TheGoldUpdate.com
www.deMeadville.com
and now on “X”: @deMeadvillePro
24 January 2025 – 08:42 Central Euro Time
Save for the Spoo, the seven other BEGOS Markets are higher, within which save for Oil, the other six are at present above today’s Neutral Zones; (thus obviously the Dollar Index is lower); session volatility is firmly moderate. As anticipated, Oil’s “Baby Blues” (see Market Trends) confirmed falling below their key +80%: with price presently in the mid-74s, we ought think at least the 72s are due near-term; by Market Rhythms for Oil, our best currently for pure swing consistency (10-test basis) is the 1hr Price Oscillator. The NDX (Nasdaq 100) yesterday recorded a “Hobson Close” in settling on its high trade for the session; thus a lower opening later today wouldn’t be untoward. And the Econ Baro concludes its quiet week, incoming metrics including December’s Existing Home Sales.
23 January 2025 – 08:33 Central Euro Time
Save for the Bond, the seven other BEGOS Markets are lower, those presently below today’s Neutral Zones being Silver and Copper; volatility is quite light. Going ’round the Market Values horn for the five primary components, we’ve: the Bond nearly -3 points “low” below its smooth valuation line, the Euro -0.0095 points “low”, Gold +90 points “high”, Oil +4.43 points “high” and the Spoo +49 points “high”. The S&P 500 hit an all-time high yesterday (6101): the “live” (futs-adj’d) P/E at this instant is 47.9x and the Index is moderately “textbook overbought”. At Market Trends, Oil’s “Baby Blues” have provisionally dropped below the key +80% axis, which if confirmed at close suggests still lower price near-term. And the Econ Baro continues its muted week, the only metric due today being last week’s Initial Jobless Claims.
22 January 2025 – 08:37 Central Euro Time
GOLD: its weekly parabolic trend as anticipated has provisionally flipped from Short-to-Long; (confirmation comes at week’s settle). For the BEGOS Markets at present, both Copper and Oil are below today’s Neutral Zones; the other six components are within same, and volatility is light. Oil’s “Baby Blues” (see Market Trends) remain above the key +80% axis, but are kinking lower in real-time. Looking at Market Rhythms, our 10-test leaders for pure swing consistency are currently Gold’s 15mn MACD, 30mn Parabolics, and 2hr MACD, plus the non-BEGOS Yen’s daily Parabolics, the Euro’s 4hr MACD and Silver’s 4hr Parabolics; for the 24-test basis we’ve still the Yen’s daily Price Oscillator and daily Parabolics, plus Silver’s 1hr Price Oscillator and the Euro’s 4hr Parabolics. The Econ Baro awaits December’s Leading (i.e. “lagging” as the Baro leads them) Indicators for which the consensus is flat (makes some sense given the Baro’s having been essentially flat these past few months).
21 January 2025 – 08:36 Central Euro Time
The two-day session for the BEGOS Markets continues with at present the Bond, Euro, Swiss Franc and Silver atop their Neutral Zones whilst Copper and Oil are below same, thus leaving Gold and the Spoo within; volatility is robust (again this covers two days) with only the Spoo not having (yet?) exceeded 100% of its EDTR (see Market Ranges). The Bond’s “Baby Blues” are accelerating higher: price now 113^24 is up into structural resistance ranging from 113^02-114^23; however should that be eclipsed, it brings to the table a potential run toward 116^08 as first herein mentioned on 31 December per the Bond’s Market Profile at that time. Mind too the “Baby Blues” for both Gold and Oil as such metric for both markets is now above +80% but price beginning to come off a bit; Gold has yet to reach the 2759 weekly parabolic flip-to-Long level. Q4 Earnings Season starts picking up its reporting pace today.
20 January 2025 – 08:43 Central Euro Time
Given the StateSide holiday, the BEGOS Markets enter a two-day session for Tuesday settlement with at present the Euro, Swiss Franc, Gold and Silver all above their respective Neutral Zones; none of the other four components are below same, and volatility is mostly moderate. The Gold Update highlights price having come just four points away from flipping its weekly parabolic trend from Short-to-Long: the hurdle price to so do this week is 2759 and today’s high already is 2955; we thus expect the provisional flip to Long. The Bond’s “Baby Blues” of trend consistency (see Market Trends) confirmed moving above the key -80% axis, so higher price levels ought be in the offing near-term. Similarly for Oil, we’re watching for its “Baby Blues” to break below the +80% axis from which we’d anticipate lower prices. ‘Tis a very light week for th Econ Baro with just four metrics due commencing on Wednesday; thus Q4 Earnings Season shall get the fundamental hat-tip: thus far ’tis been excellent for the S&P 500 given that 20 of the 23 companies having reported have beaten their bottom lines of a year ago; problematic of course is the “live” P/E remaining dangerously high (in futs-adj’d real-time) at 47.1x.
The Gold Update: No. 792 – (18 January 2025) – “Gold Gets Close, but No Cigar”

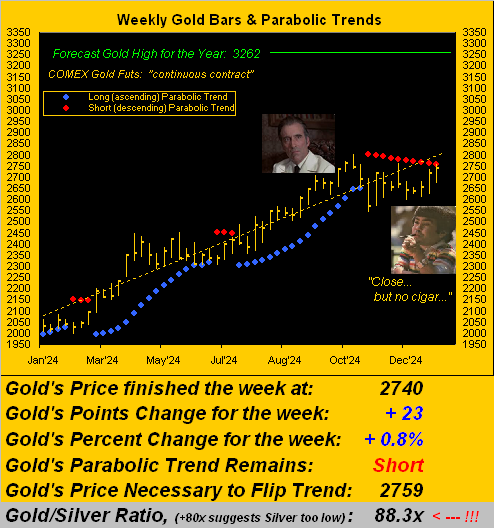
As to Gold’s price stack, here ’tis:
The Gold Stack
Gold’s Value per Dollar Debasement, (from our opening “Scoreboard”): 3817
Gold’s All-Time Intra-Day High: 2802 (30 October 2024)
Gold’s All-Time Closing High: 2799 (30 October 2024)
The Weekly Parabolic Price to flip Long: 2759
2025’s High: 2759 (17 January)
10-Session directional range: up to 2759 (from 2627) = +132 points or +5.0%
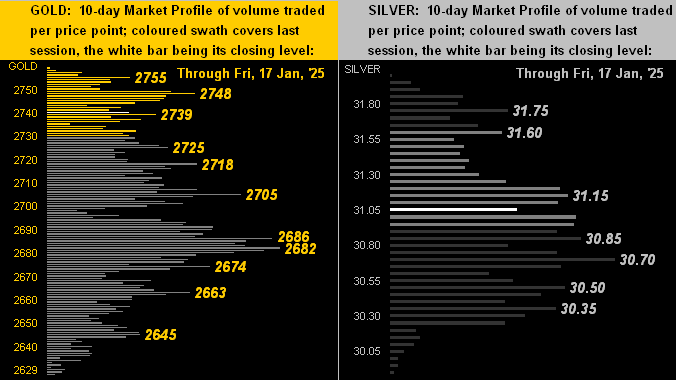
Trading Resistance: notable nearby Profile nodes 2748 / 2755
Gold Currently: 2740, (expected daily trading range [“EDTR”]: 34 points)
Trading Support: 2739 / 2725 / 2718 / 2705 / 2686 / 2682
10-Session “volume-weighted” average price magnet: 2697
2025’s Low: 2625 (06 January)
The 300-Day Moving Average: 2371 and rising
The 2000’s Triple-Top: 2089 (07 Aug ’20); 2079 (08 Mar’22); 2085 (04 May ’23)
The Gateway to 2000: 1900+
The Final Frontier: 1800-1900
The Northern Front: 1800-1750
On Maneuvers: 1750-1579
The Floor: 1579-1466
Le Sous-sol: Sub-1466
The Support Shelf: 1454-1434
Base Camp: 1377
The 1360s Double-Top: 1369 in Apr ’18 preceded by 1362 in Sep ’17
Neverland: The Whiny 1290s
The Box: 1280-1240
And so to close with another FinMedia alert so eloquently put, again courtesy of DJNw, this from last Tuesday: “The 10-year Treasury yield is nearing 5% again. Why stock investors are freaking out”. ‘Course the inference there goes back to the two years prior to the FinCrisis. Indeed for seven of the 16 months spanning from April 2006 into July 2007, the 10-year yield reached above 5%, albeit the S&P 500 rose right through that period (+20% from 1295 to as high as 1556). Then it all went wrong — not because of a 5% yield — but rather due to lack (understatement) of lending standards.
Still, many modern-day stock investors don’t know what ’tis to truly be “freaking out”. They’ve yet to experience the “Look Ma! No Earnings!” crash, given the current “live” price/earnings ratio of the S&P 500 (now 46.6x) eventually reverting to its 68-year evolving mean; (for those of you scoring at home, that suggests a -50% S&P correction). Too, there’s the even scarier “Look Ma! No Money!” crash, given the current $52.9T S&P 500 market capitalization being supported by a liquid StateSide money supply [“M2”] of “only” $21.7T; (for you WestPalmBeachers down there, that means there’s more than twice as much money invested in the stock market than readily exists).
So fire up a stogie and be prepared to follow your monetary star…

…such that you’re not spared a Gold bar and cigar!
Cheers!
…m…
www.TheGoldUpdate.com
www.deMeadville.com
and now on “X”: @deMeadvillePro
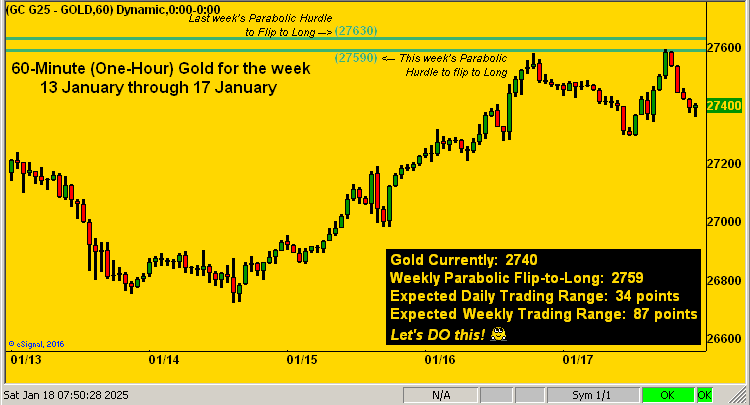
17 January 2025 – 08:37 Central Euro Time
The Euro, Swiss Franc and Silver are all at present below today’s Neutral Zones, whilst above same are both Copper and Oil; BEGOS Markets’ volatility is light. Yesterday, Gold nearly eclipsed the week’s parabolic (2763) which would flip such weekly trend from Short-to-Long: Gold’s “high if an up day” for today is 2775, so ’tis within range to still get there; more in tomorrow’s 792nd consecutive Saturday edition of The Gold Update. The Bond’s “Baby Blues” in real-time are above the key -80% axis; should that be confirmed on close, we’d seek higher Bond prices near-term with the 114s in mind; we’d mentioned the 116s a few weeks back, however they’ve since come off the Bond’s 10-day Market Profile: the low 113s to high 114s now appear initially resistive. The Econ Baro concludes its busy week with December’s Housing Starts/Permits and IndProd/CapUtil.
16 January 2025 – 08:45 Central Euro Time
Silver, Copper and the Spoo are all at present above their respective Neutral Zones for today; none of the other five BEGOS Markets are below same, and volatility is pushing toward moderate. Leading our Market Rhythms for pure swing consistency on a 10-test basis are the Euro’s 4hr Parabolics, too Silver’s 4hr Parabolics, and the non-BEGOS Yen’s daily Parabolics; on a 24-test basis we’ve again for the Yen both its daily Parabolics and daily Price Oscillator. Mind at Market Trend’s the Bond’s “Baby Blues” as they’re (finally) making an up move: a confirm above the -80% axis would be suggestive of still high prices. And ’tis a busy day for the Econ Baro, its eight incoming metrics including January’s Philly Fed and NAHB Housing Indexes, December’s Retail Sales and Ex/Im Prices, and November’s Business Inventories.
15 January 2025 – 08:39 Central Euro Time
The Bond is the sole BEGOS Market at present outside (above) today’s Neutral Zone; session volatility is light. We’ve noted the last few weeks the ongoing low level of the Bond’s “Baby Blues” for trend consistency (see Market Trends) as we continue to await their breaking above the -80% axis which would then be indicative of higher price levels near-term; as for the whole BEGOS bunch by trend disposition, the Bond, EuroCurrencies and Spoo all are in 21-day linreg downtrends, whilst the Metals Triumvirate along with Oil are in uptrends. Core wholesale inflation for December (PPI) was flat; today the Econ Baro looks to the month’s retail inflation (CPI); due too is January’s NY State Empire Index. And late in the session comes the release of the Fed’s Tan Tome.
14 January 2025 – 08:39 Central Euro Time
The Swiss Franc is at present above its Neutral Zone for today, whilst below same is Oil; BEGOS Markets’ volatility is light-to-moderate. Notably for Gold, its EDTR (see Market Ranges) has been decreasing: ’twas in the upper 40s in late November whereas today’s expectation is 35 points; the opposite is true for the Spoo, which in mid-December was as low as 42 but is 87 points for today. Going ’round the Market Values horn (in real-time) for the five primary BEGOS components: the Bond shows as nearly -5.5 points “low” relative to its smooth valuation line, the Euro as -1.0195 points “low”, Gold as +25 points “high”, Oil as +9.08 points “high”, and the Spoo as -144 points “low”. December’s inflation puzzle starts today for the Econ Baro at the wholesale level with the month’s PPI; (too, still due from yesterday is the Treasury Budget).
13 January 2025 – 08:49 Central Euro Time
The week begins with at present the Bond, Euro, Gold and Spoo all below their respective Neutral Zones for today; the other BEGOS Markets are within same, and volatility is well-moderate en route to becoming robust as the day unfolds: indeed Oil already has traded in excess of 100% of its EDTR (see Market Ranges). The Gold Update points to the yellow metal’s nearing the end of its weekly parabolic Short trend, (now entering its tenth-consecutive week as such), barring overly StateSide inflationary data due both tomorrow and Wednesday; too from a short-term trading perspective, our report highlights the recent “in hindsight” success of Gold’s one-hour Price Oscillator as a trading study to monitor. Oil’s cac volume is rolling from February into that for March. And ’tis a very busy week for the Econ Baro with 18 incoming metrics on the slate, beginning today with December’s Treasury Budget.