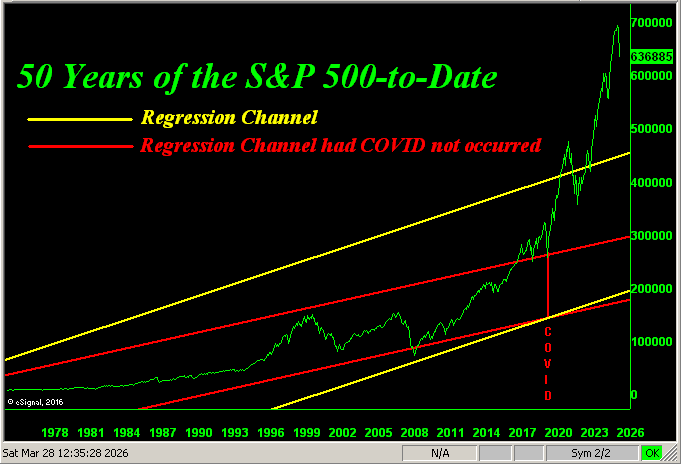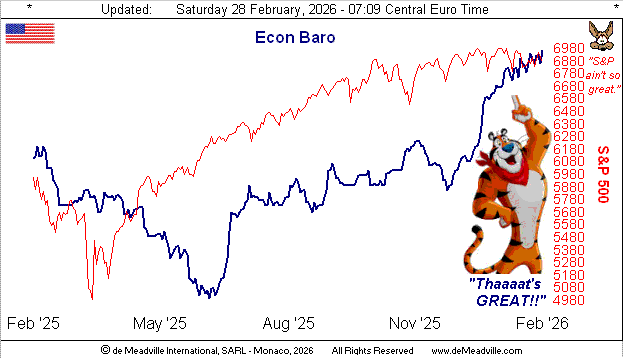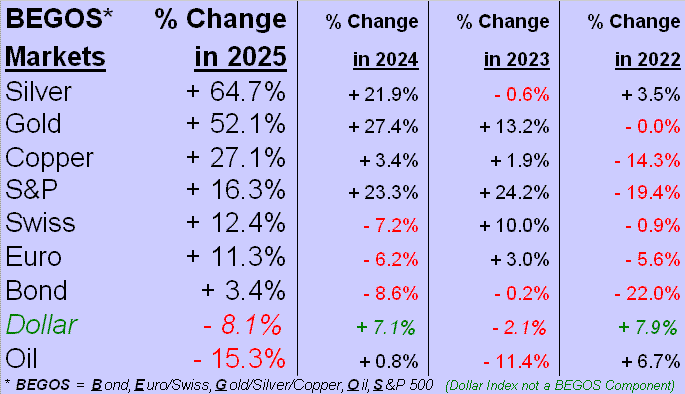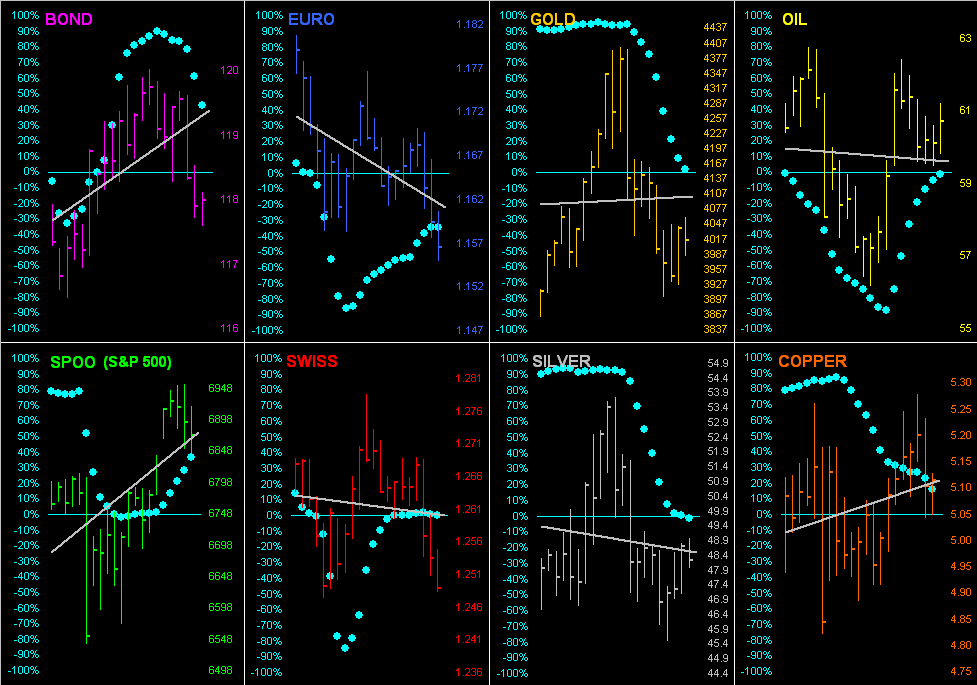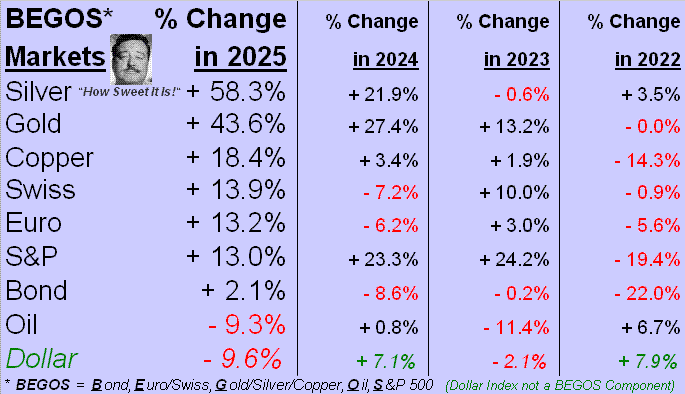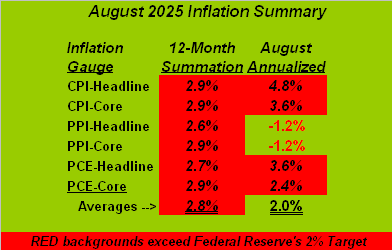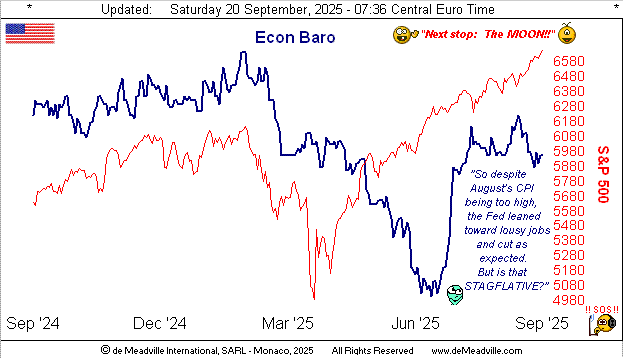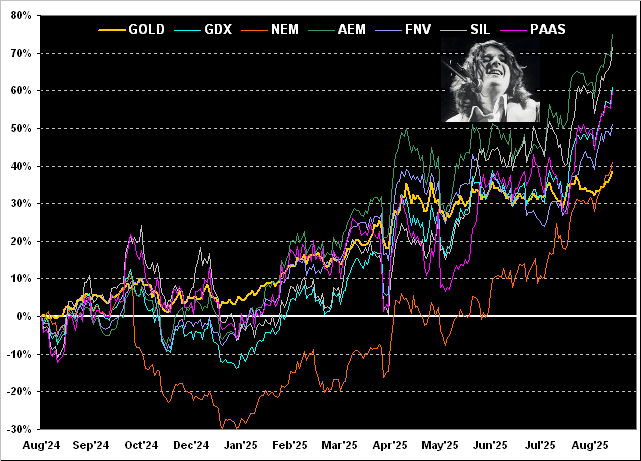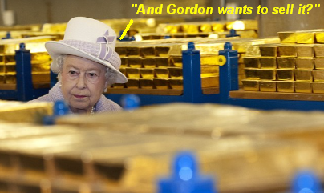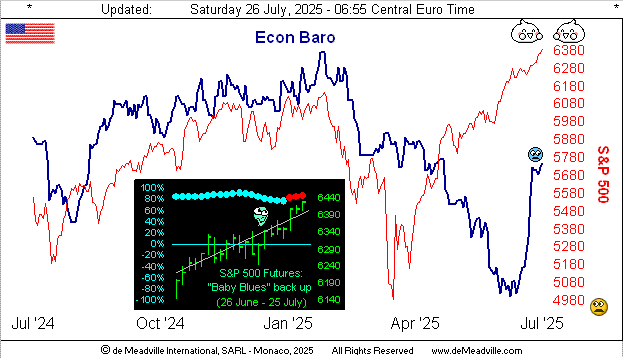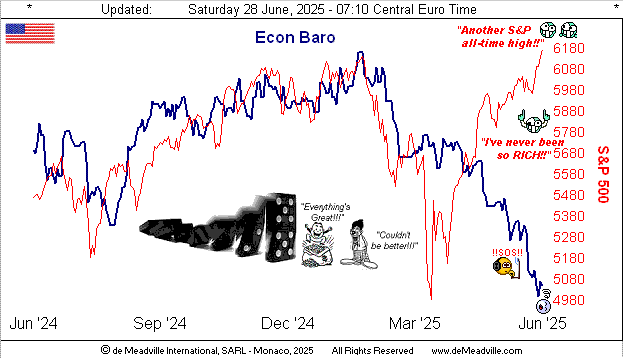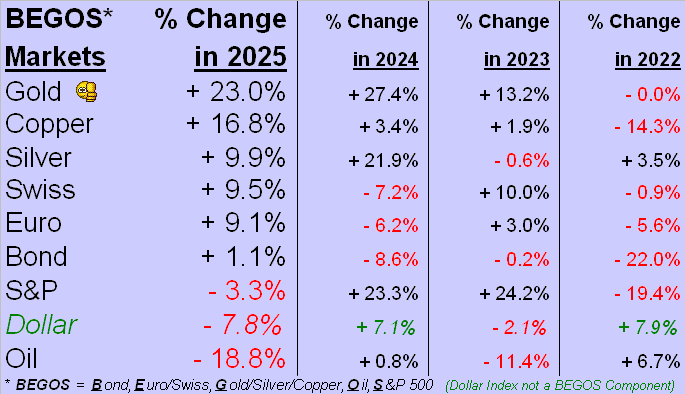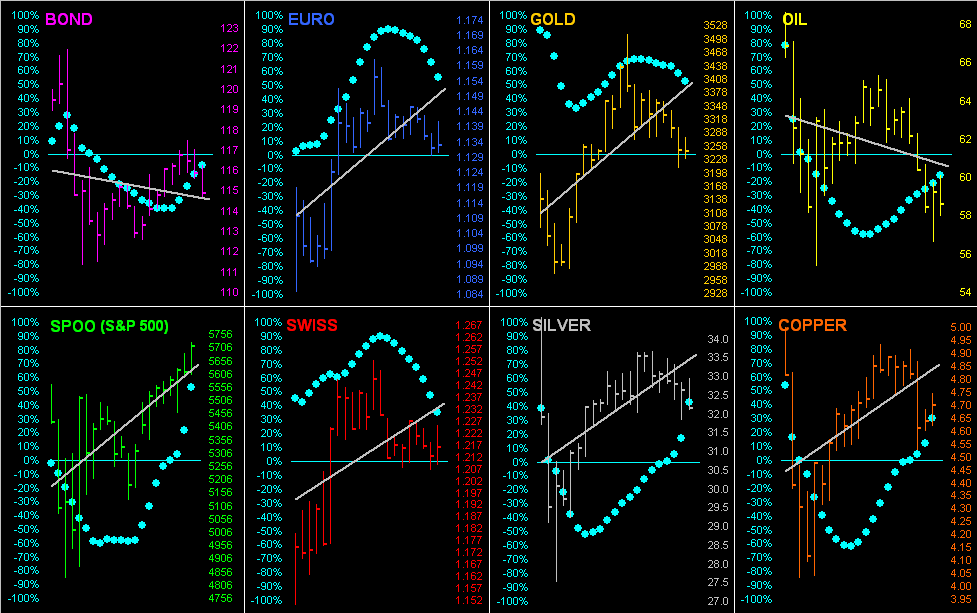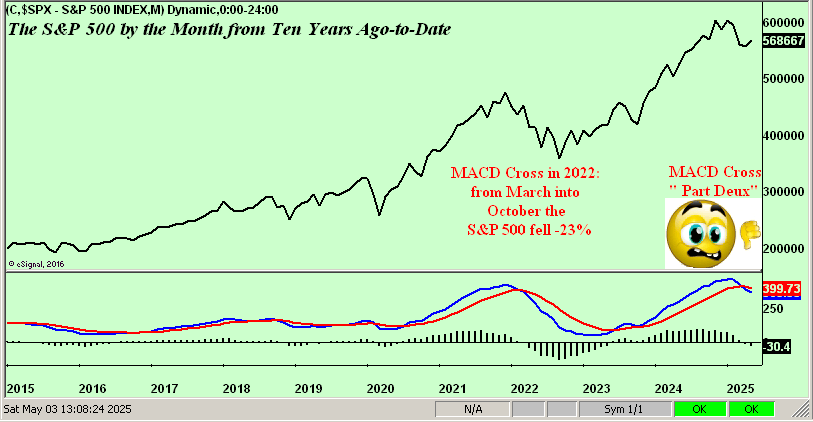
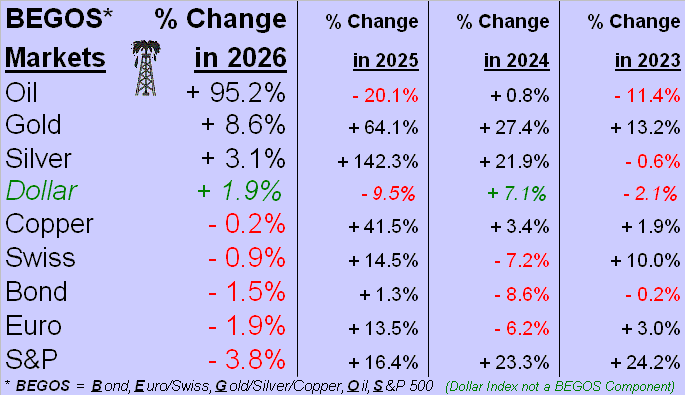
Still, both Gold and Silver are on the podium. But clearly the S&P 500 being -3.8% is certain to cause chaotic confusion for the “stocks only go up” crowd. The chilling news for such “marked-to-market millionaires” is that across the past 50 years, (which for you WestPalmBeachers down there is from 1976 through 2025), the S&P has netted 24% (i.e.12 years) that were negative … but there’s been only one down year in the past seven. Think the S&P is overwhelmingly due for a down year, or two? Reprise Murray Head from back in ’75: ![]() “Say it ain’t so, Joe”
“Say it ain’t so, Joe”![]() . Have a great day.
. Have a great day.
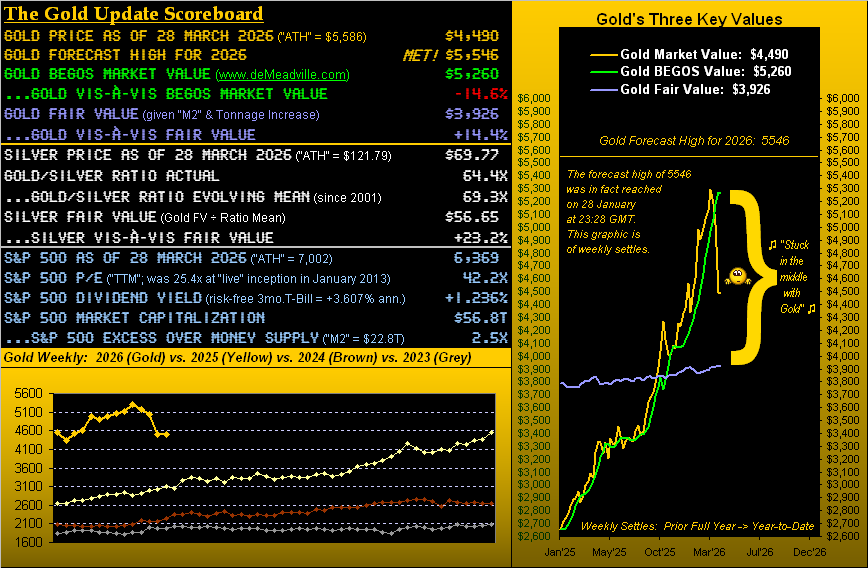
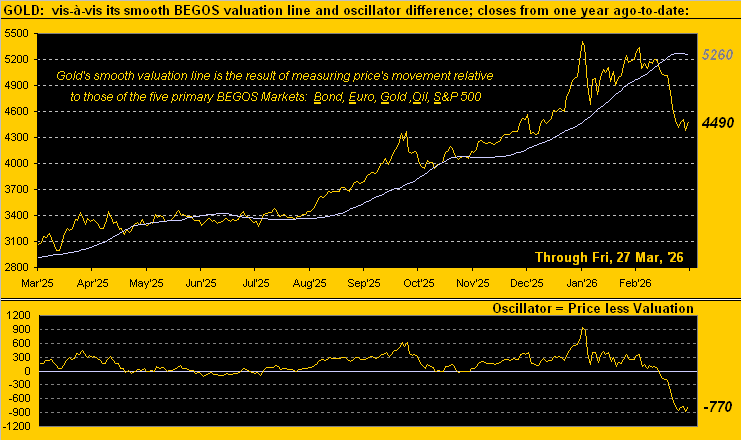
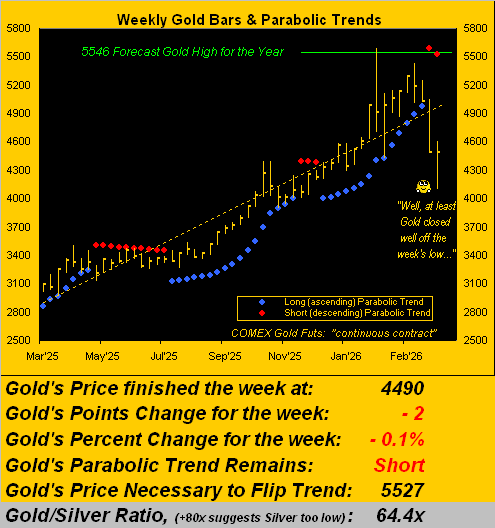
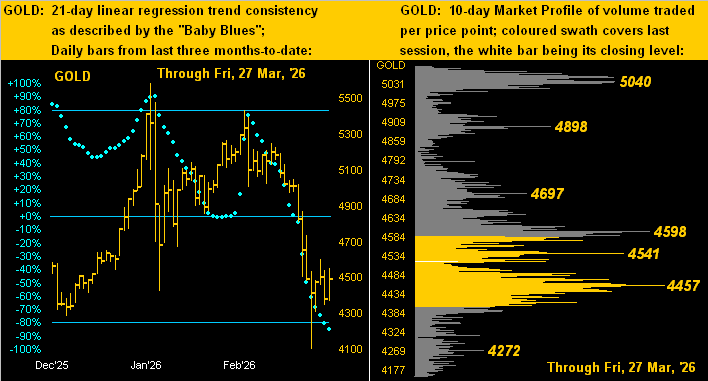
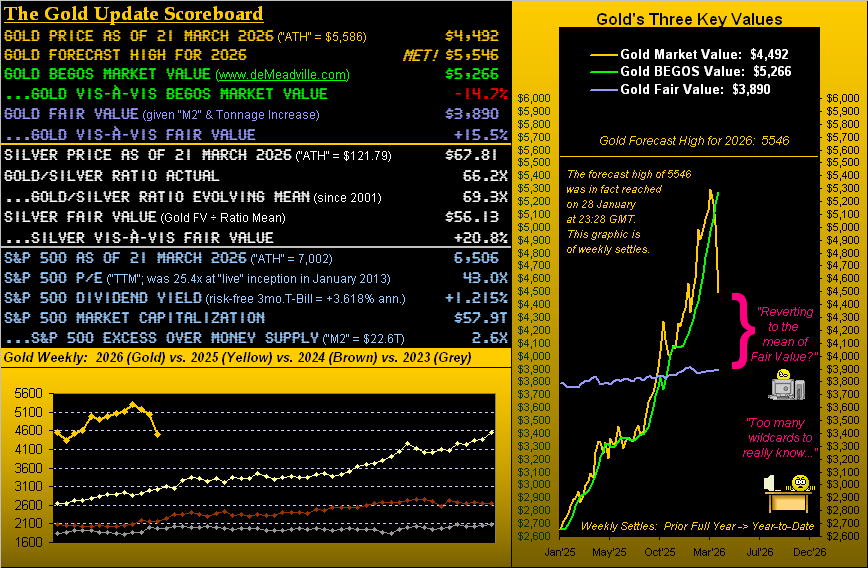
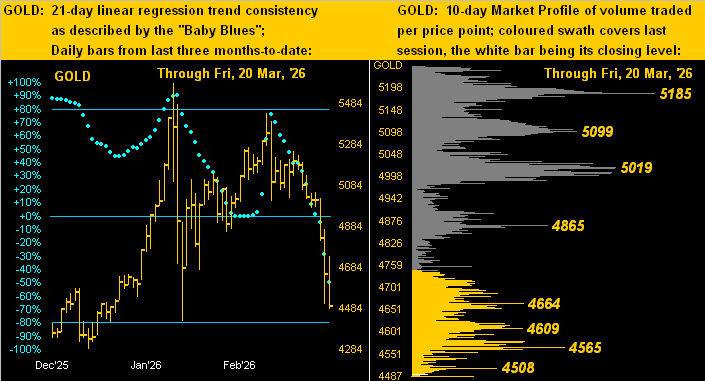
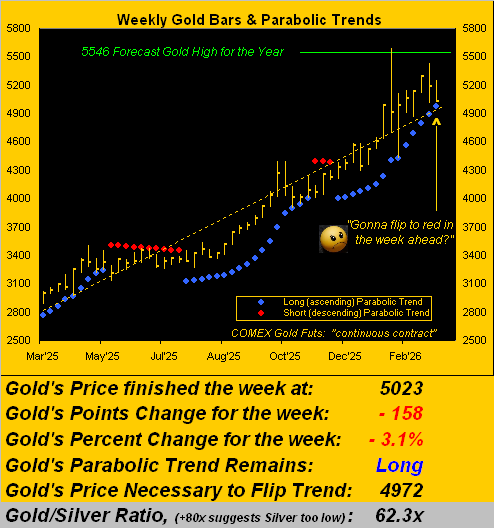
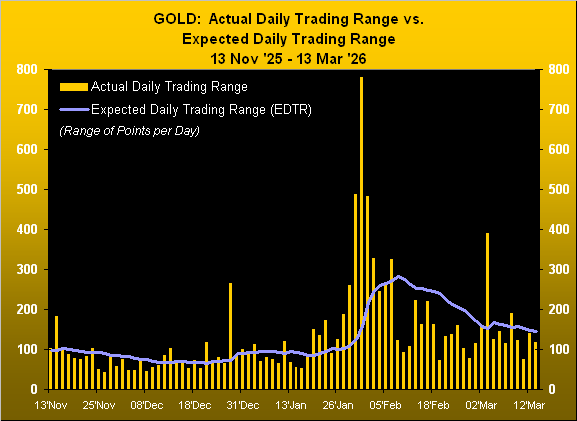
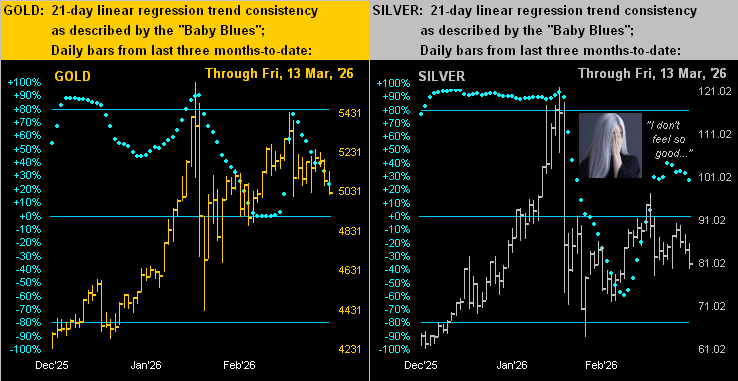
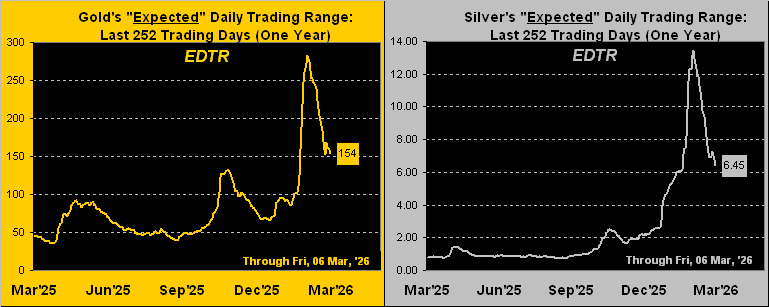
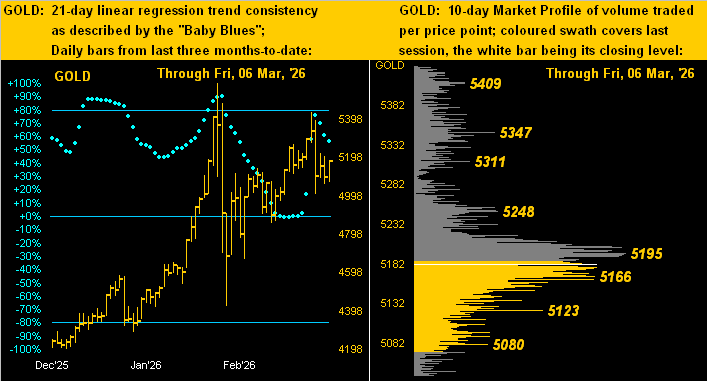
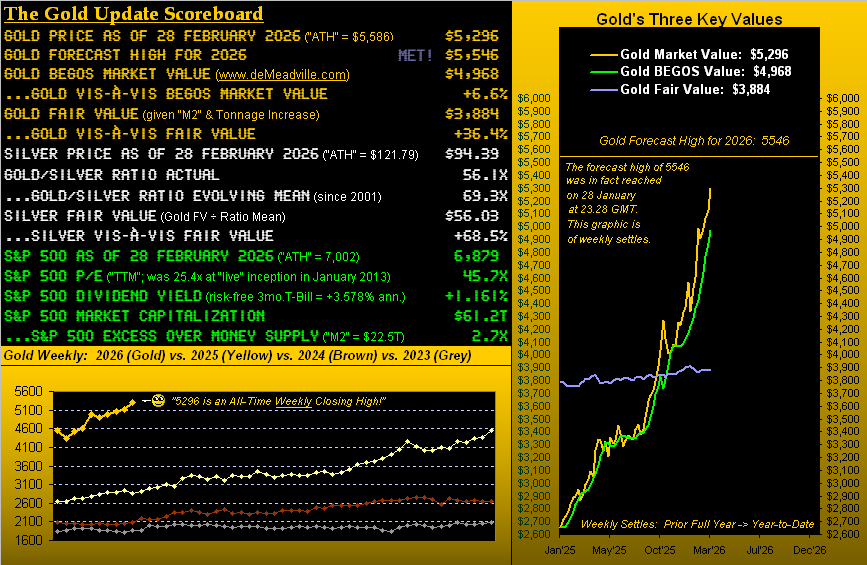
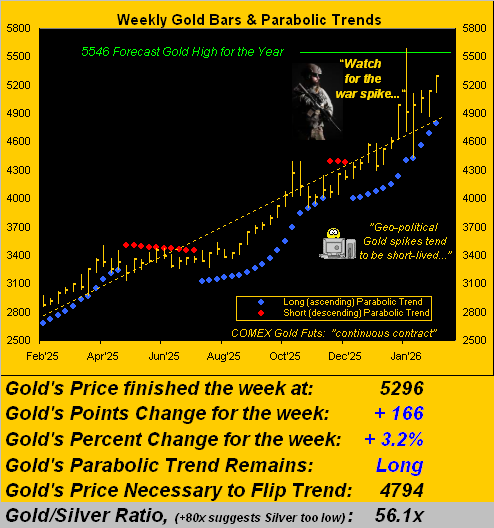
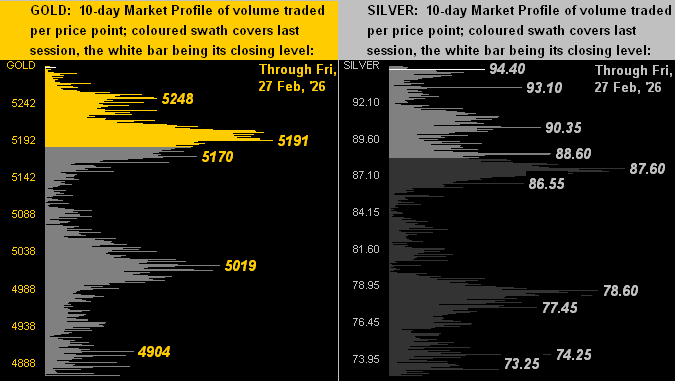
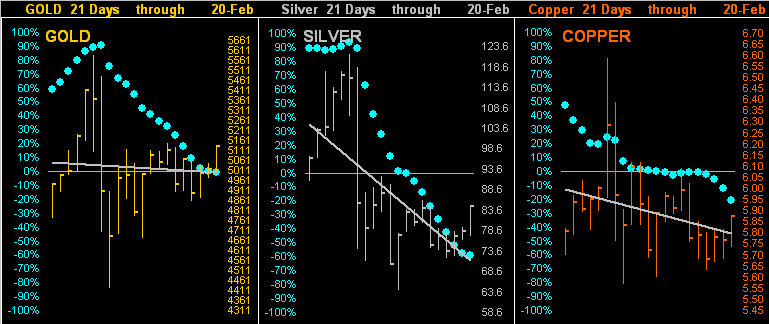
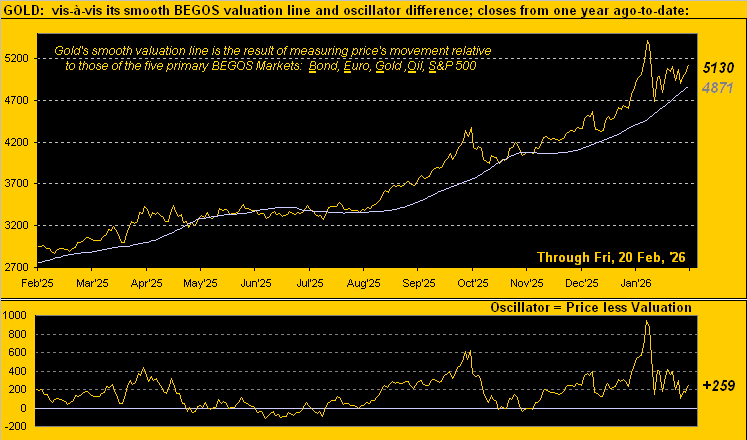
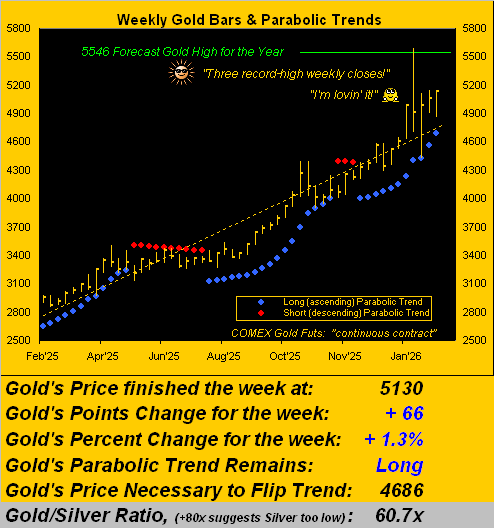
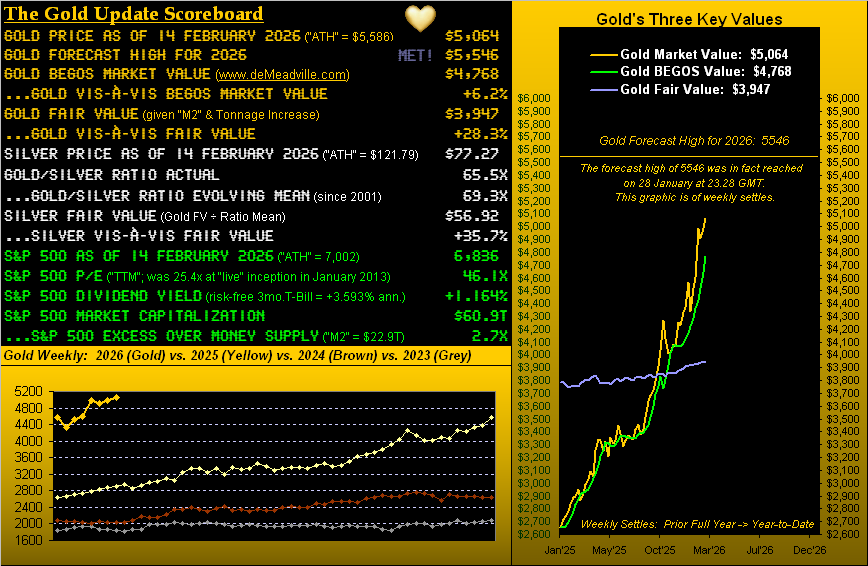
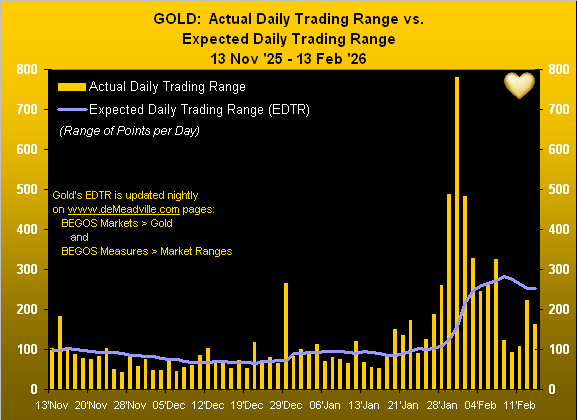
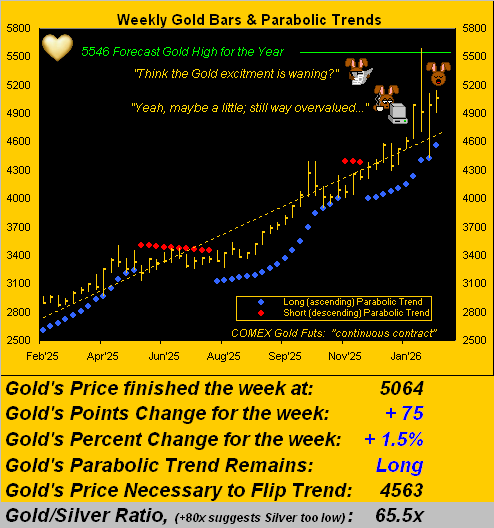
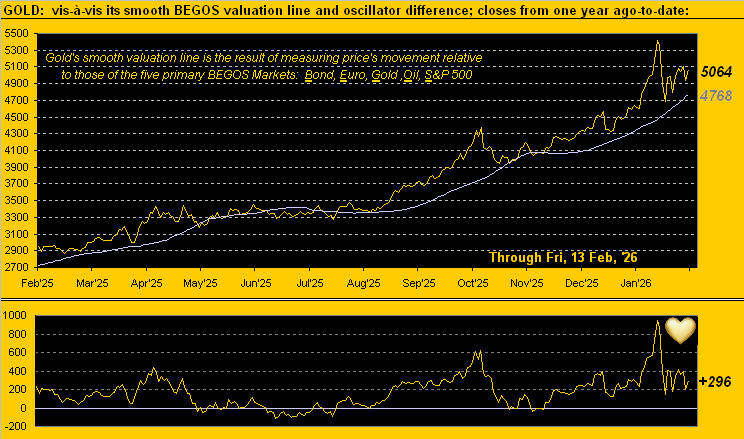
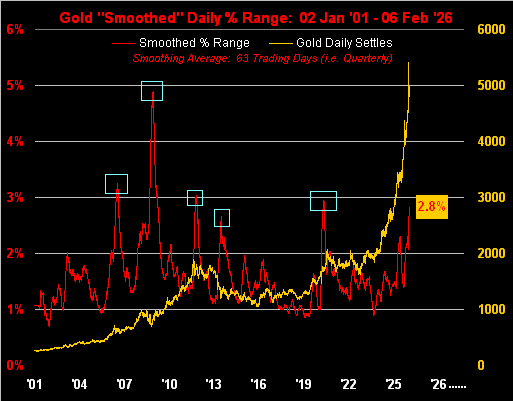
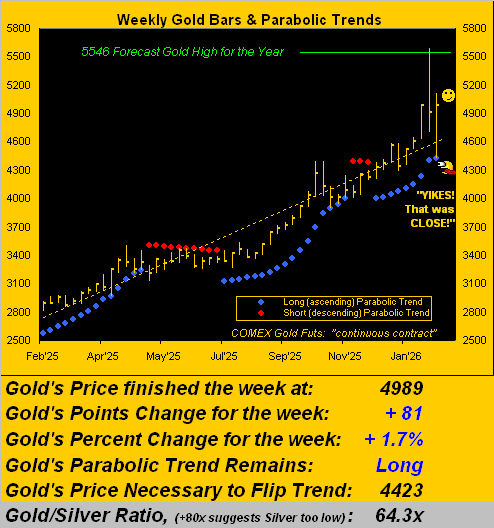
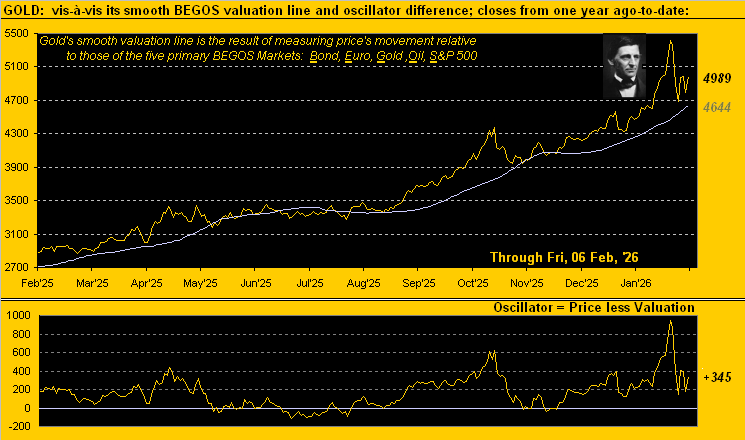
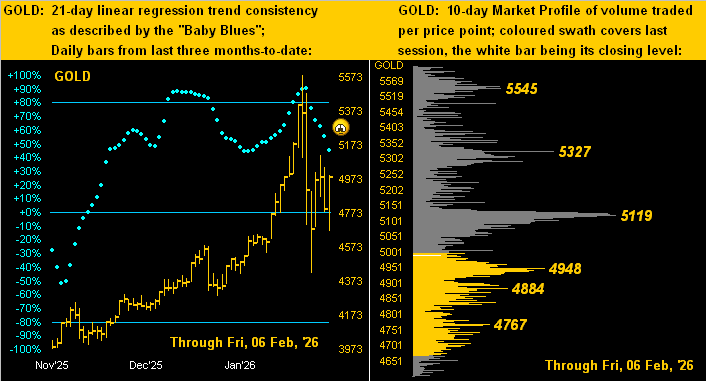
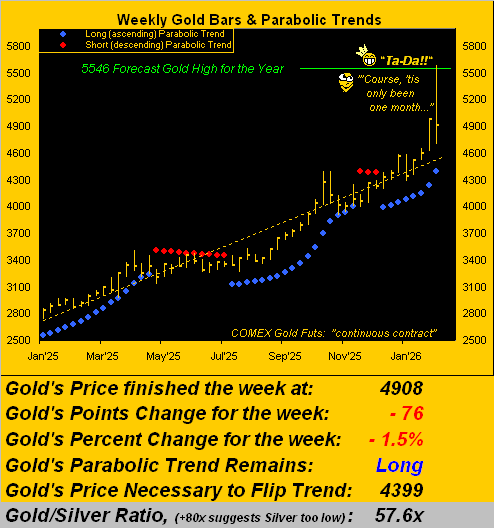
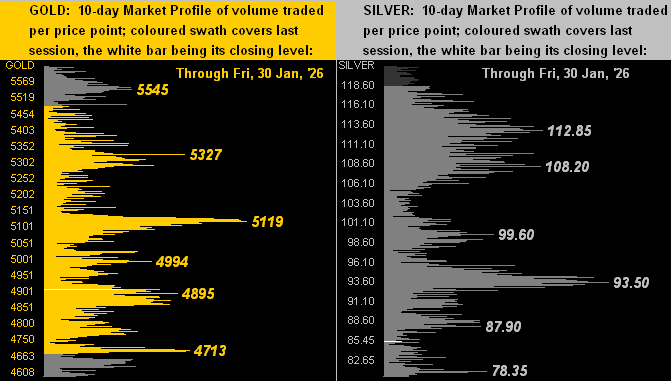
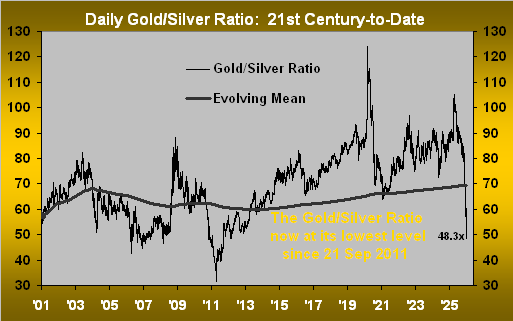
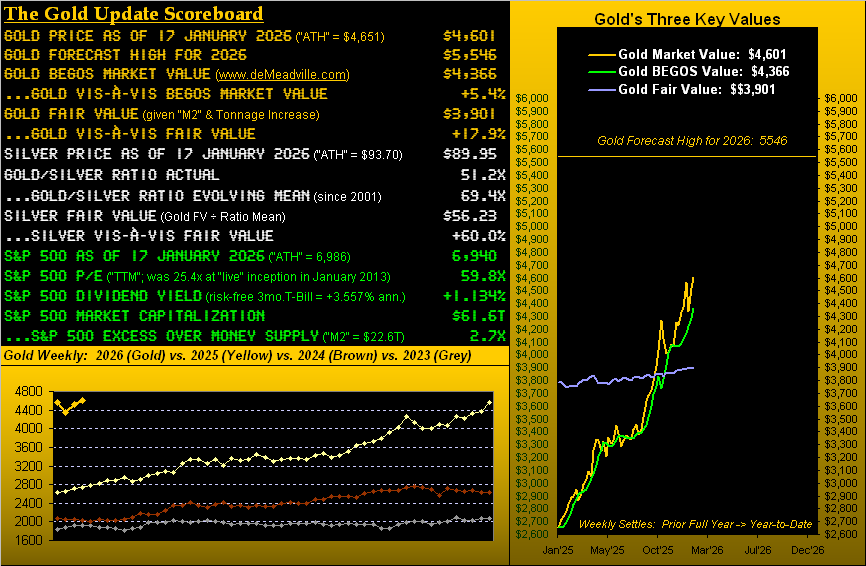
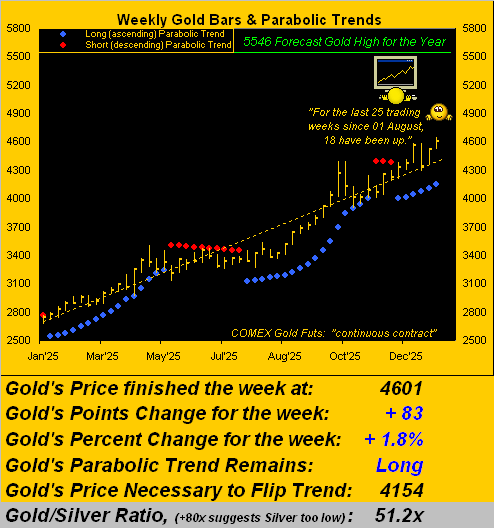
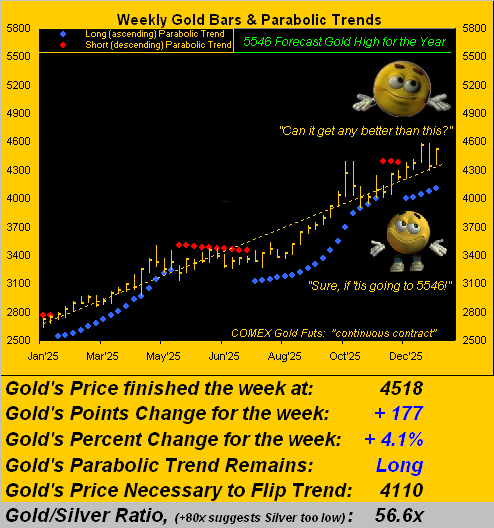
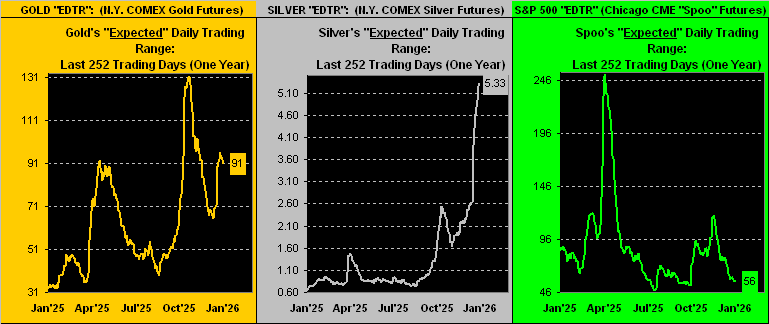
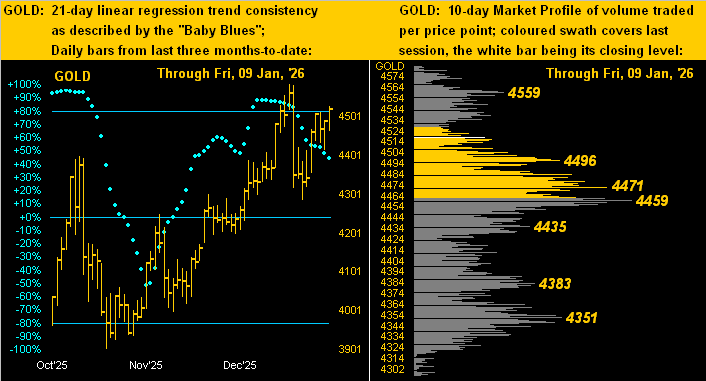
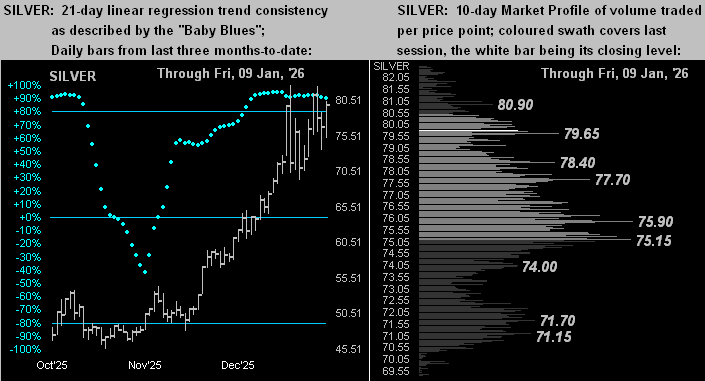
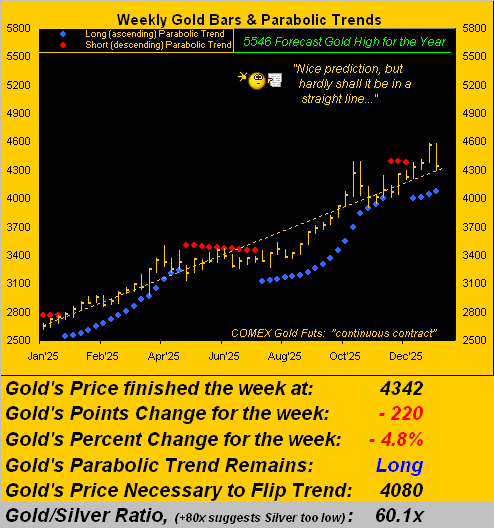
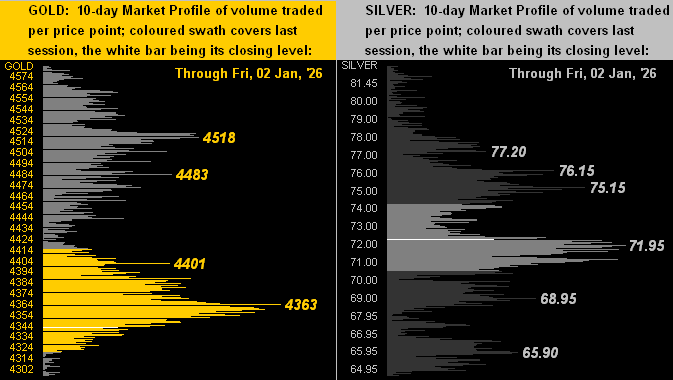
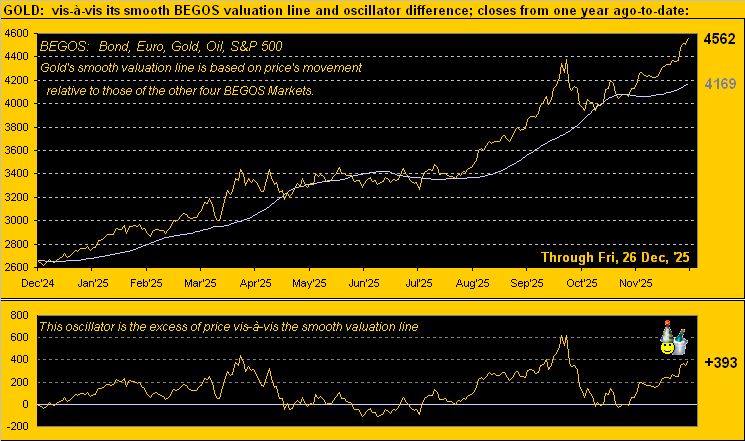
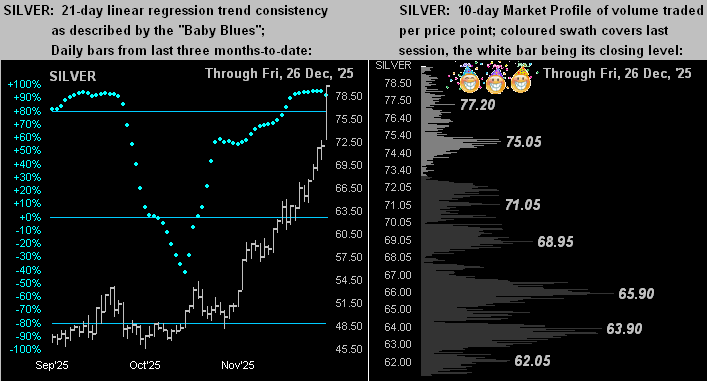
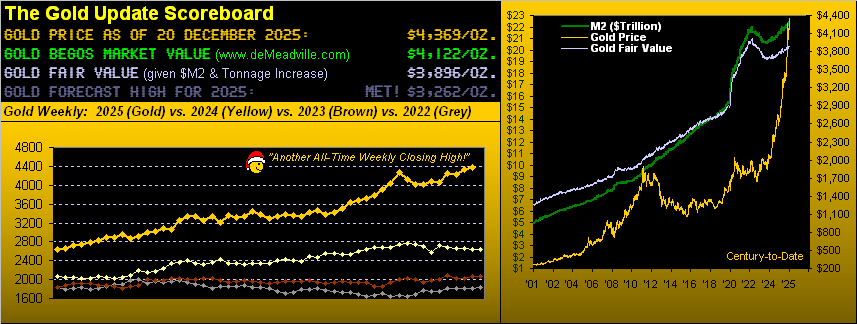
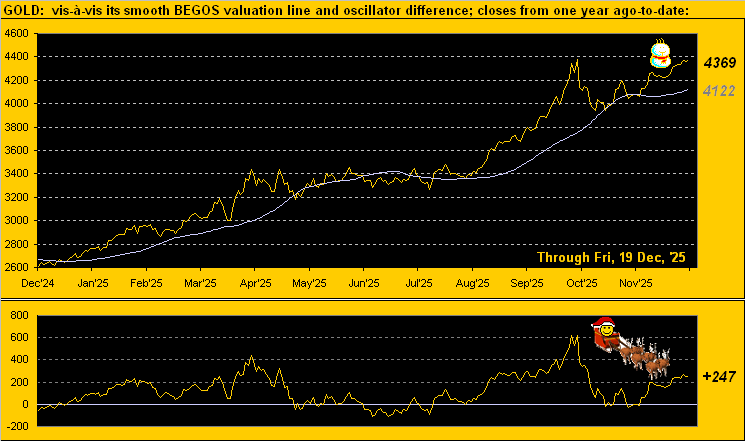
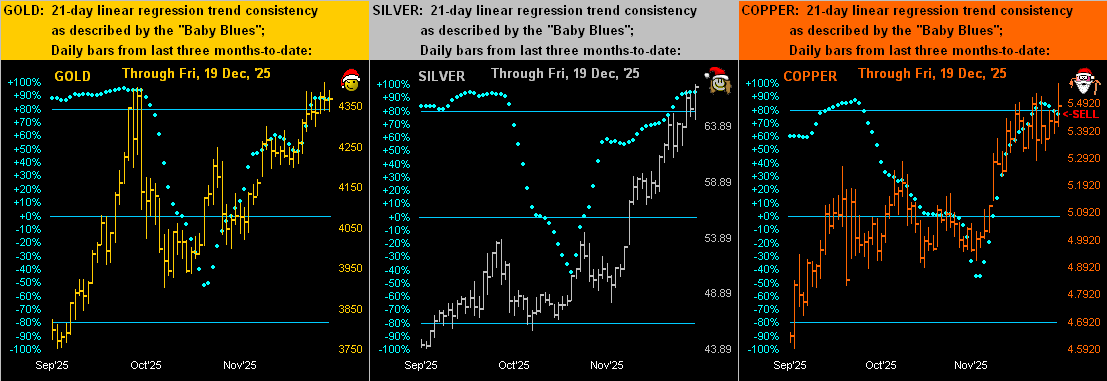
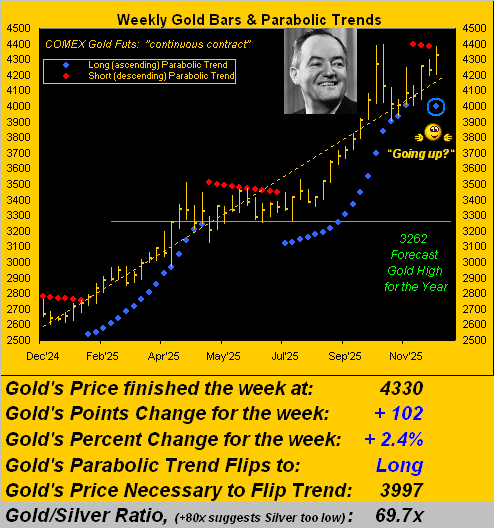
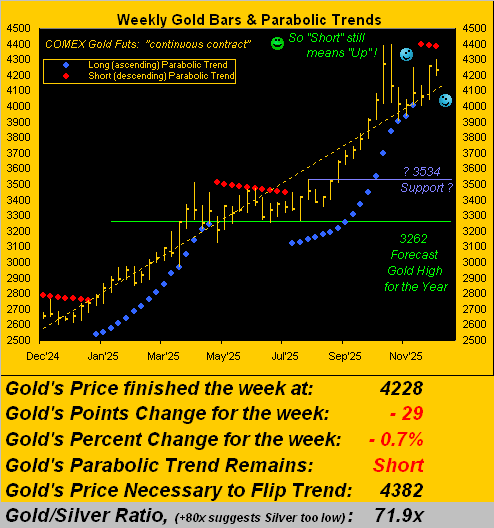
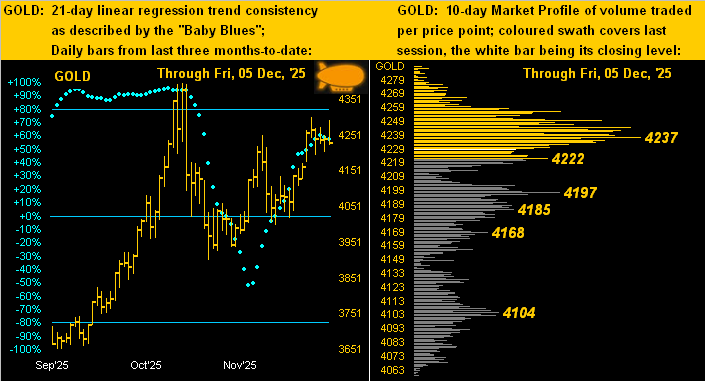
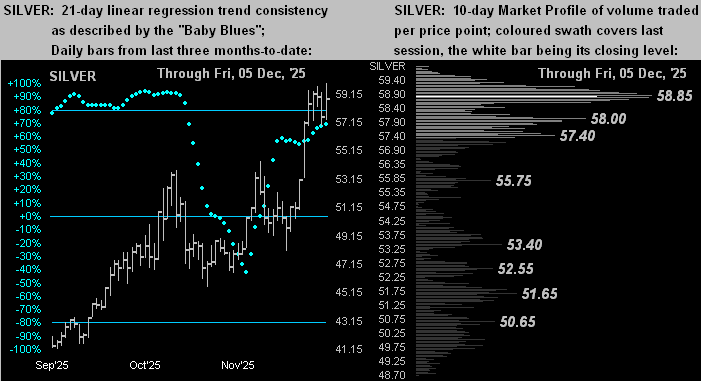
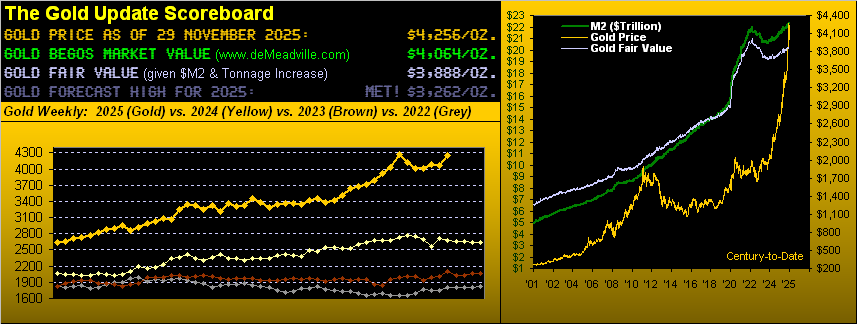
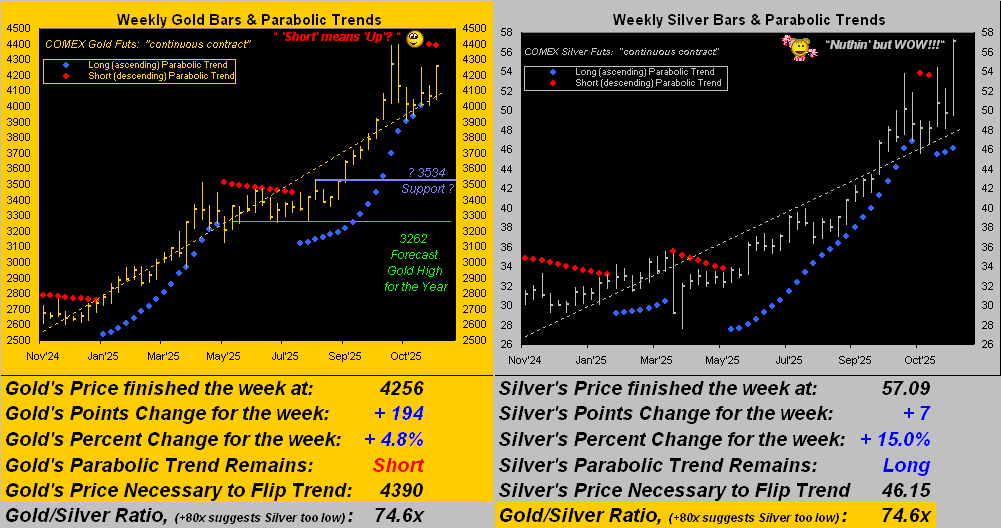
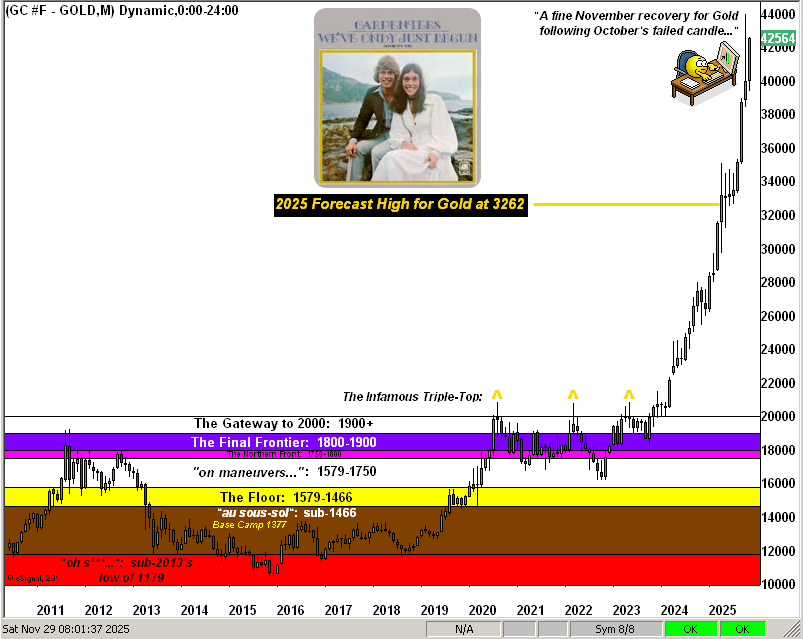
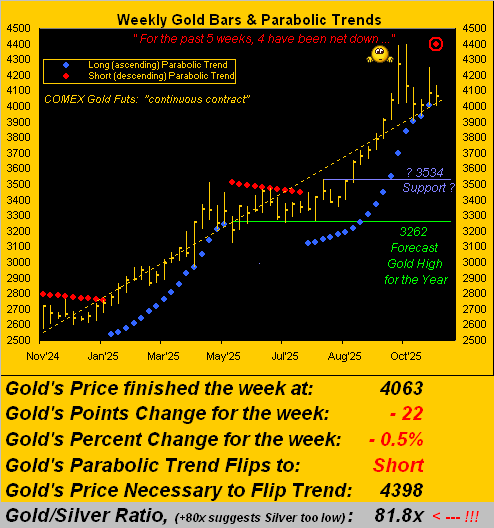
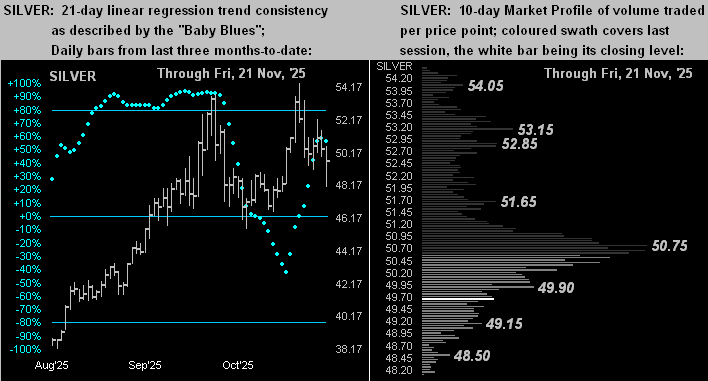
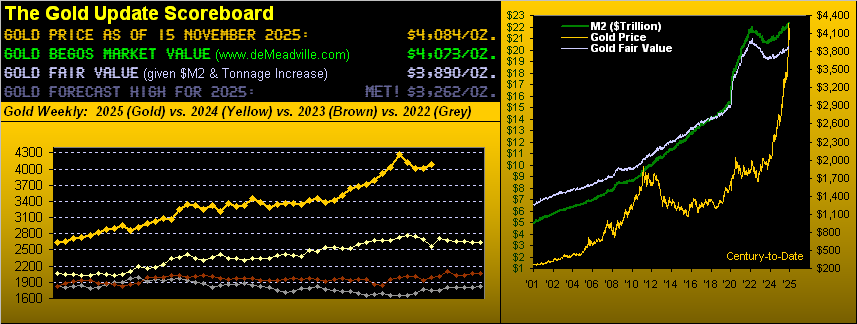
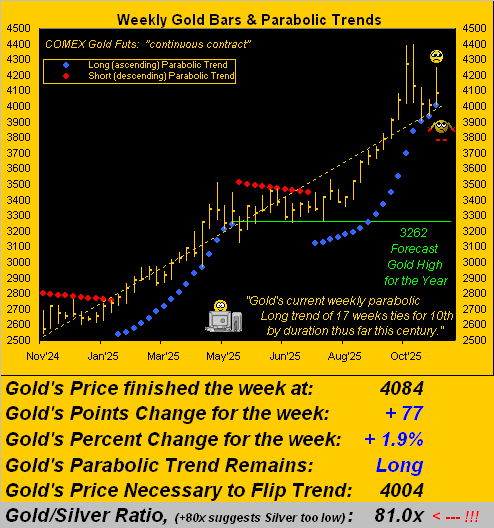
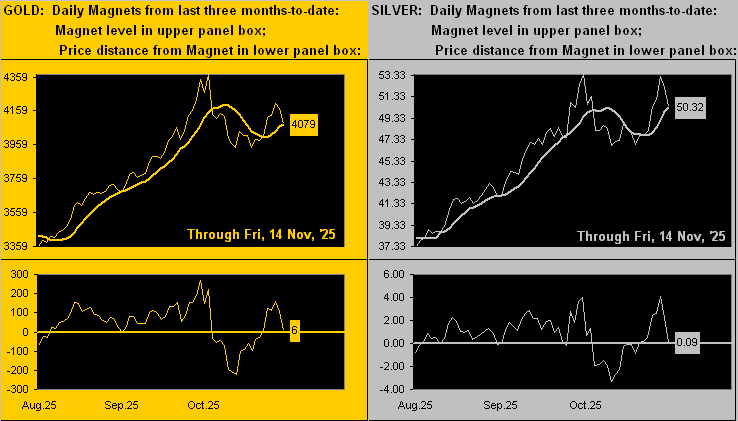
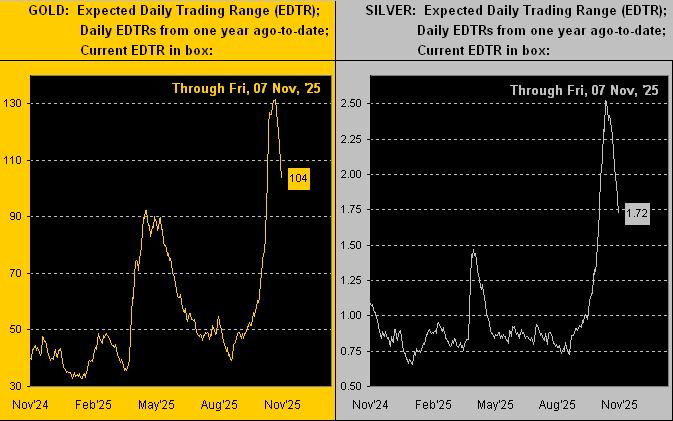
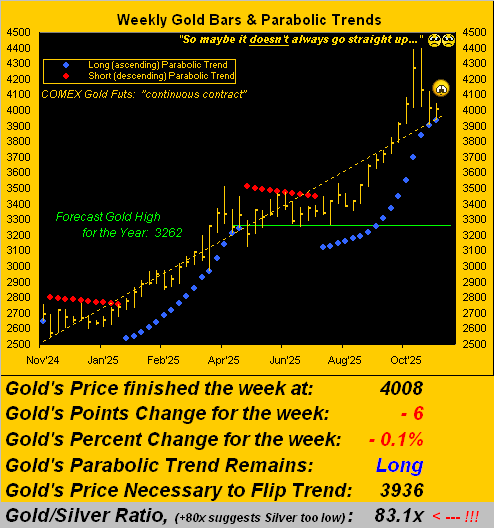
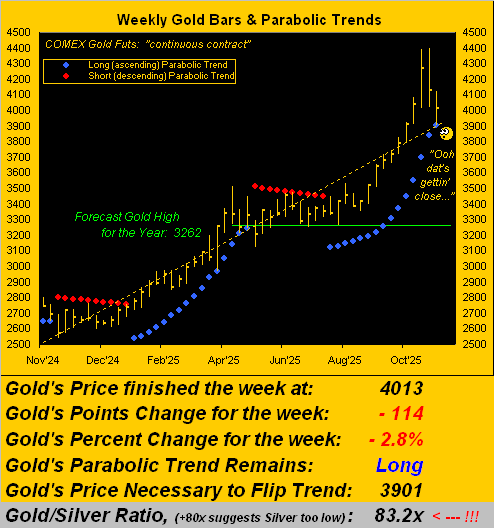
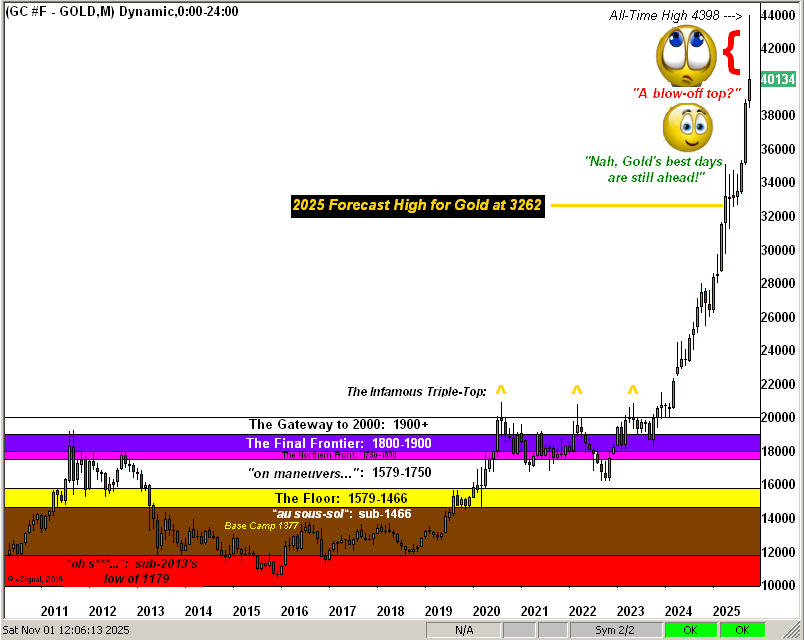
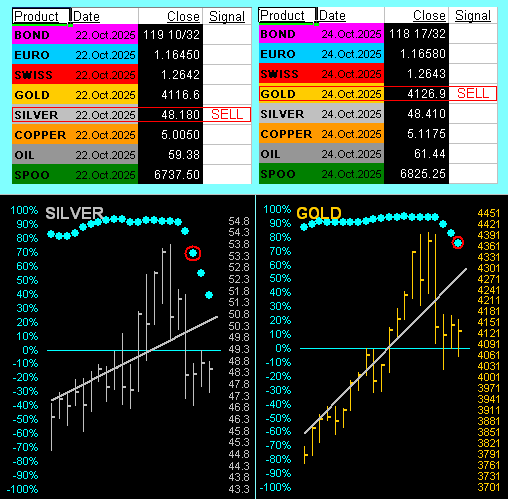
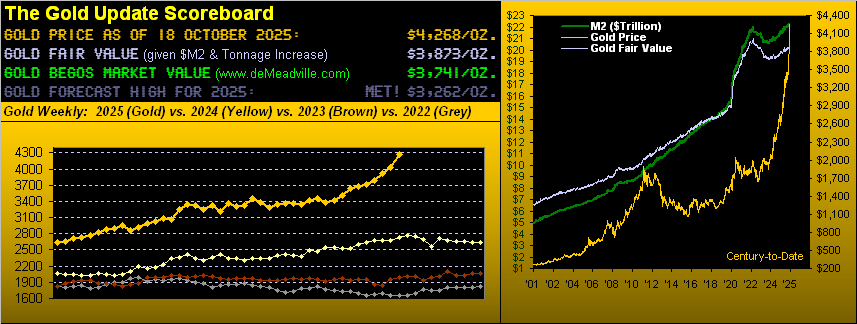
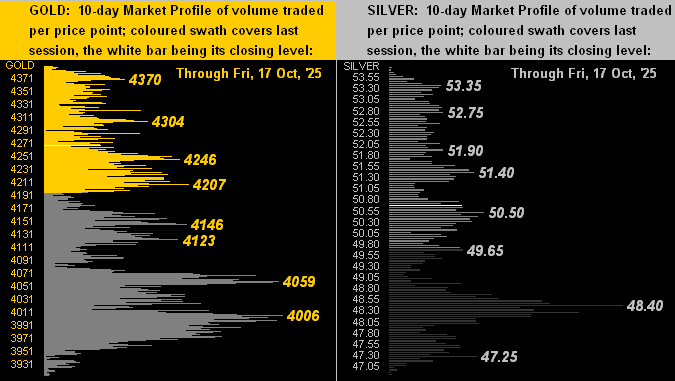
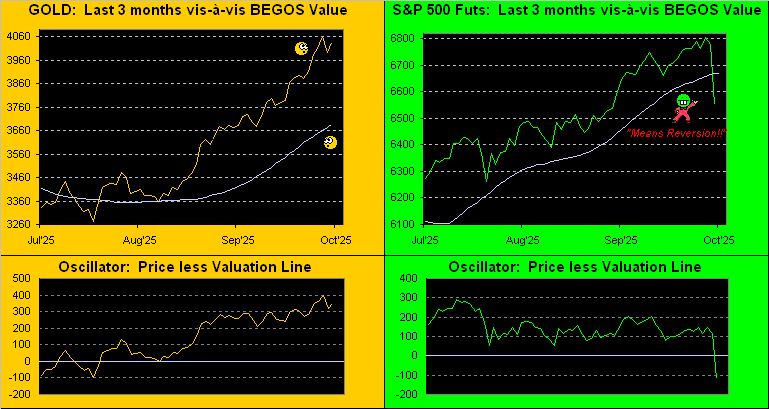
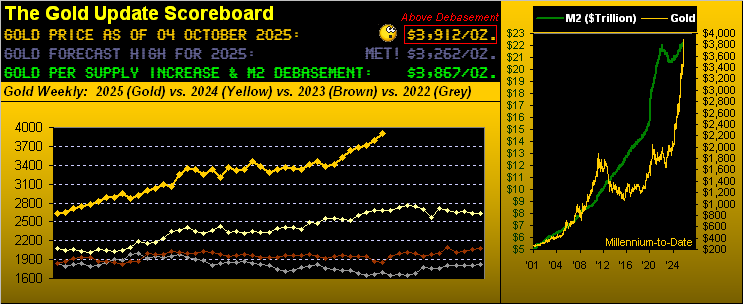
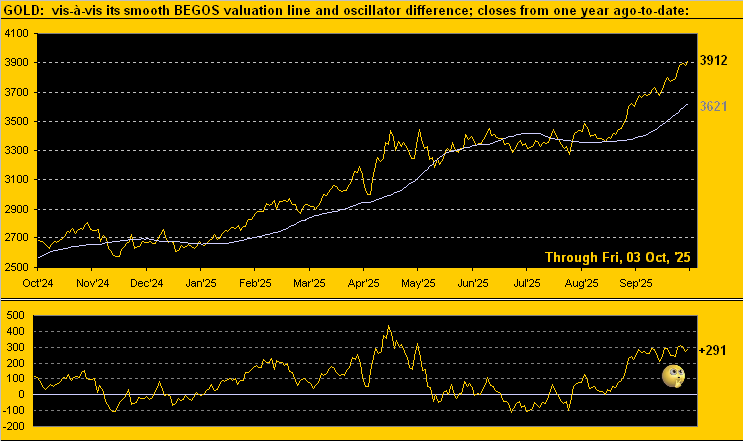
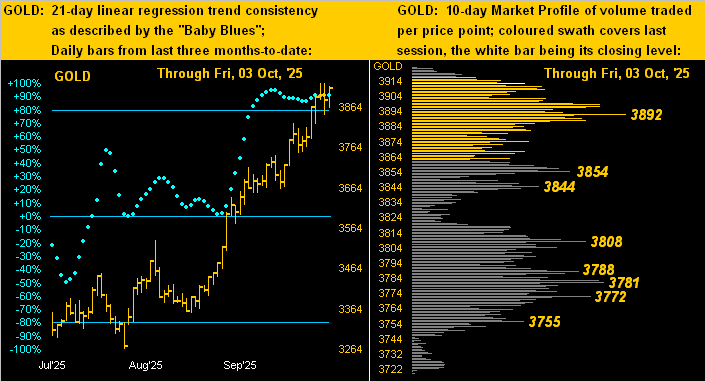
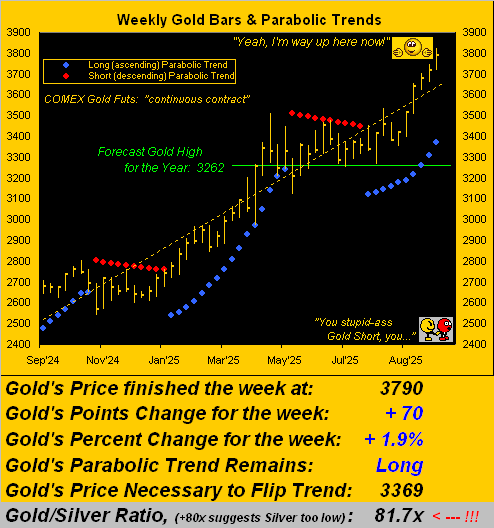
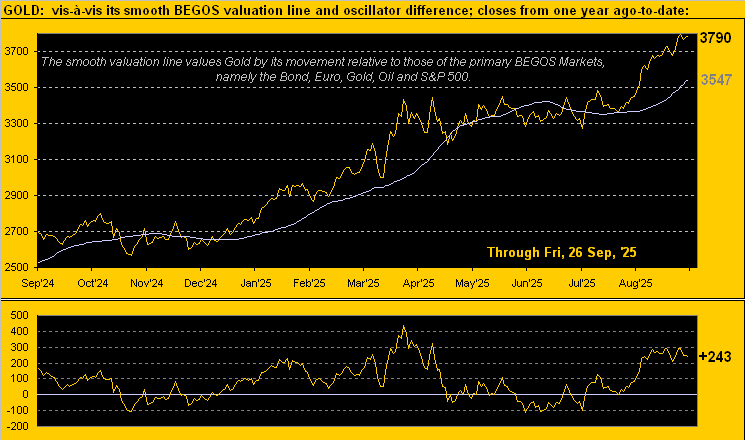
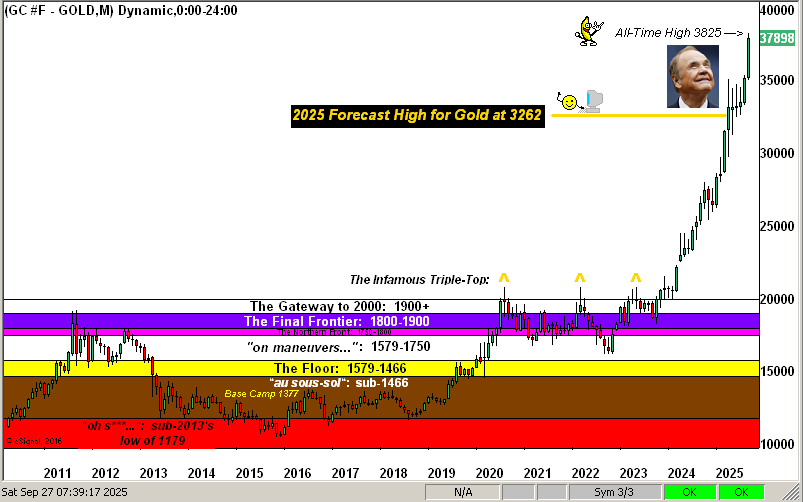
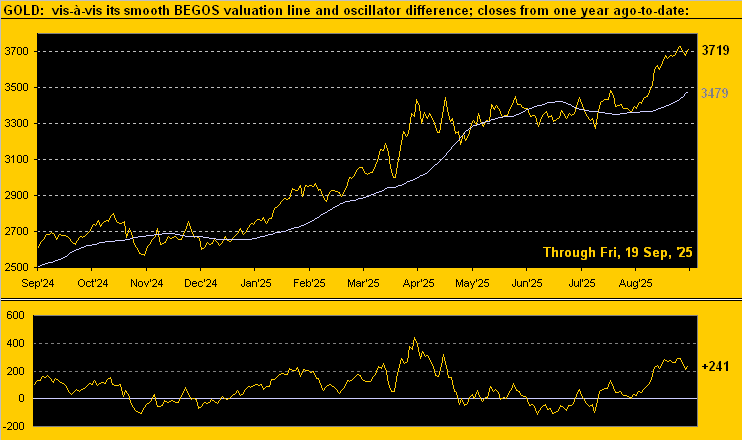
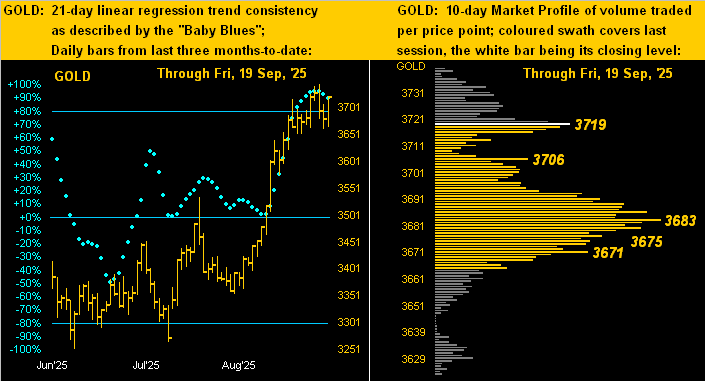
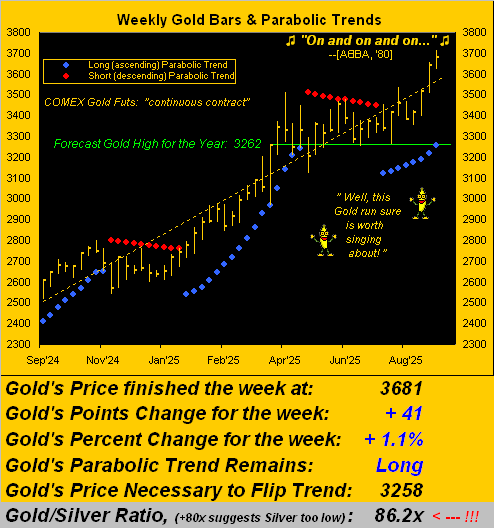
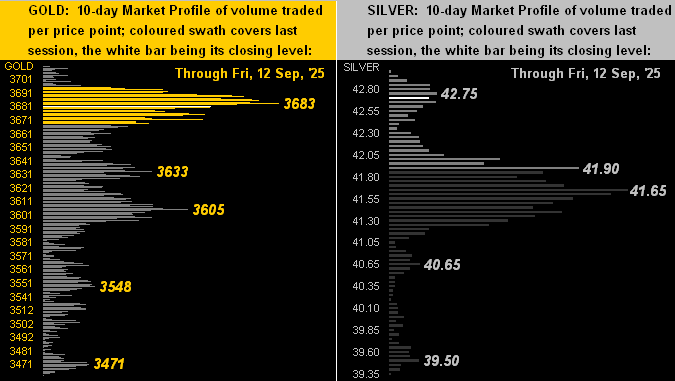
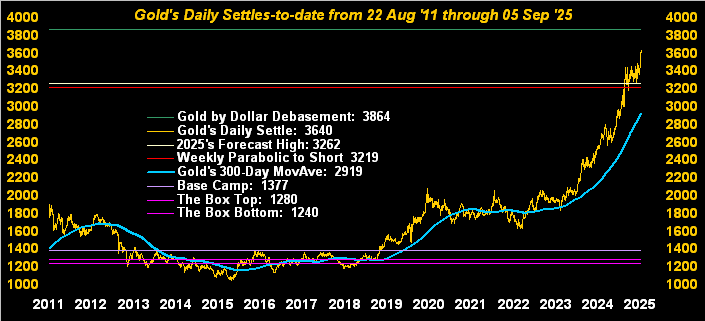
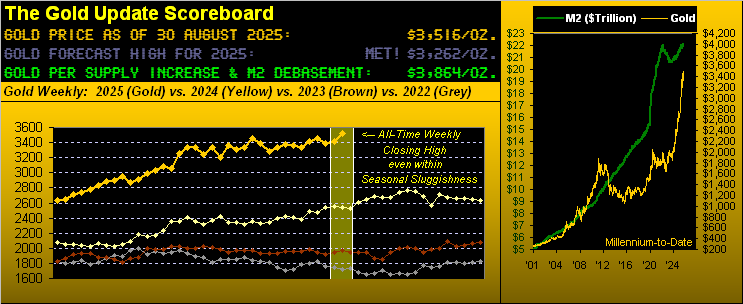
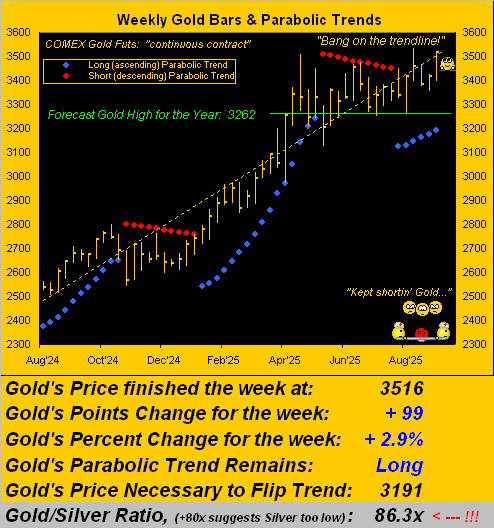
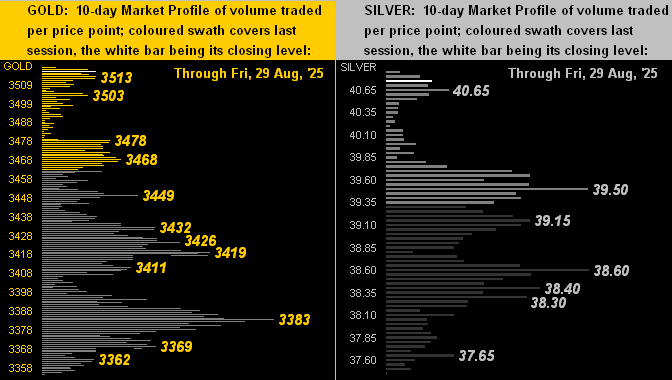
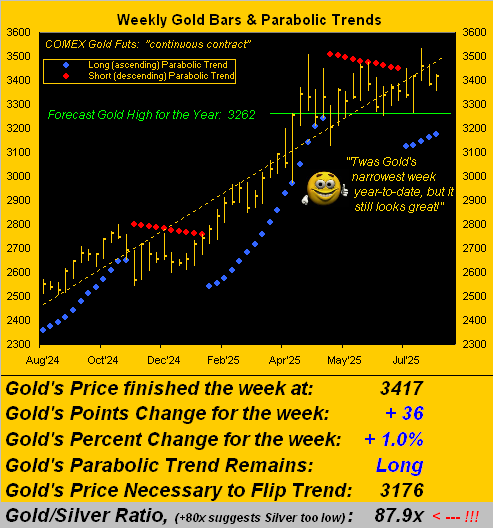
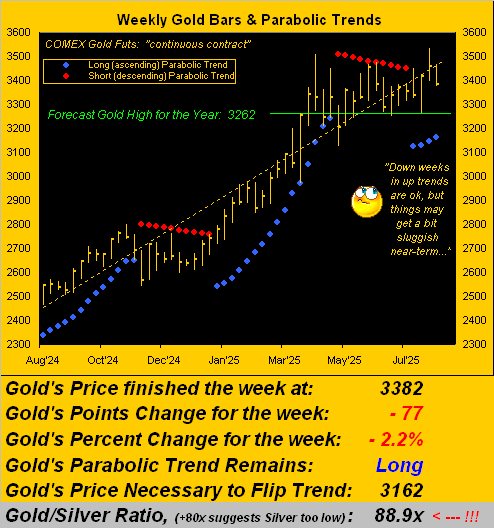
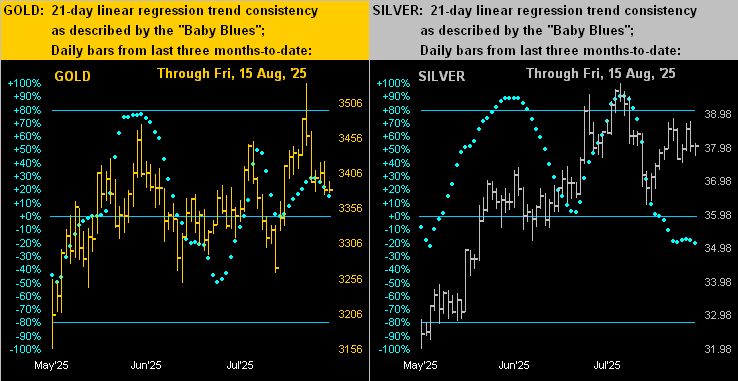
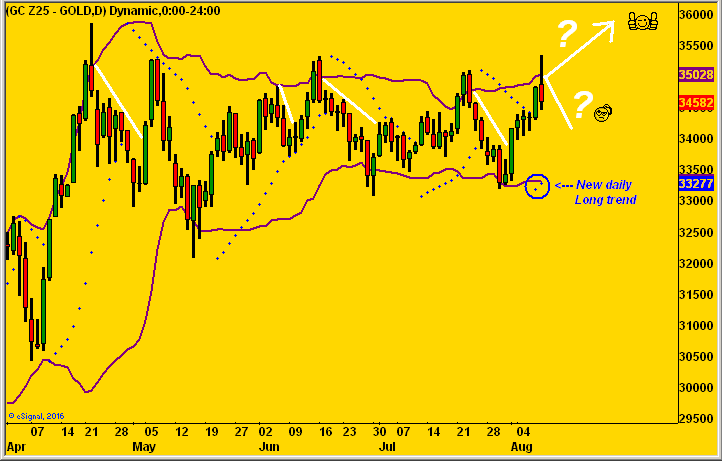
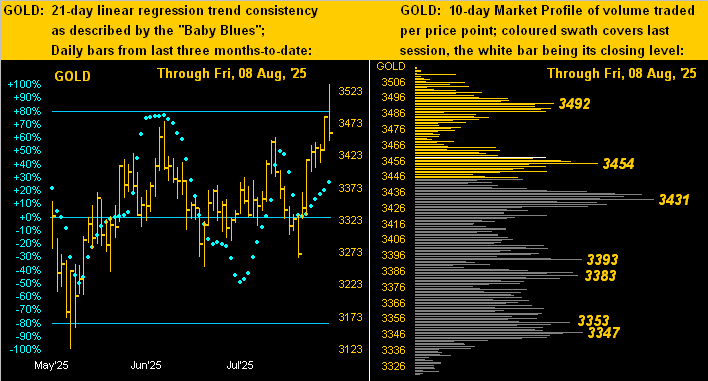
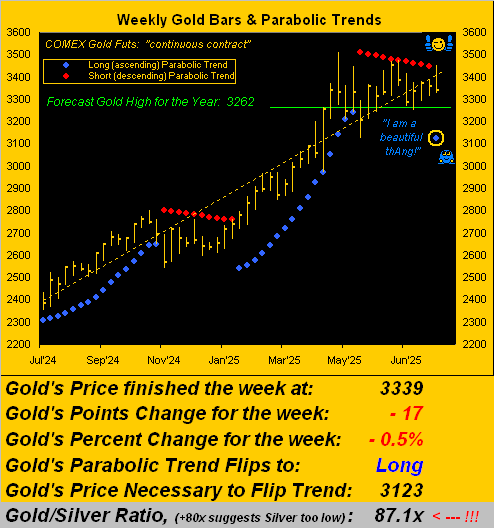
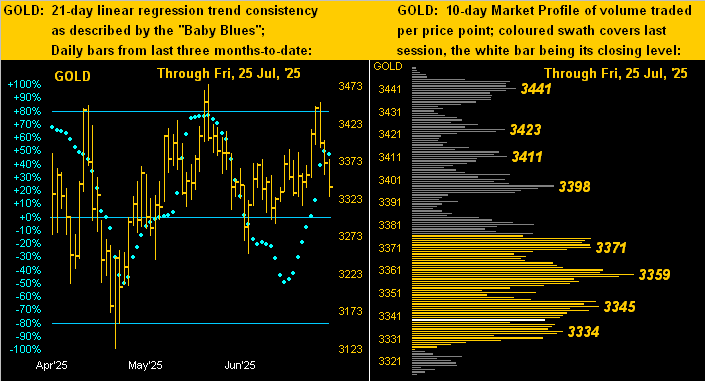
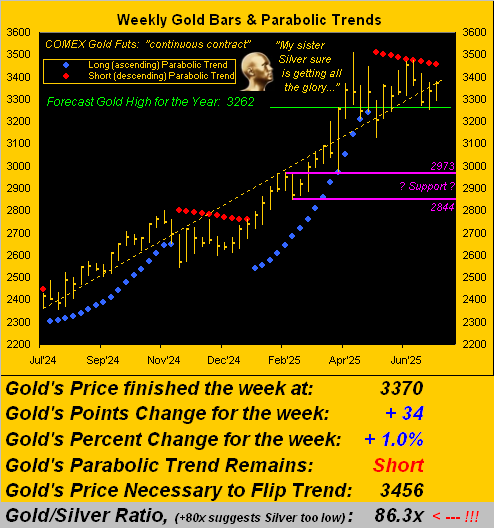
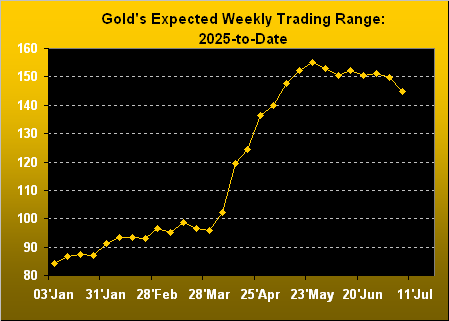
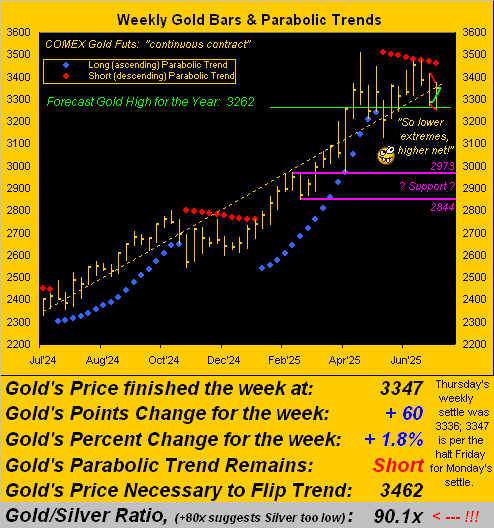
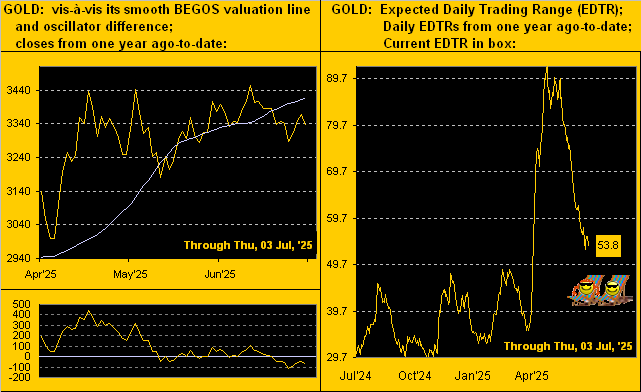
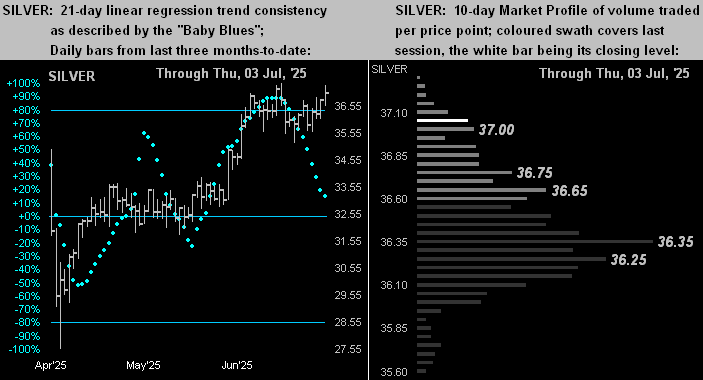
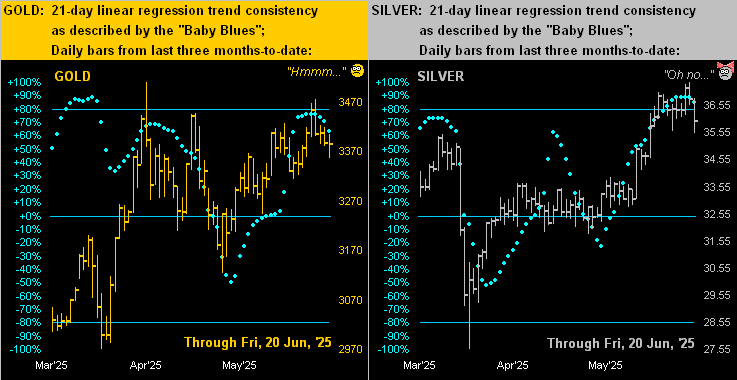
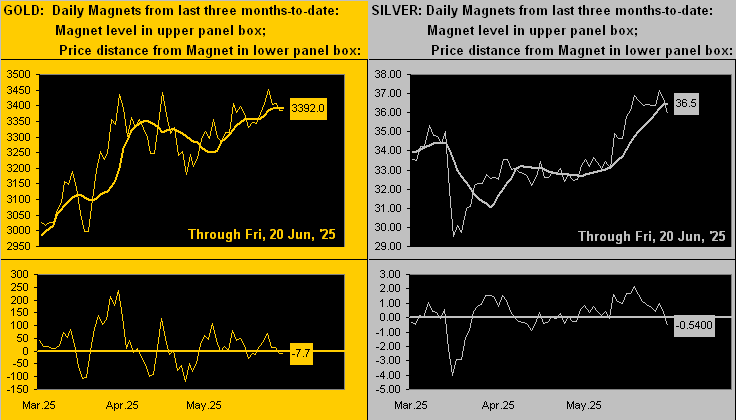
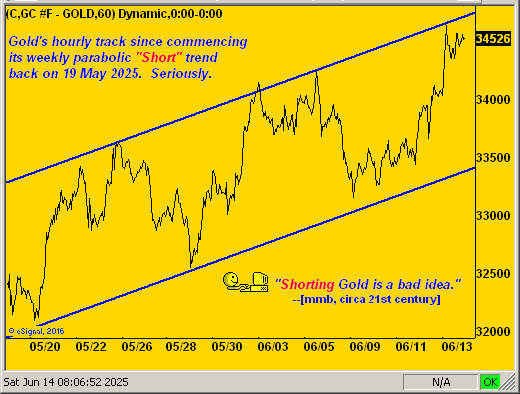
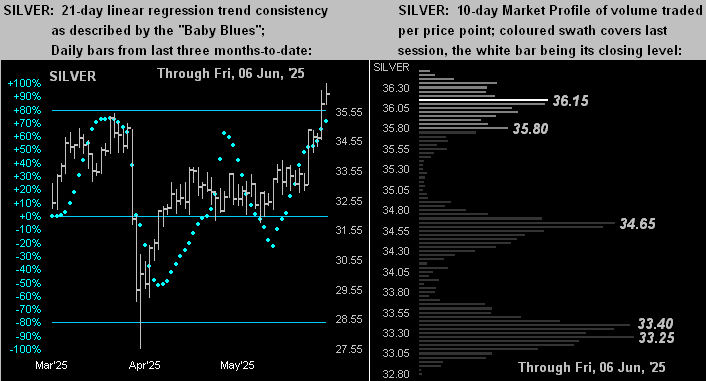
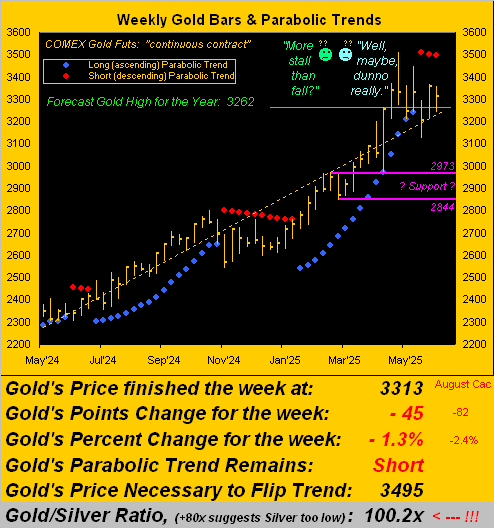
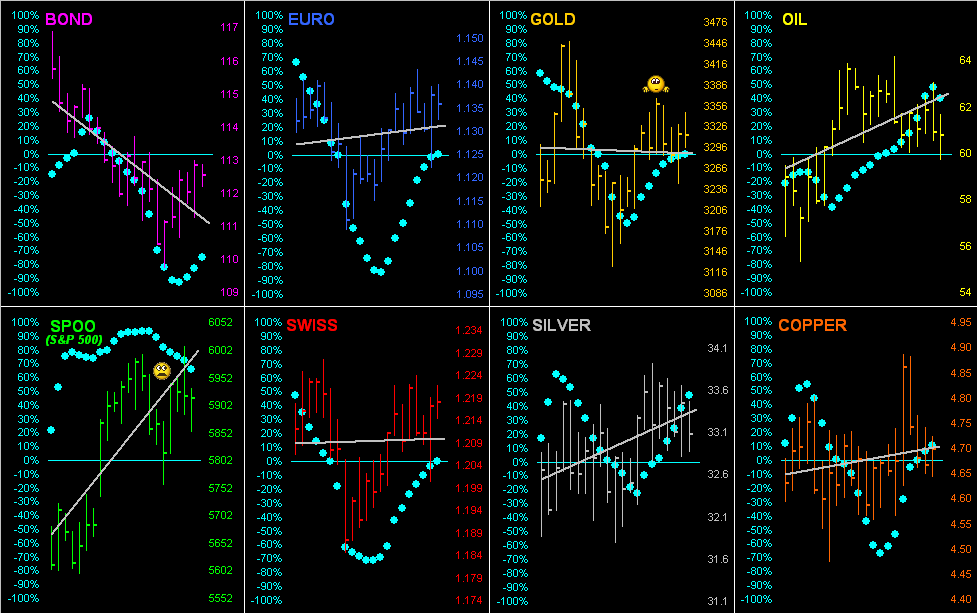
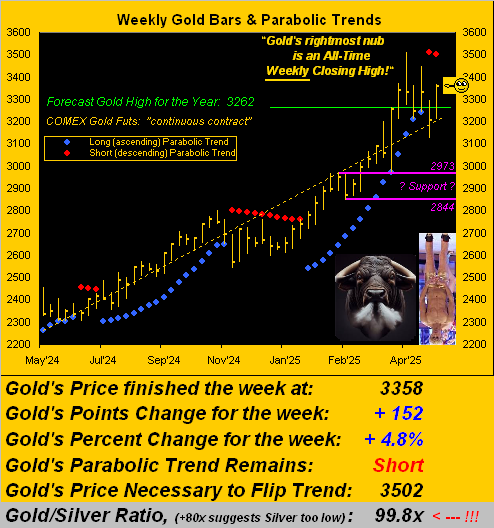
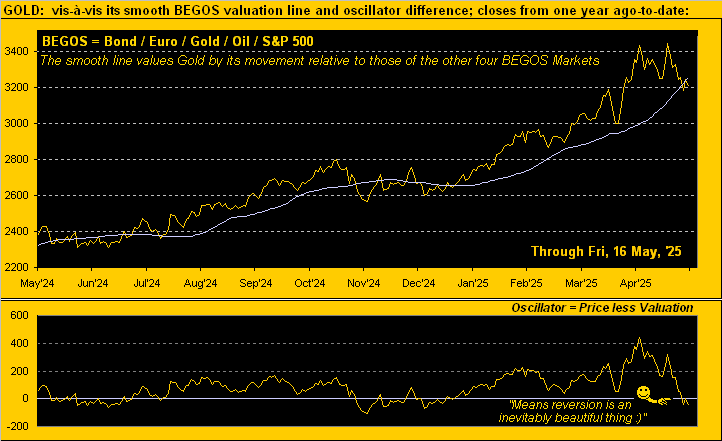
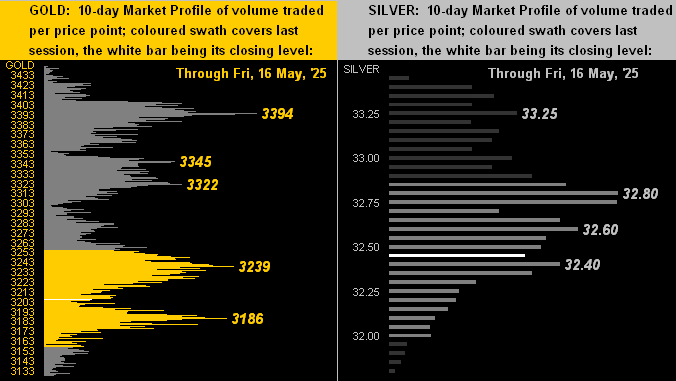
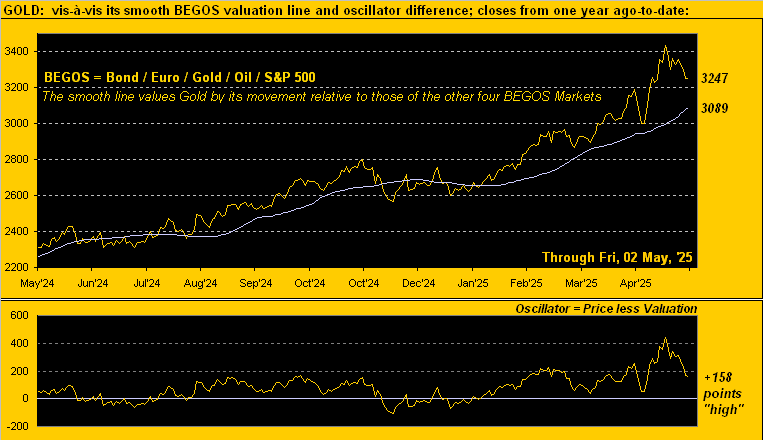
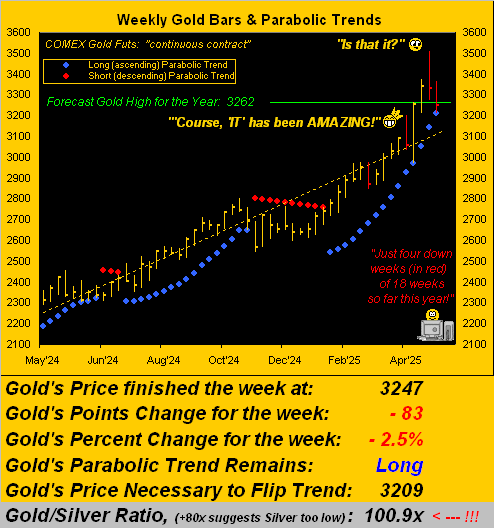
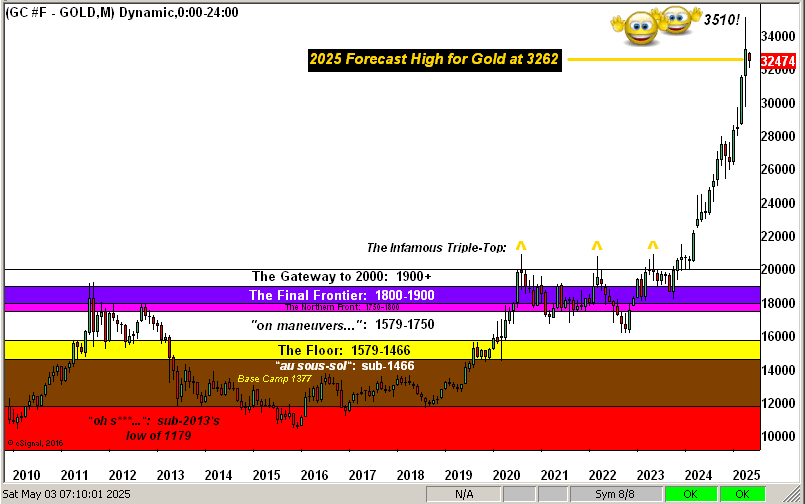
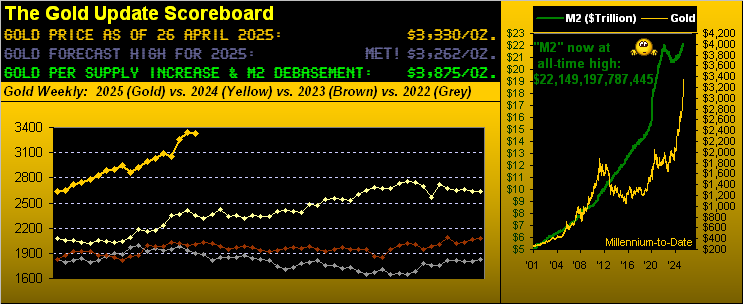
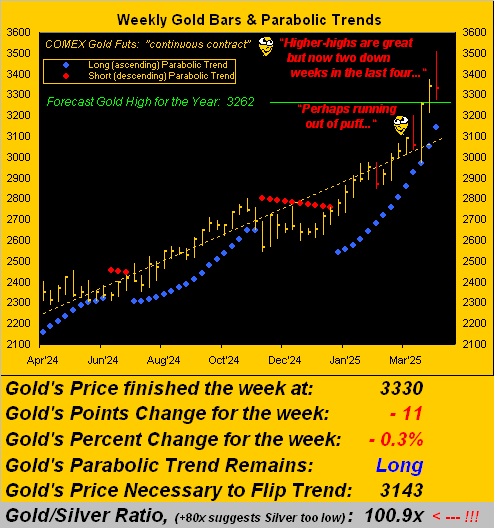
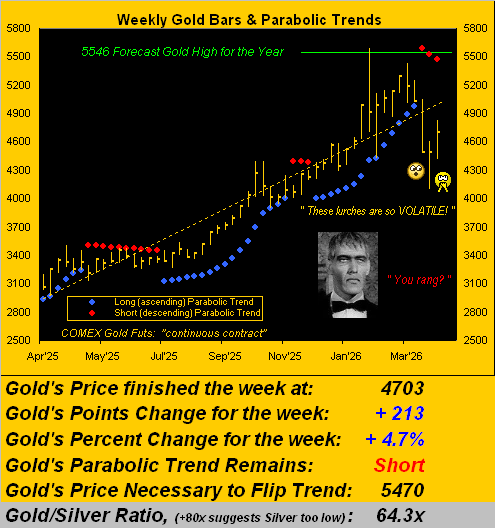
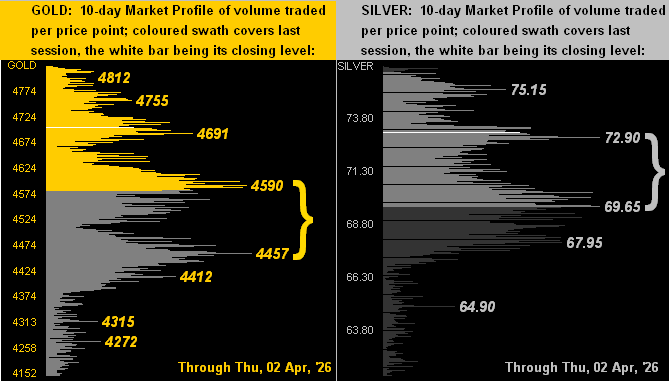
To be sure, Gold’s days are vehemently volatile, indeed as are its weeks per the following year-over-year graphic. The expected weekly trading range for Gold is now 369 points, the daily alone being 196 points. Either way — of which there’s been a lot — the red parabolic Short trend has completed a third dot. But at least Gold’s four-week losing streak is complete, this past week’s +4.7% gain a welcome treat. Moreover, Gold is still “textbook oversold” through the past 13 trading days; that would resolve upon Gold swiftly closing above 4797. ‘Course, by the opening Scoreboard, Gold is nearly -10% below its BEGOS Market Value (5220), but ’tis practically +20% above Fair Value (3930).
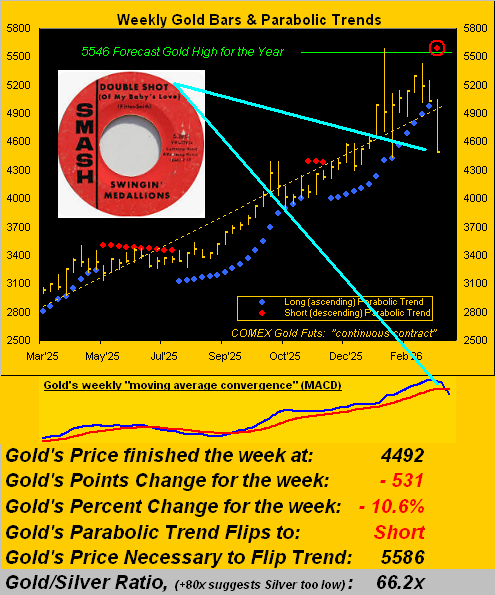
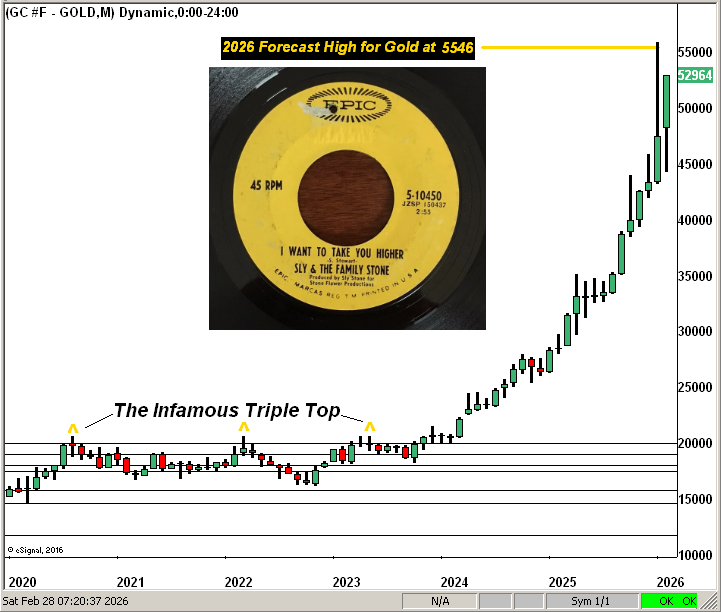
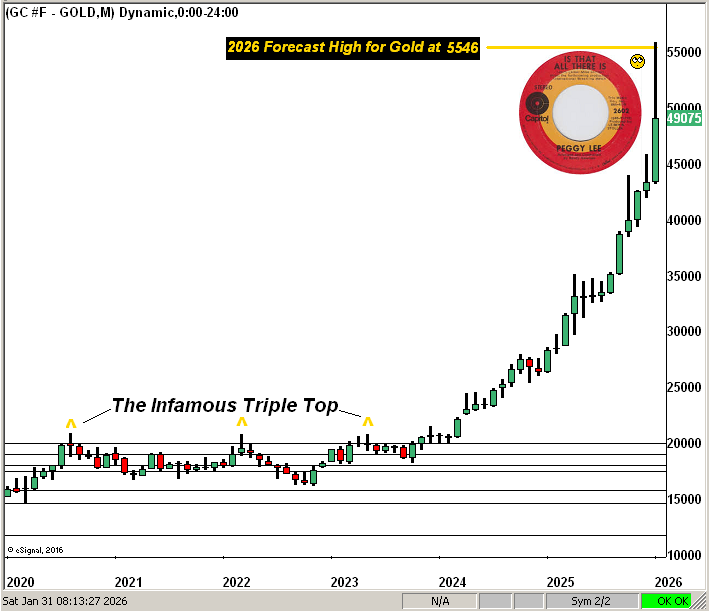
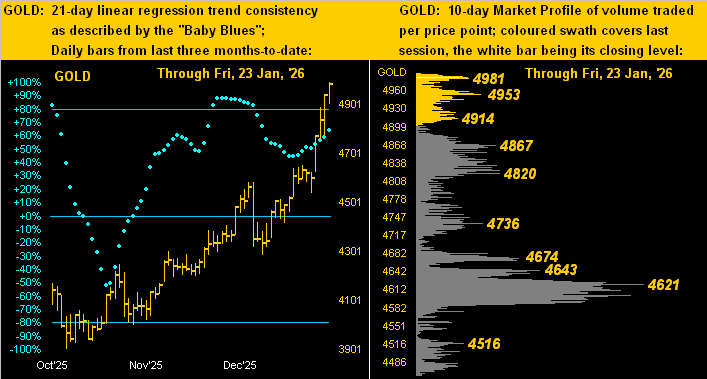
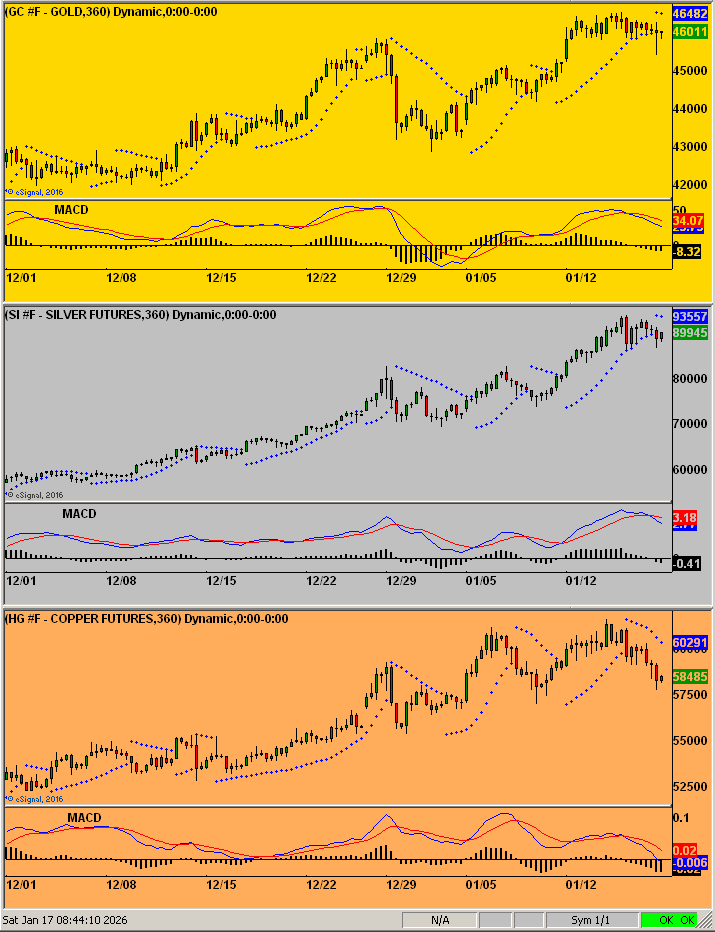
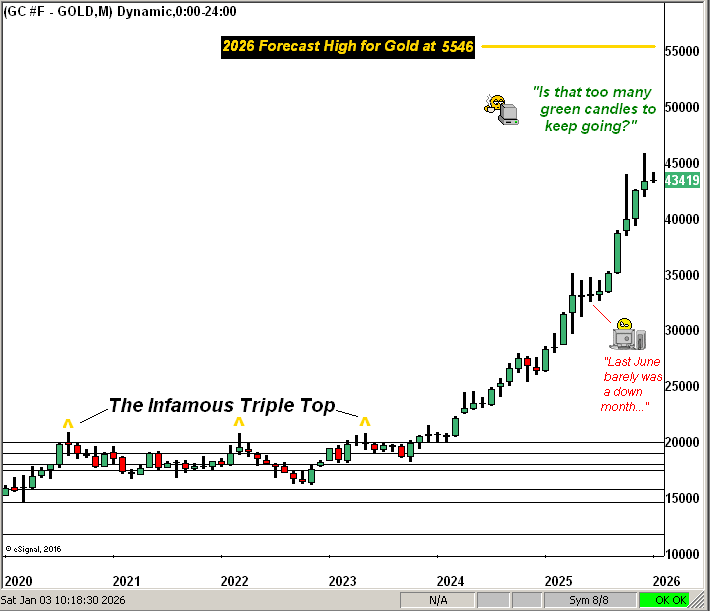
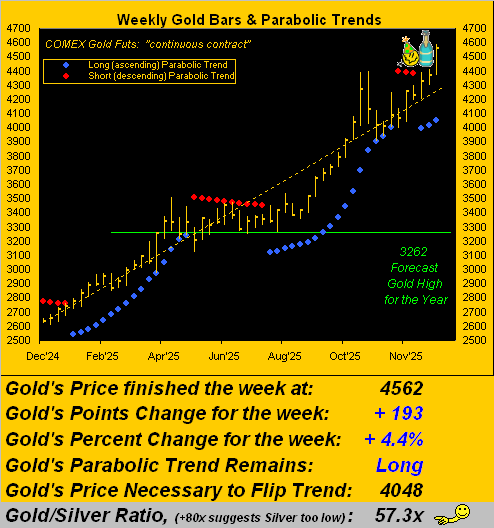
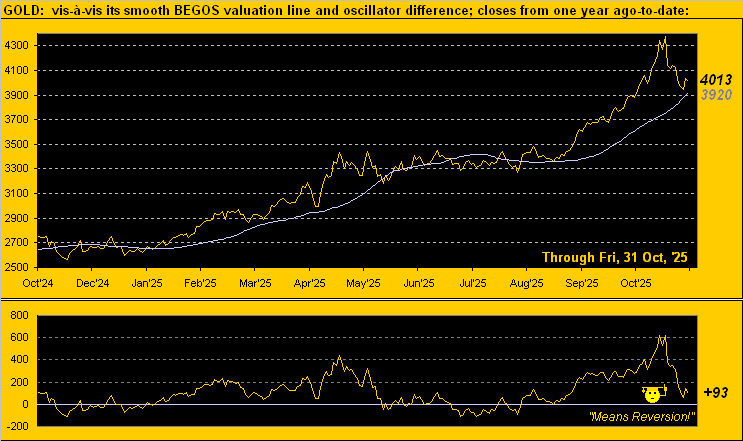
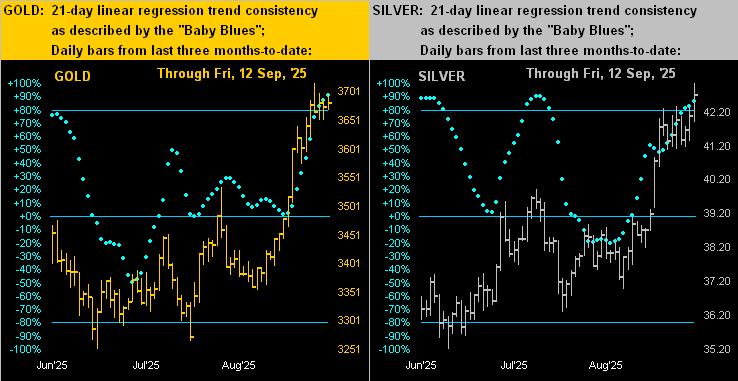
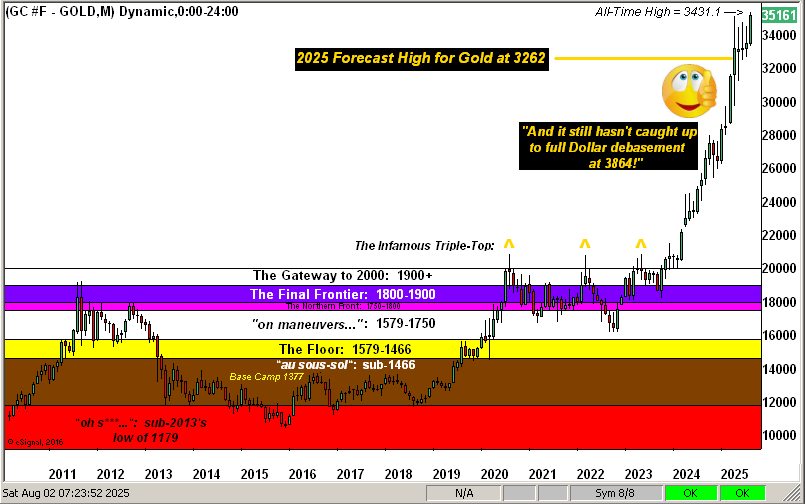
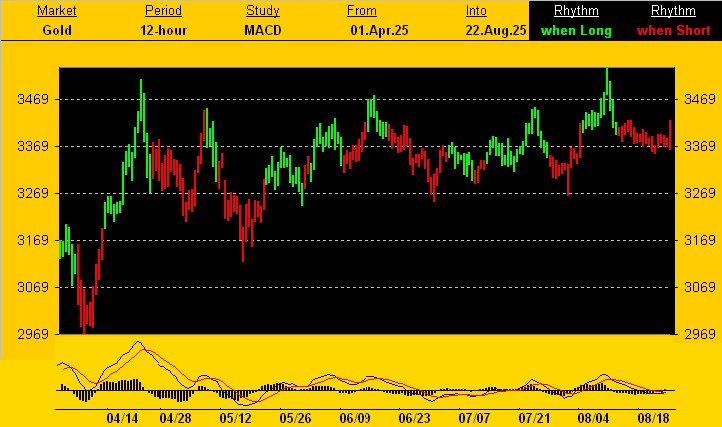
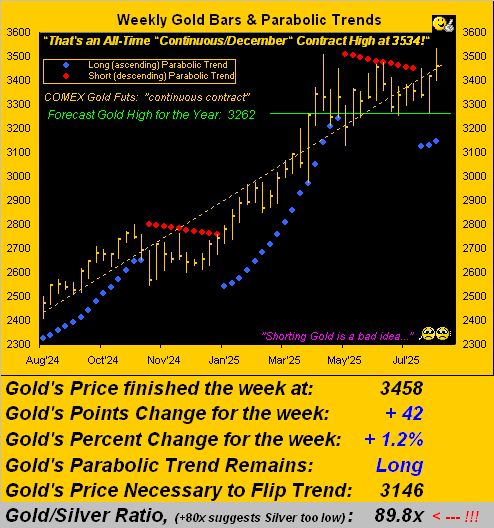
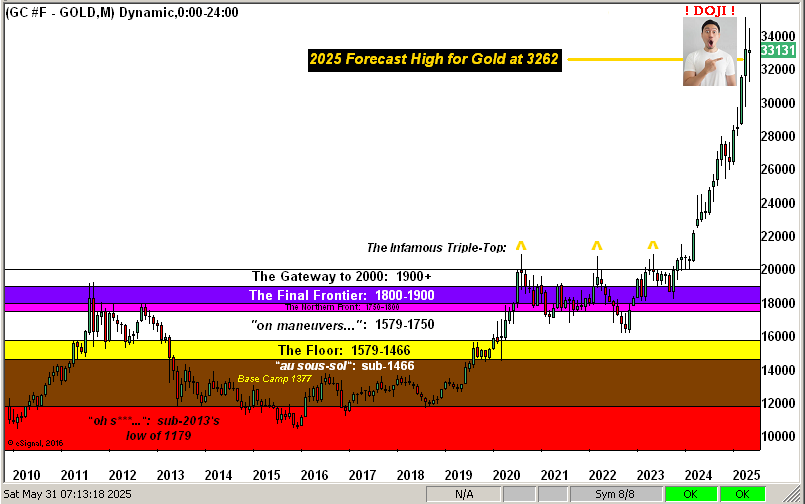
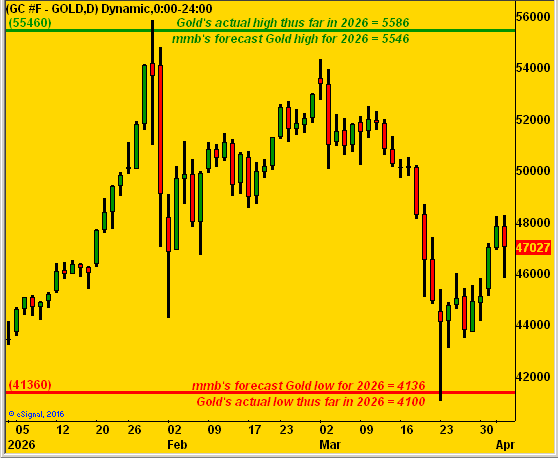
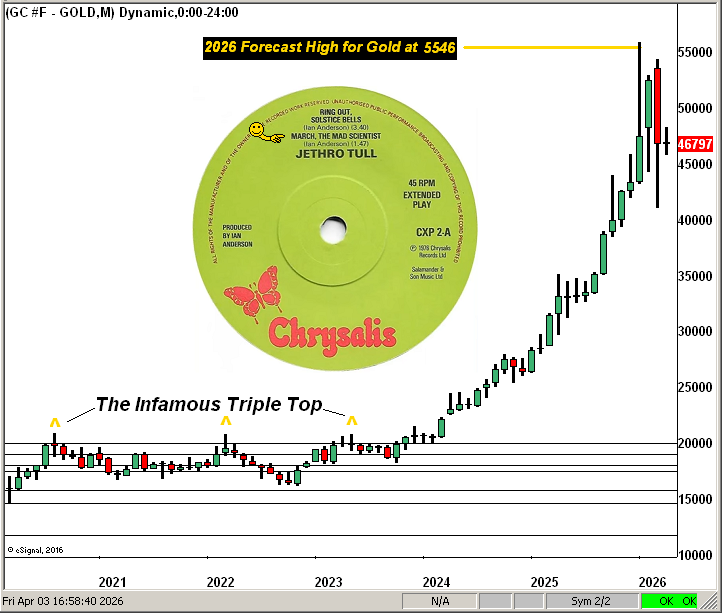
Now again, it being month-end, ’tis our own trend to present Gold by its monthly bars since 2020. And per ![]() “March, the Mad Scientist”
“March, the Mad Scientist”![]() by Jethro Tull from 50 years ago, this past March for the Gold bulls was maddening. ‘Tis the second right-most “candle”, which as jarringly red as it appears, finished March well off the aforementioned 4100 low. Then the right-most wee “doji” is this April’s two trading days pro tanto, (a little Latin lingo there). Here’s the whole show:
by Jethro Tull from 50 years ago, this past March for the Gold bulls was maddening. ‘Tis the second right-most “candle”, which as jarringly red as it appears, finished March well off the aforementioned 4100 low. Then the right-most wee “doji” is this April’s two trading days pro tanto, (a little Latin lingo there). Here’s the whole show:
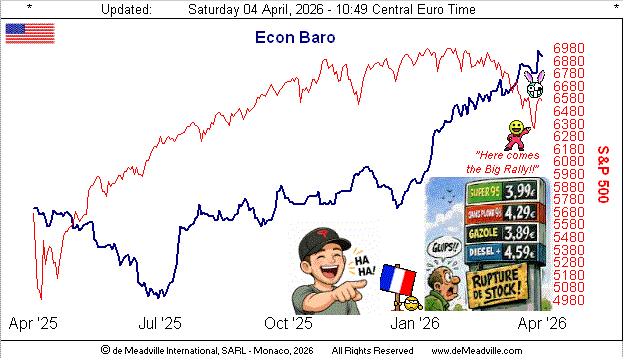
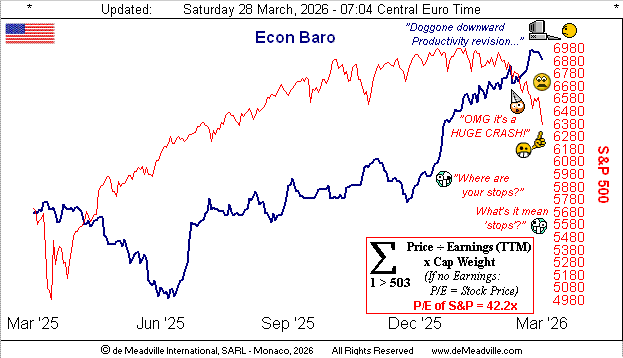
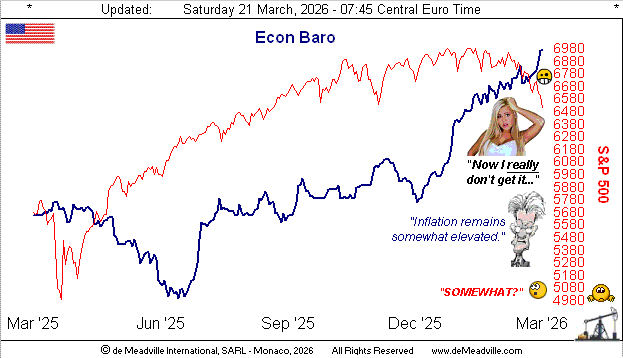
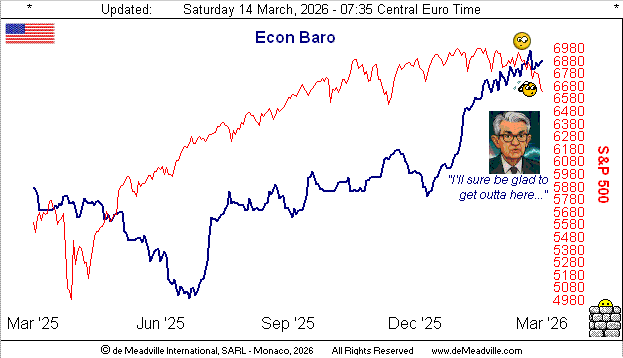
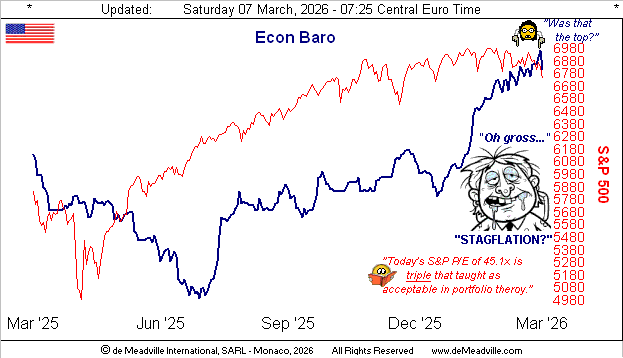
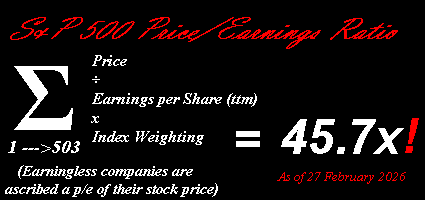
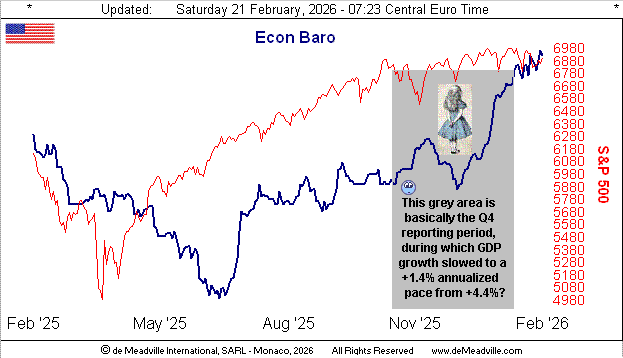
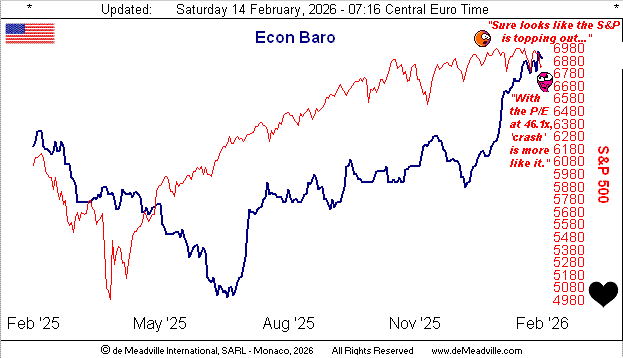
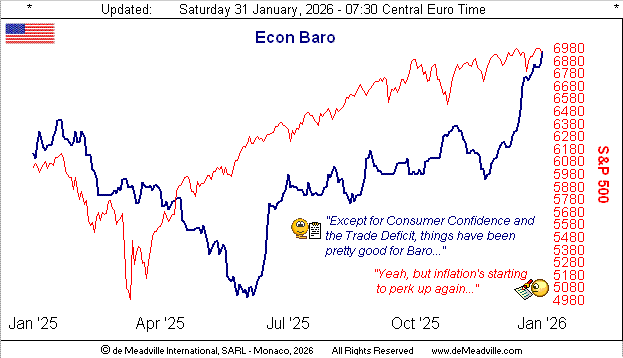
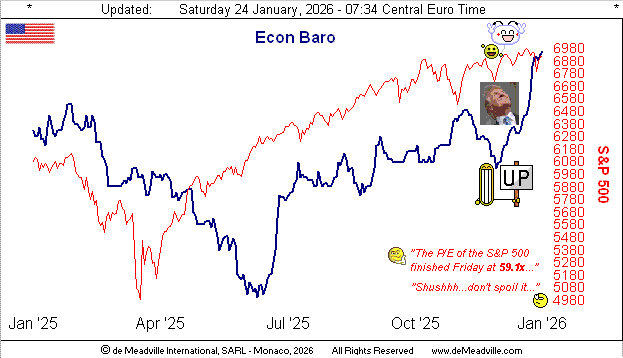
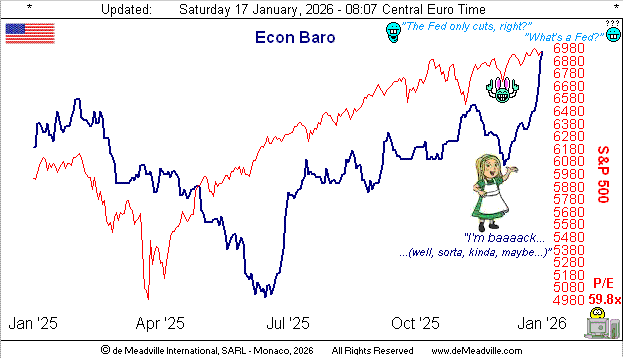
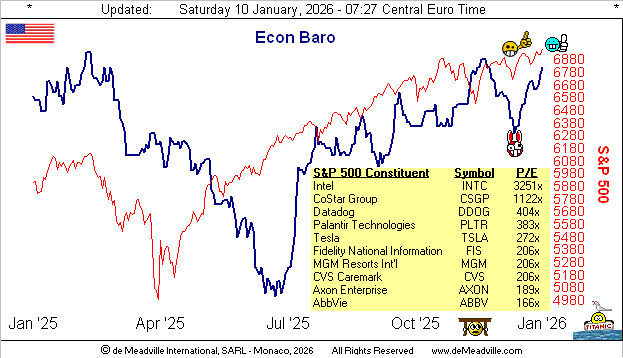
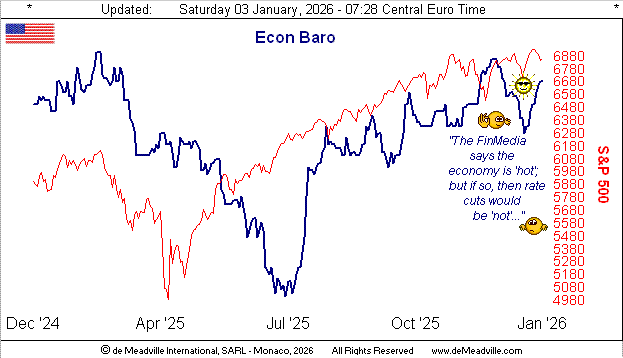
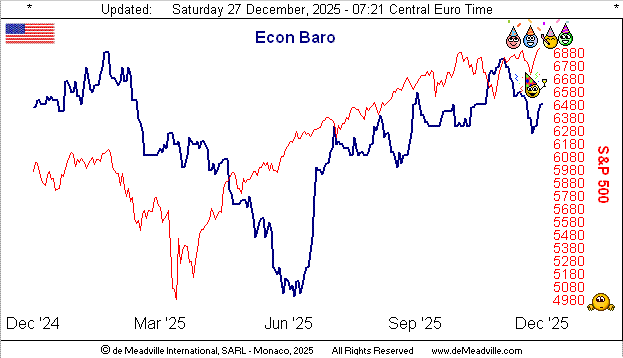
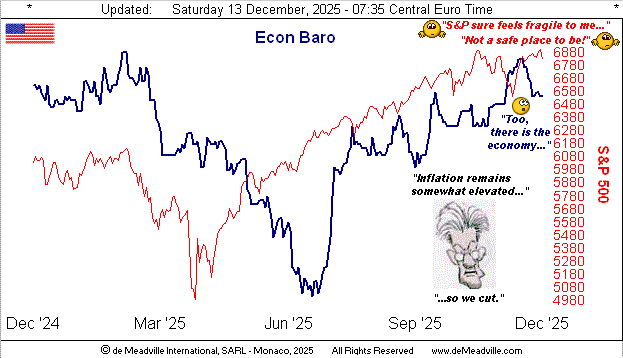
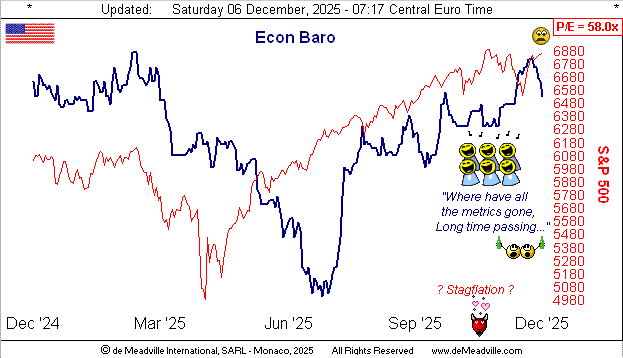
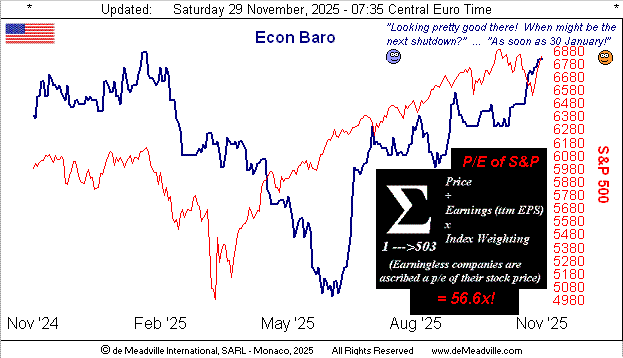
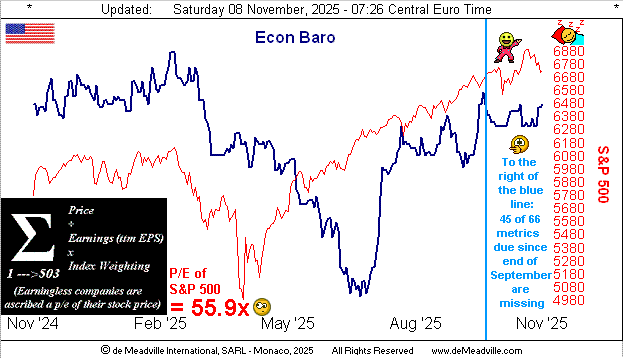
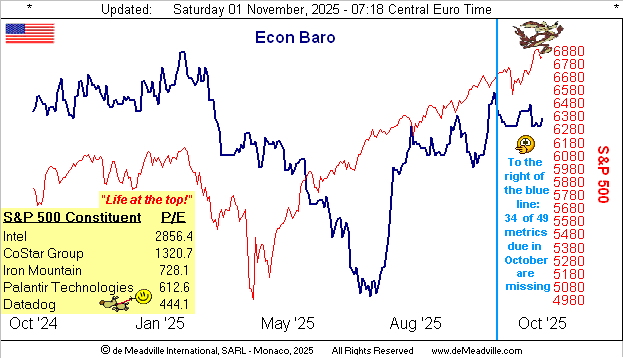
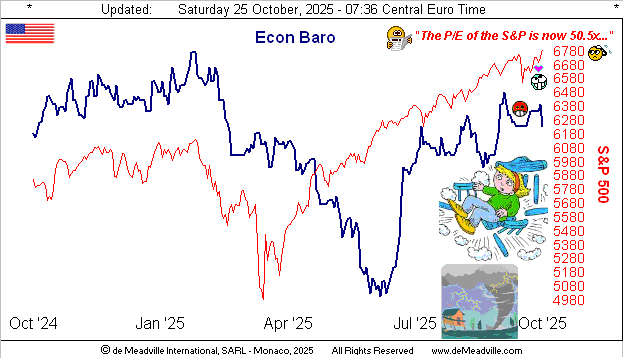
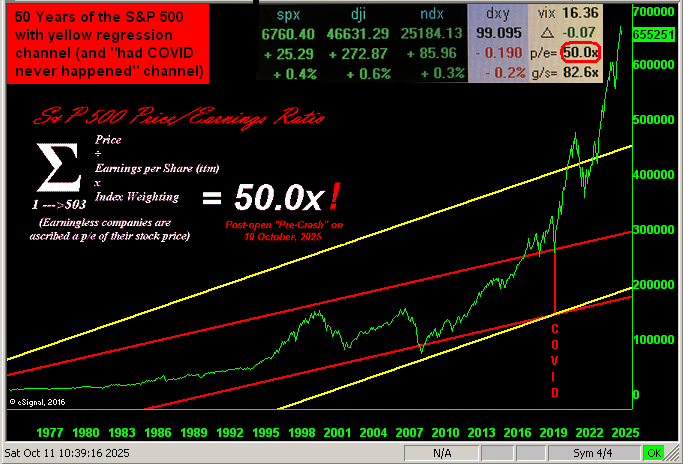
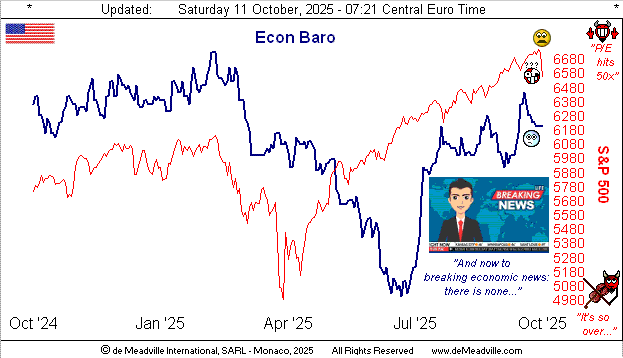
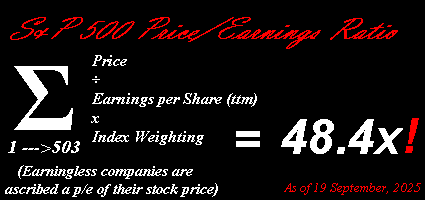
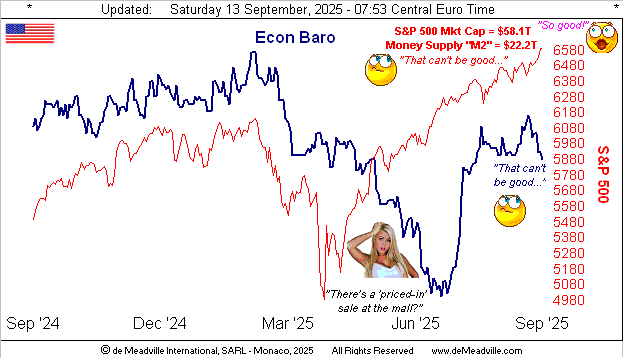
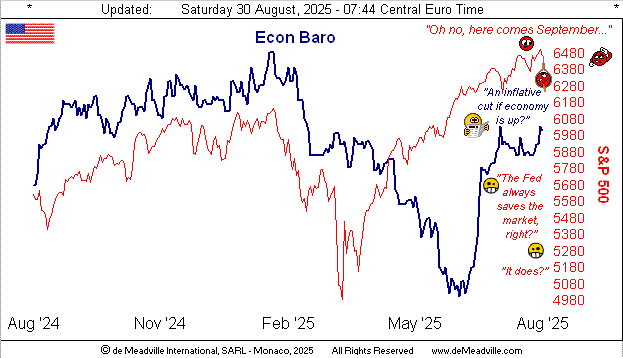
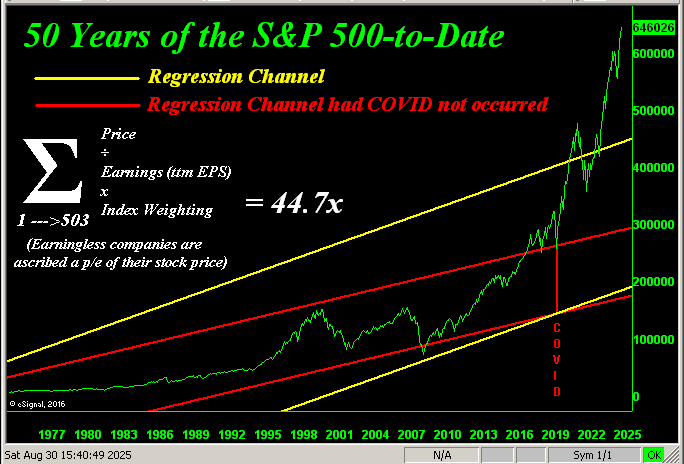
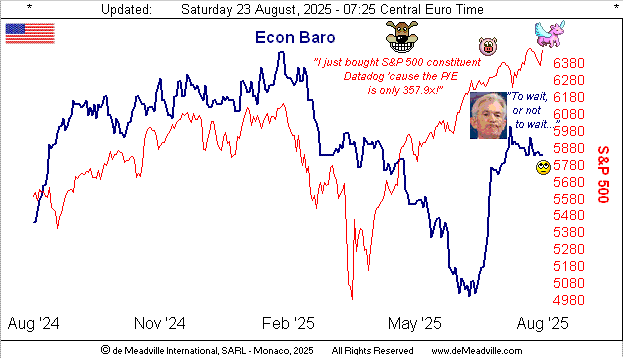
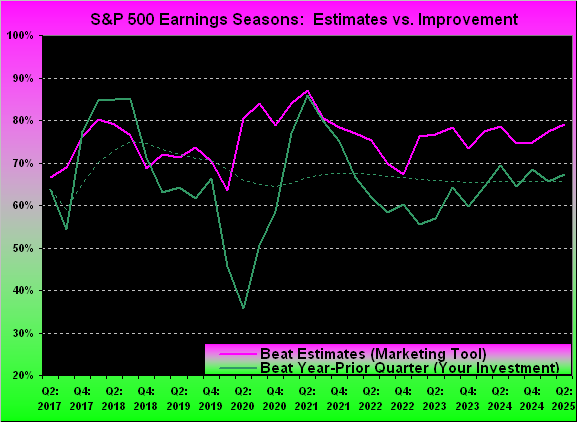
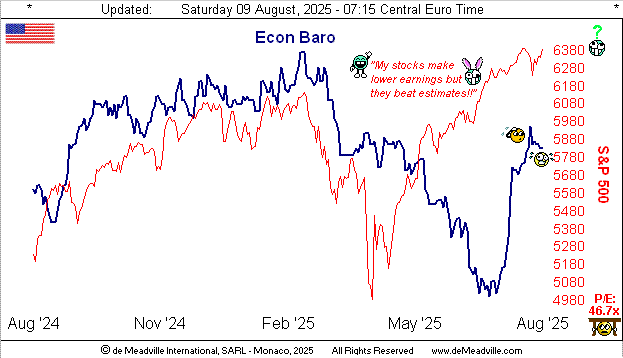
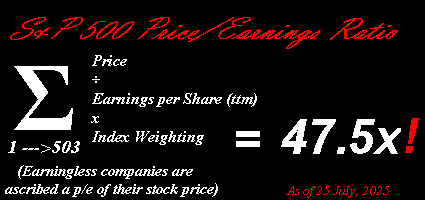
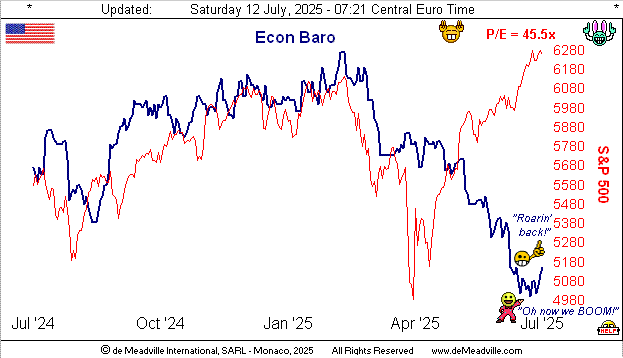
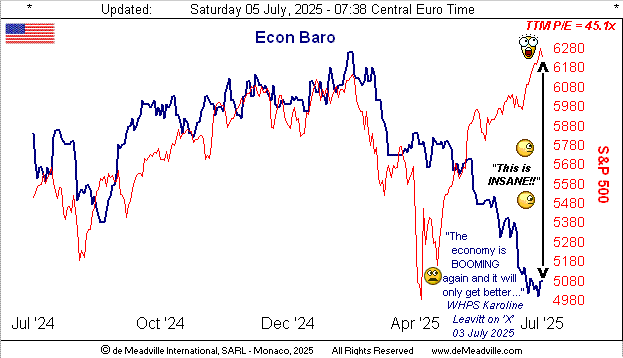
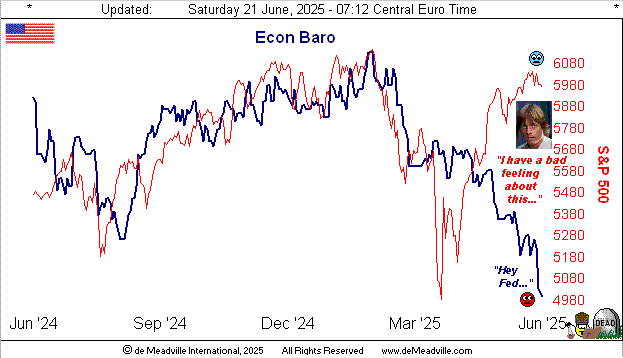
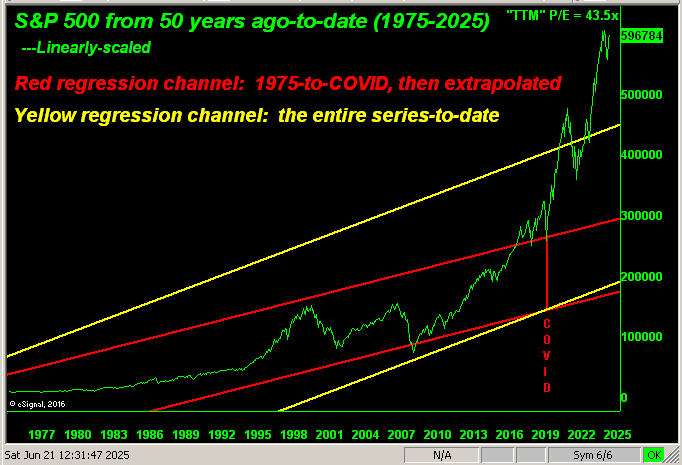
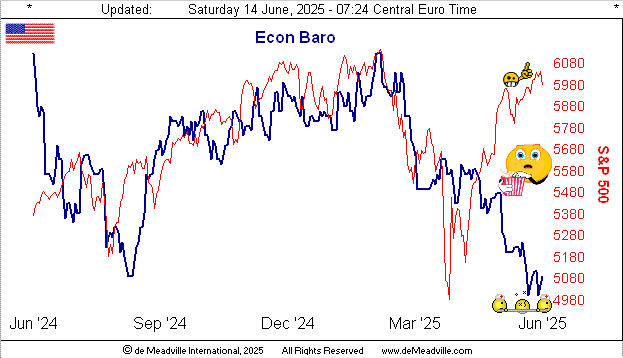
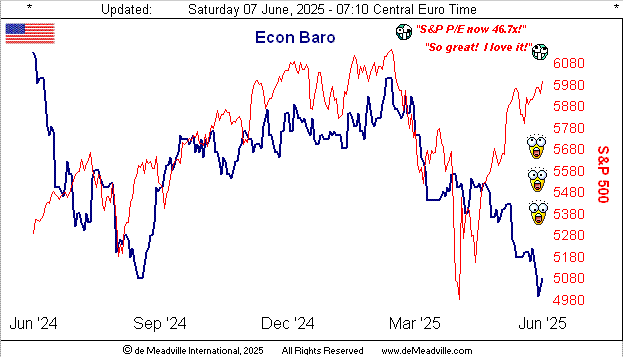
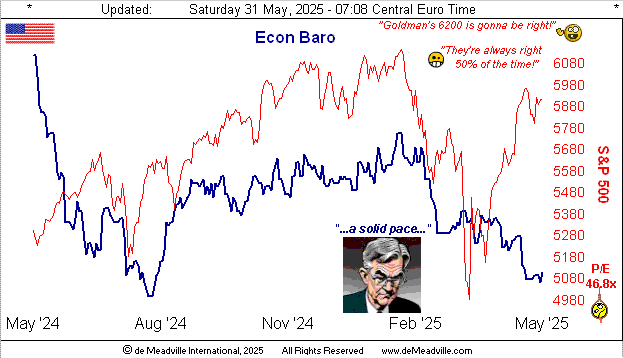
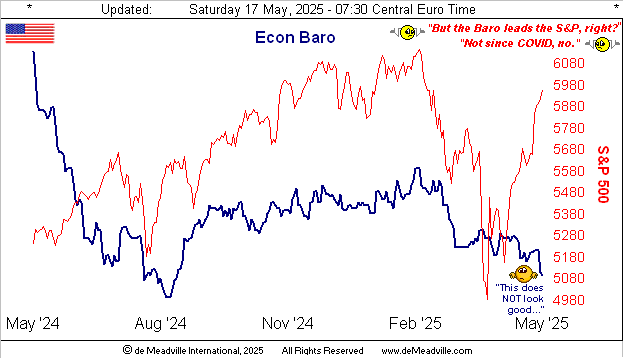
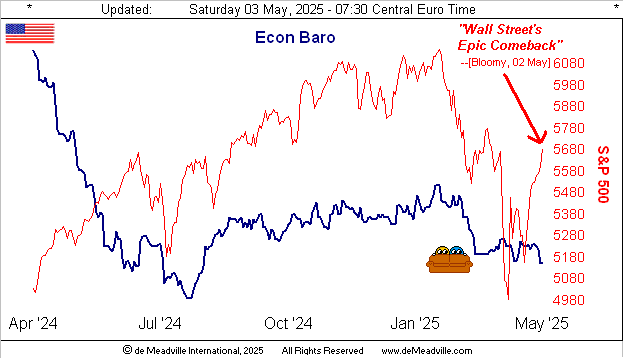
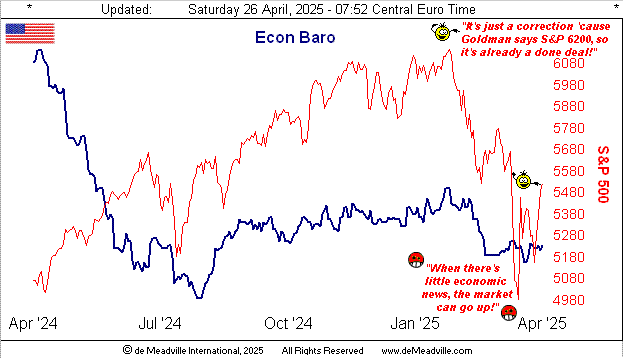
All that said, next week is the commencement of Q1 Earnings Season. You’ll recall those for Q4 found 71% of the S&P’s reporting constituents having improved their bottom lines from the like quarter a year earlier. Can such above average pace be maintained? The Baro suggests yes, but an ongoing energy crisis can eventually erode earnings. ‘Course as we oft quip, if earnings today were properly used as an equities’ valuation tool, the S&P would be half its current level, (the current price/earnings ratio still a whoppingly high 43.5x). But: ’tis different these days (until ’tisn’t).
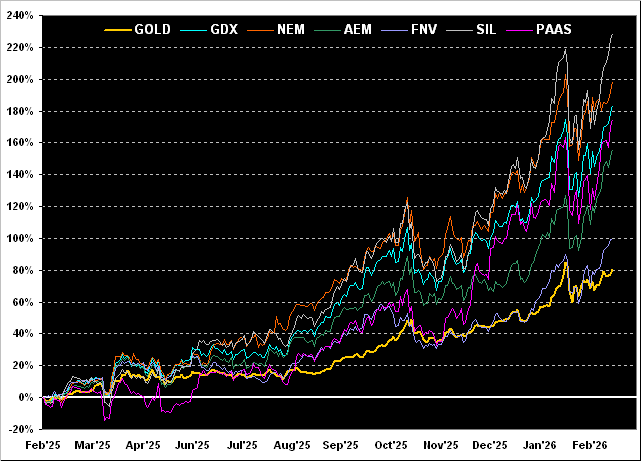
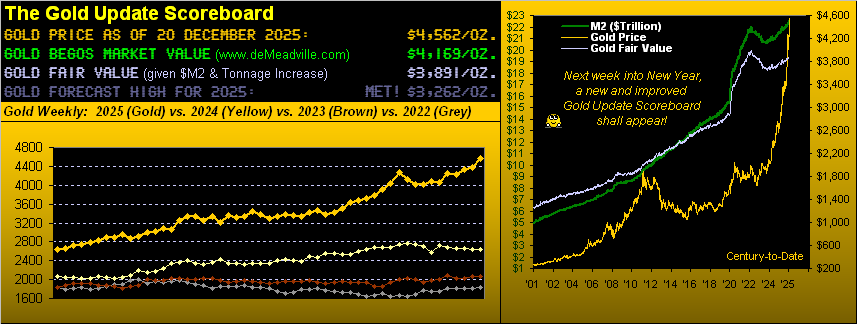
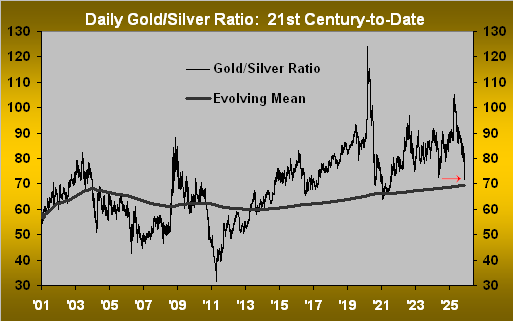
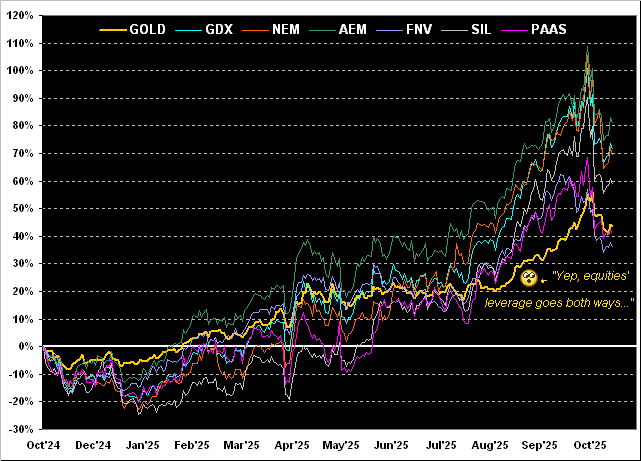
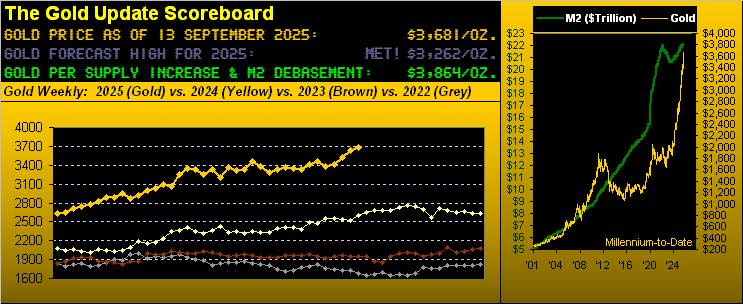
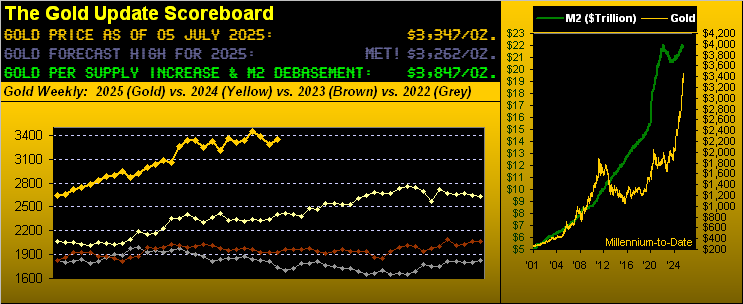
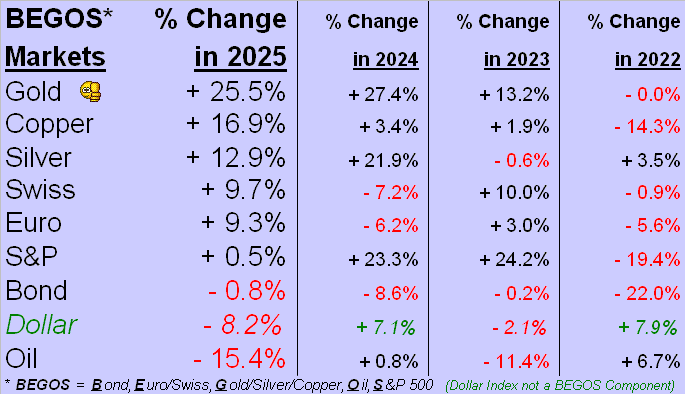
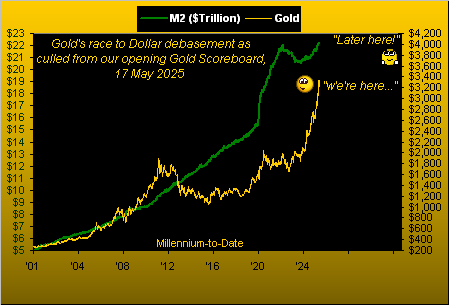
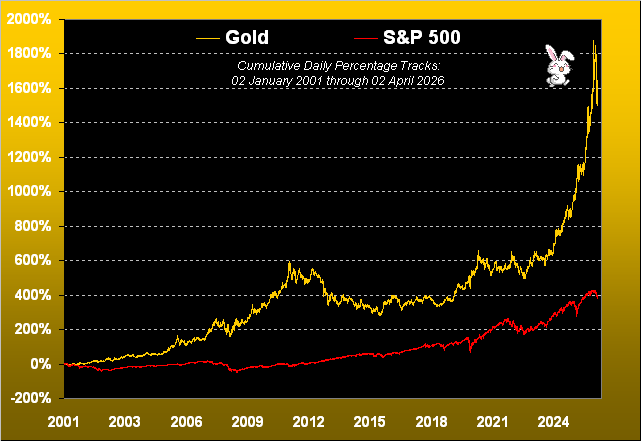
In the meantime — for those of you scoring at home — the S&P 500 (pre-yield) is +399% century-to-date (or with yield, nearly +500%); the yieldless relic — vehemently volatile Gold — is +1,618%.
So what’s in your bunny basket?
Cheers!
…m…
www.TheGoldUpdate.com
www.deMeadville.com
and now on “X”: @deMeadvillePro