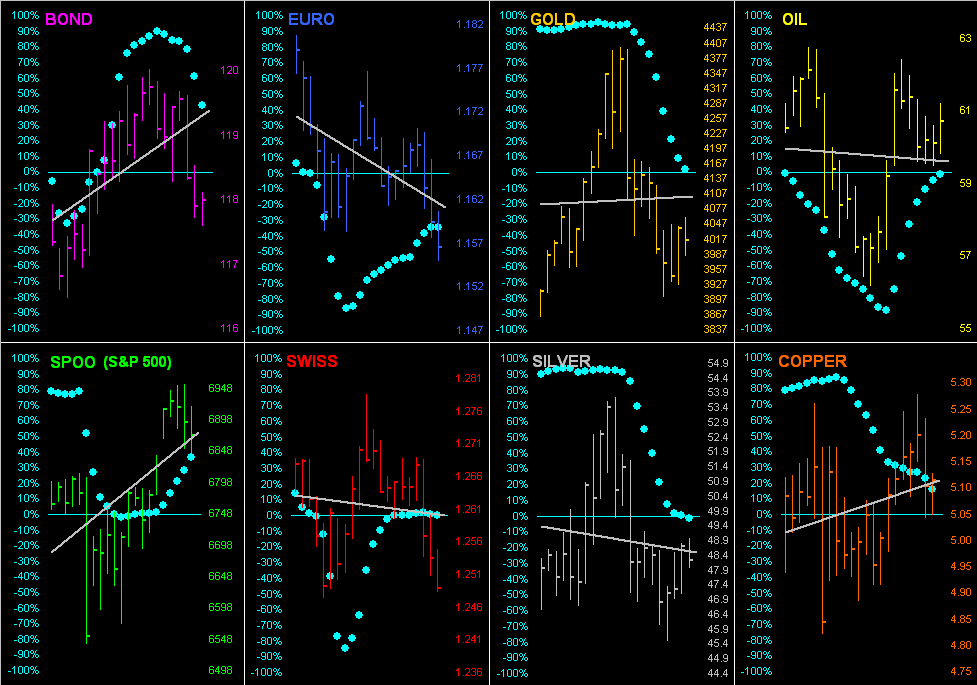
The Spoo is presently below its Neutral Zone for today, whilst above same is Oil; cac volume for Oil is rolling from December into that for January; session volatility for the BEGOS Markets is moderate, with Oil exceptionally having already traced 128% of its EDTR (see Market Ranges). Yesterday, both the Bond and Spoo respectively fell below their most volume-dominant Market Profile support levels and crossed beneath their Market Magnets. Too yesterday, Silver traded to an all-time high at 54.42 and the Gold/Silver ratio looks to finish the week below 80x for the first weekly settle under that level since 12 July ’24: more on all that in tomorrow’s 835th consecutive Saturday Edition of The Gold Update. Due but not necessarily arriving today for the Econ Baro are October’s PPI, Retail sales, and September’s Business Inventories.
 Mark
Mark
13 November 2025 – 08:36 Central Euro Time
Similar to this past Monday, Gold — and especially Silver — recorded very firm trading sessions yesterday: so robust was Silver (+4.2%) that the Gold/Silver ratio was driven down to 78.9x, the lowest reading in better than a year (since 22 Oct ’24). However in a 180° turnabout, Oil — after having seen both its Market Value and Market Magnet measures turn bullish on Tuesday — whirled ‘right back down below both indicators, the -4.2% drop ranking sixth-worst year-to-date. Presently, the Bond is below its Neutral Zone for today, whilst above same are Gold, Silver, Copper and the Spoo; BEGOS Markets’ volatility is pushing toward moderate. StateSide, the government “shutdown” has concluded with 45 metrics missing for the Econ Baro, to the extent they eventually are updated; due as well for today are October’s CPI, Treasury Budget and the prior week’s Initial Jobless Claims, should bureaus be up and running in time to report these items.
12 November 2025 – 08:34 Central Euro Time
Copper and the Spoo are at present above today’s Neutral Zones; the balance of the BEGOS Markets are within same, and session volatility is thus far is mostly light. Looking at Market Rhythms for pure swing consistency, our Top Three on a 10-test basis are the non-BEGOS Yen’s 4hr MACD, the Swiss Franc’s 15mn Moneyflow and Silver’s 6hr Price Oscillator; on a 24-test basis the leaders are Gold’s 4hr Moneyflow, The Euro’s 30mn Moneyflow and Oil’s 4hr Parabolics. Oil yesterday confirmed moves above its smooth valuation line (see Market Values) and Market Magnet; by Market Profiles, Oil’s notable volume-dominant supports are 60.60 and 60.10, however there is resistance at 61.00. ‘Tis again a day without scheduled metrics due for the Econ Baro, (irrespective of the StateSide government “shutdown” which may be finally resolved fairly quickly).
11 November 2025 – 08:43 Central Euro Time
Presently, all eight BEGOS Markets are within their respective Neutral Zones for today, and session volatility is light. Yesterday’s firm up moves for the precious metals from their basing processes were sufficient to now find their “Baby Blues” of linreg consistency (see Market Trends) having turned higher in real-time, albeit the actual linreg trends remain negative; nonetheless, on a points basis, yesterday was Gold’s second-best net gain (+116) for the year-to-date and for Silver (+2.18) third-best; by percentage, the day ranked sixth-best for Gold (+2.9%), and again third-best for Silver (+4.5%); by their Market Profiles, Gold (currently 4136) finds its nearest notable volume-dominant support at 4087, whilst for Silver (currently 50.50) ’tis 49.90. Yesterday’s +1.5% gain for the S&P 500 was further supported by a 2.1% gain in its MoneyFlow as regressed into S&P points; however, the “live” (futs-adj’d) P/E is a treacherous 57.7x. Again, nothing for the Econ Baro is scheduled for today.
10 November 2025 – 08:44 Central Euro Time
Indications are the StateSide government “shutdown” may be resolved this week; that noted, no regularly scheduled metrics are due for the Econ Baro until Thursday; and since the start of the “shutdown” 45 metrics remain missing. For the BEGOS Markets at this instant, the Bond is below its Neutral Zone for today, whilst above same are the three elements of the Metals Triumvirate, Oil and the Spoo, and session volatility is moderate. Even as by Market Trends the “Baby Blues” of linreg consistency continue to fall for both Gold and Silver, The Gold Update points to the precious metals as having been basing, and both are well up today. There are two weeks still to run in Q3 Earnings Season, and although year-over-year improvement on balance is running at an above-average pace with a median bottom-line increase of +9.4%, earnings essentially need to double to get the P/E of the S&P 500 ( the “live” reading 56.3x) down to a far more realistic valuation.
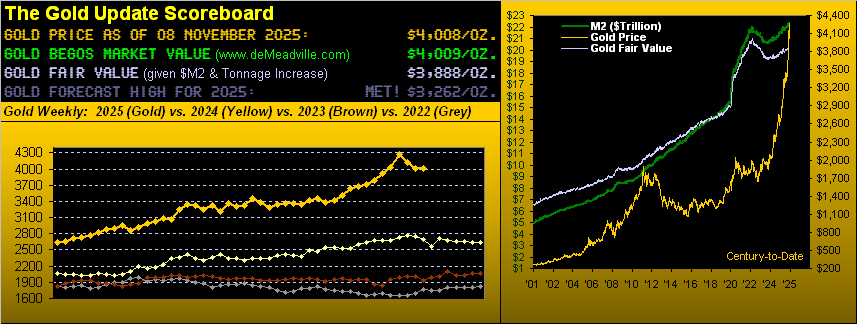
The Gold Update: No. 834 – (08 November 2025) – “Gold (Yes Really) Records a Third Consecutive Down Week”

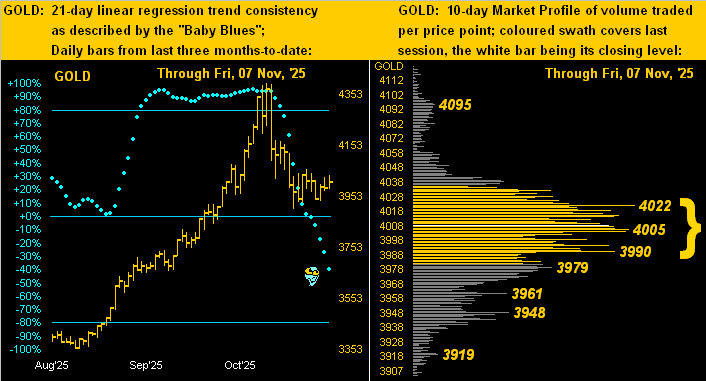
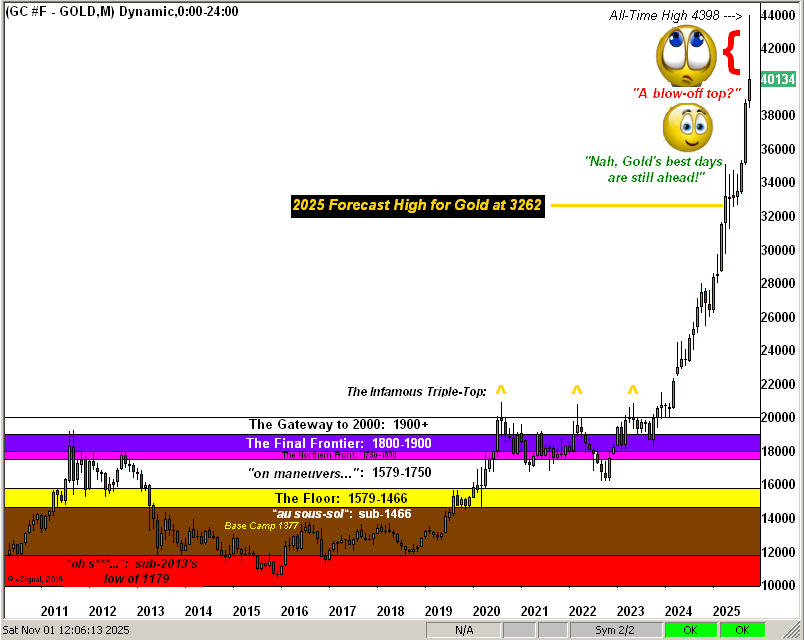
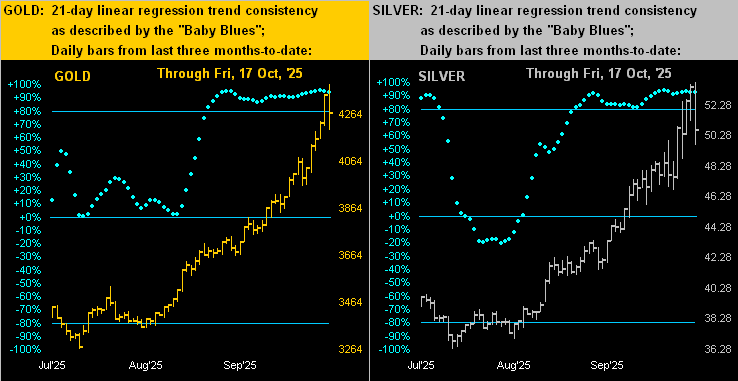
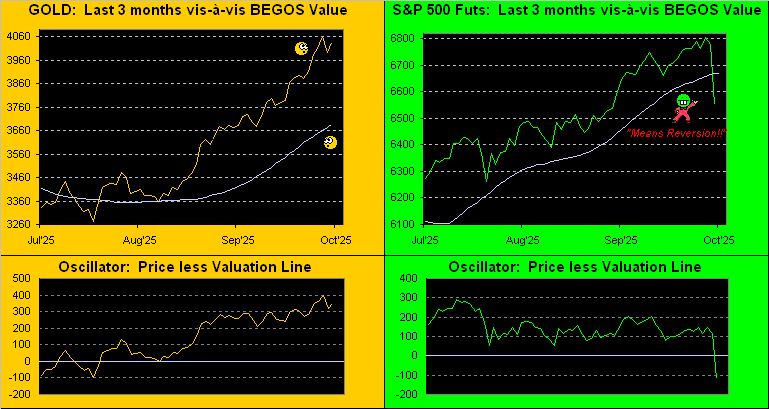
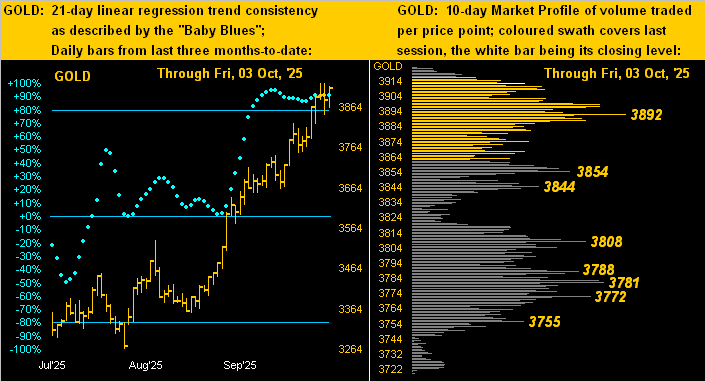
Irrespective of how “long” continues this parabolic Long trend, Gold’s “other” blue dots — indeed those “Baby Blues” that depict the consistency of trend — are in full plummet as next displayed at lower left for price’s daily bars from three months ago-to-date. And you regular readers well know the tune: ![]() “Follow the Blues instead of the news, else lose yer shoes”
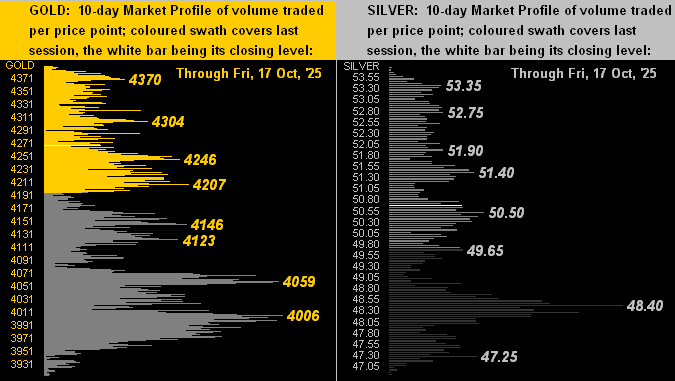
“Follow the Blues instead of the news, else lose yer shoes”![]() –[mmb, circa 2000 A.D.] But as leerily leading are the Blues, price again is basing more than further falling, having already come well off the 4398 All-Time High. As well by the 10-day Market Profile at lower right, Gold looks nicely nested in that “fat” volume-dominant trading zone spanning as braced from 4022 down to 3990:
–[mmb, circa 2000 A.D.] But as leerily leading are the Blues, price again is basing more than further falling, having already come well off the 4398 All-Time High. As well by the 10-day Market Profile at lower right, Gold looks nicely nested in that “fat” volume-dominant trading zone spanning as braced from 4022 down to 3990:
As for Q3 Earnings Season (with still two weeks to run), year-over-year results have increased at an above-average pace: 71% of the 428 reporting S&P 500 constituents have improved their respective bottom lines from Q3 a year ago; typically ’tis only around 66%. That’s the Good News.
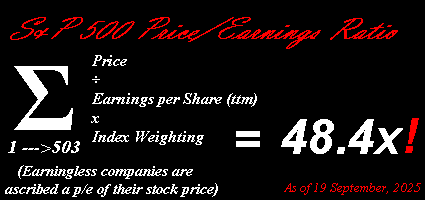
Now for the Bad News: the median earnings per share gain (encompassing 420 constituents with positive earnings from both a year ago and now) is +9.4%; such improvement instead ought be ’round +100% just to get the price/earnings ratio back down to some reasonable valuation and the yield (1.172%) more competitive with three-month U.S. annualized dough (3.757%). For as shown in the above graphic, such p/e is presently 55.9x, (the formula provided for proof). “AI” (“Assembled Inaccuracy”) begs to differ with 29.3x; but as we’ve stated before, if actually fed that formula, “AI” replies ’tis incapable of obtaining the answer.
Thus be it the “Look Ma! No Earnings!” crash or the “Look Ma! No Money!” crash, we — as do many others with whom we communicate — await the inevitable S&P “Dash for Cash!” crash. After all, given the S&P’s current market capitalization of $59.5T supported by a liquid money supply (“M2” basis) of “only” $22.4T, ’twill be a heckova train wreck … perhaps further derailed by Gold?

Cheers!
…m…
www.TheGoldUpdate.com
www.deMeadville.com
and now on “X”: @deMeadvillePro
07 November 2025 – 08:53 Central Euro Time
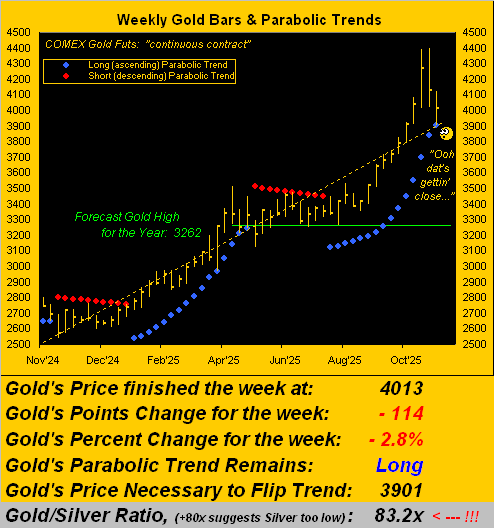
At present we’ve the Bond, Euro and Swiss Franc below their respective Neutral Zones for today; above same are Gold, Silver and Oil, and session volatility for the BEGOS Markets is moving toward moderate. Gold, currently 4013, is net “unch” for this week: ’tis the line in the sand to avoid a third straight down week; more of ‘course, in tomorrow’s 834th consecutive Saturday edition of The Gold Update. At Market Trends, save for Copper and Oil, the “Baby Blues of linreg consistency are falling for the sixth other BEGOS components. For all eight markets, their best pure swing Market Rhythms are as follows: Bond 30mn Moneyflow, Euro and Swiss Franc their 4hr MACDs, Gold 4hr Price Oscillator, Silver 6hr Price Oscillator, Copper 2hr Parabolics, Oil 2hr Price Oscillator, and Spoo 15mn MACD. The StateSide government “shutdown” shall preclude today’s release of October Payrolls data; but awaiting the Econ Baro is the UofM Sentiment Survey for October, plus late in the session September’s Consumer Credit.
06 November 2025 – 08:34 Central Euro Time
The Euro plus the three element of the Metals Triumvirate are presently above today’s Neutral Zones; the balance of the BEGOS Markets are within same, and volatility is light. By Market Trends, linregs are positive for Copper, Oil and the Spoo, and negative for the Bond, Euro, Swiss Franc, Gold and Silver. That noted, yesterday Gold crossed back above its Market Value and Silver back above its Market Magnet; the yellow metal’s best Market Rhythm for pure swing consistency currently is the 4hr Price Oscillator, whilst for the white metal ’tis the 15mn Moneyflow. And the Bond yesterday moved below its most volume-dominant Market Profile support (117^14, price now 116^17). As the StateSide “shutdown” continues, the following metrics due today for the Econ Baro shall go missing: Q3’s Productivity and Unit Labor Costs, September’s Wholesale Inventories, and the prior week’s Initial Jobless Claims.
05 November 2025 – 08:39 Central Euro Time
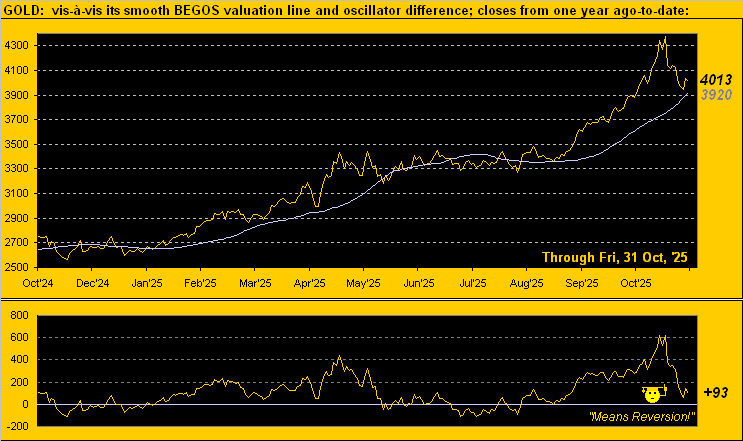
Both Gold and Silver are at present above today’s Neutral Zones, whilst below same is the Spoo; session volatility for the BEGOS Markets is moderate. Whilst higher today, the precious metals’ “Baby Blues” of linreg consistency continue to cascade (see Market Trends). Notably by Market Values, Gold finally has fully reverted to its smooth valuation line after having been above it for 53 consecutive trading days (since 20 August); by its Market Profile, Gold’s most volume-dominant zone of overhead resistance spans from 3990-to-4039; similarly for Silver ’tis from 47.75-to-48.60. The Dollar Index at this instant is precisely 100.000 after basically having been below that level for the past three months. And the Econ Baro does receive two non-government metrics today: October’s ADP Employment and the ISM(Svc) Index, (the StateSide shutdown continuing following a 14th-failed Senate vote last evening).
04 November 2025 – 08:48 Central Euro Time
The Bond is currently above its Neutral Zone for today, whilst below same are Silver, Copper, Oil and the Spoo; BEGOS Markets’ volatility is firmly moderate. By Market Trends, Gold’s 21-day linreg has rotated to negative; with 3975 thus far today’s low, again, should 3901 be penetrated by week’s end, the weekly parabolic Long trend shall flip to Short. The Spoo today has closed its up gap from the opening back on 27 October; too, the daily MACD is approaching a negative crossover, and the daily Moneyflow study has dropped below the key mid-point level of 50. Today’s Econ Baro metrics that shan’t be received (give the StateSide “shutdown”) are September’s Trade Deficit and Factory Orders.
03 November 2025 – 08:32 Central Euro Time
‘Tis a fairly quiet start to November for the BEGOS Markets; presently the Bond is below today’s Neutral Zone, whilst above same is Oil; session volatility is light. The Gold Update confirms our expectations for price having had a second consecutive down week; however year-to-date, there’ve yet to be three negative weeks in-a-row; Gold’s “expect weekly trading range” (172 points) brings the weekly parabolic Long trend into jeopardy should 3901 (last week’s low) be tested as ’tis “within range”. Looking at Market Values for the five primary BEGOS components, in real-time we’ve the Bond as not quite a full point “low” below its smooth valuation line, the Euro -0.025 points “low”, Gold +89 points “high”, Oil -1.04 points “low” and the Spoo +126 points “high”. Given the ongoing StateSide “shutdown”, for the second consecutive month there shan’t be the otherwise due Construction Spending for September, making for a 35th missing Econ Baro metric; however October’s ISM(Mfg) shall be reported.
The Gold Update: No. 833 – (01 November 2025) – “Gold Furthers Fall as Called”

To wrap this week, regular readers of The Gold Update know we (as just done) “rib” those “WestPalmBeachers down there”, the claim-to-fame of south Florida’s brightest bulbs being “Hanging Chad” back in 2000 during “W vs. Algore”.
Technically, Florida is one of 50 states comprising the federal union of the U.S. Fundamentally however, Florida is more of a foreign country unto itself. Its pencil-thin panhandle barely clings to the southernmost coastline of Alabama and Georgia. The distance from Miami to Havana, Cuba is just 70% the distance to Jacksonville. And ’tis written the State’s average elevation is 100 feet (30m). Florida is FLAT, man. (In ’64, we visited an auntie there, and given the lack of depth perception, once was enough).
But to the point (hat-tip A.C.): assuming ratification by the state’s legislature, eight months from this day on 01 July 2026, Florida shall officially acknowledge both Gold and Silver as legal tender in coin form, and without sales tax on purchases thereof. To quote Grace Slick with The Jefferson Airplane at Woodstock back in ’69: “It’s the new dawn!”
So for Florida, with Gold and Silver, let fiat be gone!

Cheers!
…m…
www.TheGoldUpdate.com
www.deMeadville.com
and now on “X”: @deMeadvillePro
31 October 2025 – 08:47 Central Euro Time
All eight BEGOS Markets are currently within their respective Neutral Zones for today; session volatility is light. It remains the case amongst the five primary BEGOS components that’ve we’ve no notable correlations therein. Tomorrow’s 833rd consecutive Saturday edition of The Gold Update shall cite price’s return back down into the 3000s (as anticipated), albeit ’tis presently 4031 and By Market Values still +110 points “high” above the smooth valuation line; similarly, the Spoo is +156 points above same. Silver had a firm day yesterday in climbing back up through 47.75-48.15 resistance zone (see Market Profiles). We await October’s Chi PMI for the Econ Baro; however, today’s missing reports due to the StateSide “shutdown” are Q3’s Employment Cost Index plus September’s Personal Income/Spending and “Fed-favoured” Core PCE Index.
30 October 2025 – 08:45 Central Euro Time
Presently, Gold is above its Neutral Zone for today, whilst below same is Oil; BEGOS Market’s volatility is firmly moderate. Unsurprisingly, the FOMC with little data upon which to decide nonetheless reduced the FedFunds interest rate 25bps to a 3.75%-4.00% target range. Despite yesterday’s “unch” session, the S&P 500 is (yet again) extremely “textbook overbought”, buoyed almost solely by NVDA and to an extent AAPL; breadth yesterday was poor (25%/75%); the Spoo by Market Values shows (in real-time) as +180 points “high” above its smooth valuation line. For the Econ Baro today, given the ongoing StateSide government “shutdown”, the Bureau of Economic Analysis shan’t be furnishing the first peek at Q3 GDP, nor the Bureau of Labor Statistics the prior week’s Initial Jobless Claims. Q3 Earnings Season has reached the midway mark: for the S&P 500, 72% have bettered their bottom lines from a year ago, an above-average pace; of course, the overall level of S&P earnings remains far too low to maintain the current Index levels, especially with a risk-full yield of just 1.126% vs. a risk-less 3.730% on a 3mo. T-Bill.
29 October 2025 – 08:42 Central Euro Time
Both EuroCurrencies are at present below today’s Neutral Zones, as is Oil, whilst above same are the Metals Triumvirate and Spoo, session volatility for the BEGOS Markets is moderate. Gold yesterday traded down to as low as 3901, which as posted on “X” (@deMeadvillePro) was down through the first of three potential “fib” levels, followed then by 3857 and 3729; both precious metals today, however, are higher, even as their “Baby Blues” (see Market Trends) continue to drop. Our best Market Rhythms for pure swing consistency are currently (on a 10-test basis) Silver’s 30mn Moneyflow, Oil’s 4hr MACD and Gold’s 30mn Parabolics, plus (on a 24-test basis) the non-BEGOS Yen’s 2hr Moneyflow, Silver’s 15mn Moneyflow, and Gold’s 60mn Parabolics. For the Econ Baro we await September’s Pending Home Sales. And late in the session comes the FOMC’s Policy Statement for a -0.25% FedFunds interest rate cut.
28 October 2025 – 08:41 Central Euro Time
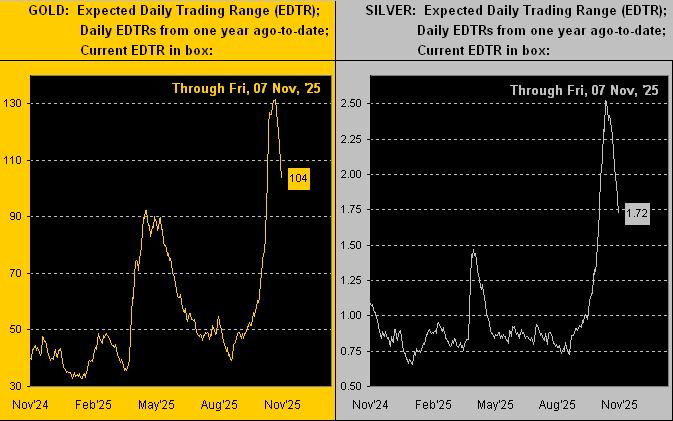
All three elements of the Metals Triumvirate, plus Oil, are at present below today’s Neutral Zones; the balance of the BEGOS Markets are within same, and session volatility is mostly moderate. As anticipated in The Gold Update, Gold and Silver continue to correct, the “Baby Blues” of linreg consistency (see Market Trends) furthering their falls in real-time; indeed we may see Silver’s trend having rotated from positive to negative by tomorrow or Thursday; mind as well the widened Market Ranges for both precious metals (Gold’s EDTR for today is 129 points whilst that for Silver is 2.42 points). The P/E of the S&P 500 has further skyrocketed to in excess of 60x due in large part to INTC’s “ttm” earnings now but $0.01: the P/E of INTC is now 2,822.5x (see S&P 500, Valuations and Rankings). Despite the StateSide “shutdown”, the Econ Baro will take in some actually data today: October’s Consumer Confidence.
27 October 2025 – 08:42 Central Euro Time
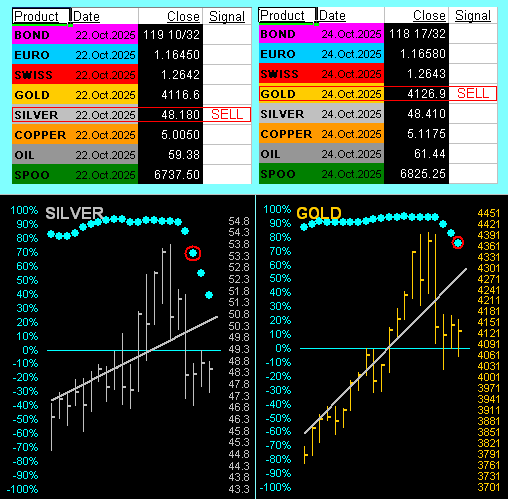
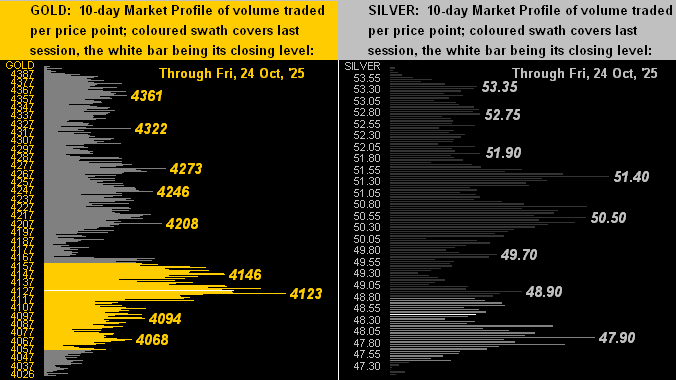
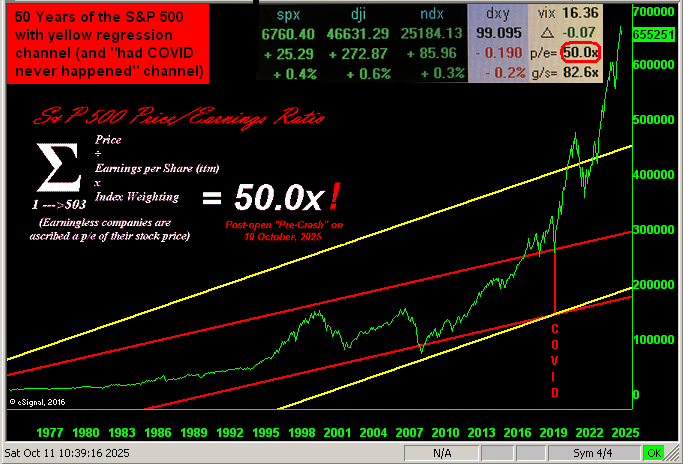
(Note: Europe is now on winter hours). The week gets underway presently finding the Bond, Swiss Franc and Gold below today’s Neutral Zones, whilst above same are Copper and the Spoo; BEGOS Markets’ volatility is moving toward moderate. The Gold Update sees further near-term downside for price as the “Baby Blues” of linreg consistency (see Market Trends) accelerate lower; indeed Gold today has moved below a shelf of support (see Market Profiles) spanning from 4132-4123, (price now 4083); and in real-time Gold is +250 points above its smooth valuation line (see Market Values). Were the S&P 500 to open at this instant (+0.9%), its P/E would be 50.9x. The week’s highlight comes Wednesday via the Policy Statement from the FOMC. And due today (but unlikely to be reported given the “shutdown”) are Durable Orders for September.
The Gold Update: No. 832 – (25 October 2025) – “Gold Meme’d Gets Bean’d!”


Meanwhile, the Economic Barometer remains unfulfilled: 39 metrics are to have been received since the start of the StateSide government “shutdown” effective 01 October. But with 26 thus far missing, just 13 have been received — including a surprise on Friday: September’s Consumer Price Index was issued; (more on that in the wrap). Otherwise, amongst all 13 of the incoming metrics, just five improved period-over-period. Lookin’ a bit rickety, our Baro, as we ever-anticipate for stocks ![]() “Stormy Weather”
“Stormy Weather”![]() –[Arlen/Koehler, ’33]. And yes, Virginia, if you actually perform the math (a science apparently unemployed by the modern-day money manager), the price/earnings ratio of the S&P 500 settled yesterday at 50.5x, (which for you WestPalmBeachers down there means portfolio theory is a thing of the past):
–[Arlen/Koehler, ’33]. And yes, Virginia, if you actually perform the math (a science apparently unemployed by the modern-day money manager), the price/earnings ratio of the S&P 500 settled yesterday at 50.5x, (which for you WestPalmBeachers down there means portfolio theory is a thing of the past):
So as teased, we wrap with yesterday’s surprise release of the CPI, (both the headline and core readings a bit hot for the Fed’s liking). But our immediate response was: “Did the ‘shutdown’ just end?” Quickly we checked … but … no. Yet, after all, the CPI like so many Econ Baro metrics is released by a federal government agency, in this case the Bureau of Labor Statistics, which did not first report the scheduled Producer Price Index.
But then we found out what happened with respect to the CPI: in order for the Social Security Administration (which is not fully “shutdown”) to keep benefit check payouts in pace with inflation, “They gotta have that CPI, baby!” We thus give a tip of the cap to whoever he/she/it was that snuck into the otherwise shuttered BLS — perhaps heroically in the wee hours on personal time — to gather, crunch, arrange and release the data. ‘Tis most appreciated and deserving of a year-end bonus.

As to a potentially negative near-term course for Gold, appreciate what ’tis, indeed add to your load!
Cheers!
…m…
www.TheGoldUpdate.com
www.deMeadville.com
and now on “X”: @deMeadvillePro
24 October 2025 – 08:24 Central Euro Time
The Euro, Swiss Franc, Gold and Silver are all below today’s Neutral Zones; above same are Copper and the Spoo, and session volatility for the BEGOS Markets is light. Gold’s “Baby Blues”(see Market Trends) of linreg consistency have provisionally dropped below their key +80% axis such as (upon day’s-end confirmation) to then expect lower prices near-term; vis-à-vis its smooth valuation line (see Market Values), Gold in real-time shows as +289 points “high”; more on the yellow metal in tomorrow’s 832nd consecutive Saturday edition of The Gold Update. Oil’s “Baby Blues” yesterday confirmed crossing above their -80% axis: given price in real-time is about -2 points below its own valuation line, near-term we’d expect Oil to visit the mid-63s from the current mid-61s. Due (but likely not arriving) today for the Econ Baro are September’s CPI (<– update, yes CPI reported) and New Home Sales; however, the non-governmental UofM Sentiment Survey for October ought make the trip.
23 October 2025 – 08:49 Central Euro Time
The Bond, Euro and Swiss Franc are at present below their respective Neutral Zones for today, whilst above same is Oil; session volatility for the BEGOS Markets is moving toward moderate. At Market Trends, Gold’s “Baby Blues” of linreg consistency are dropping, but have yet to move below their key +80% (as did Silver’s so confirm yesterday); thus far today, both precious metals are stabilizing to this point; however by Market Values, Gold in real-time is +335 points above its smooth valuation line; further of note today for Gold, it has been trading either side of its most volume-dominant price of the past fortnight which by the Market Profile is 4123. Given the scattered nature of late amongst the five primary BEGOS components, we find no reasonable correlation — neither positive nor negative — therein. The Econ Baro awaits September’s Existing Home Sales; but with yet another Senate vote such that the StateSide government remains closed, this shall be the fourth consecutive week of missing Initial Jobless Claims.
22 October 2025 – 08:43 Central Euro Time
The Swiss Franc, Gold, Copper and Oil are presently above today’s Neutral Zones; the balance of the BEGOS Markets are within same, and volatility is moderate, albeit Gold already has traced 115% of its EDTR (see Market Ranges). As stated yesterday on “X” (@deMeadvillePro), Gold recorded its largest intraday loss by points in history: -300 from 4393 to 4093; (on a percentage basis, the -6.8% intraday drop ranked 33rd worst). Regardless, by Market Values, Gold in real-time (4159) is still +380 points above its smooth valuation line (3779). As for Silver, her intraday drop of -8.7% was enough to pull her “Baby Blues” of regression trend consistency in real-time today below the key +80% level; we thus expect still-lower prices for Sister Silver near-term, and thus likely for Gold as well. Again ’tis a nothing-due day for the Econ Baro (irrespective of the StateSide government “shutdown”). And Q3 Earnings Season is going well for the S&P 500 with 80% of reported constituents beating their like earnings of Q3 a year ago; problematic of course is that earnings continue to run too low to support the level of the S&P, its futs-adj’d “live” P/E 49.5x at the moment.
21 October 2025 – 08:37 Central Euro Time
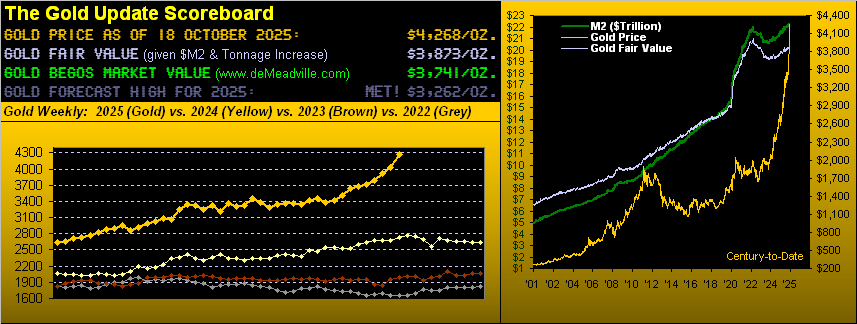
None of the BEGOS Markets are presently above today’s Neutral Zones; below same are the Euro and the three elements of the Metals Triumvirate; session volatility is mostly moderate. Gold as a “meme stock” has moved excessively above its key valuation levels: currently 4340, Fair Value is 3873 and BEGOS Market Value is 3765; a reversion to the latter’s mean at this point would be -576 points. Too by Market Values, Oil is currently -6.40 points below its smooth valuation line: currently 57.07, Oil is just above its most volume-dominant supporter of 57.00, with near-by resistance spanning from 57.90 to 58.40. The Gold/Silver ratio in real-time is 86.0x as Silver today (-1.9%) is selling off at a faster pace than is Gold (-0.8%). Nothing is scheduled today nor tomorrow for the Econ Baro; the StateSide Senate voted last evening such that the “shutdown” continues.
20 October 2025 – 08:31 Central Euro Time
Copper is presently above its Neutral Zone for today, whilst Oil is below same; session volatility for the BEGOS Markets is mostly light. The Gold Update likens the yellow metal to trading as a “meme” stock; Gold had similar runs in both 2007/2007 and again in 2011, both of which led to corrections respectively of -34% and -45%; not that we’ll again witness same, however price is better than +300 points above its Fair Value and nearly +500 points above its smooth valuation line (see Market Values). As to the S&P 500, its “risk-full” yield is but 1.170% vs. 3.832% annualized for the “risk-less” 3mo T-Bill; the “live” (futs-adj’d) P/E of the S&P is 49.1x at this moment. Given the ongoing StateSide government “shutdown”, incoming data for the Econ Baro may continue to be scant, however due today is the Conference Board’s Leading (i.e. “lagging”) Indicators for September. <– “Delayed” due to lack of data. And Q3 Earnings Season picks up its pace as the week unfolds.
The Gold Update: No. 831 – (18 October 2025) – “Gold Goes Meme!”

We close with this hilarious headline of the week, courtesy of The Edge, Malaysia: “Bitcoin, Binance-Linked Coin Struggle After Historic Wipeout”. In perusing the piece, ‘twould seem that corrections of 3%-to-20% are now deemed as “wipeouts”. ‘Twill be (dare we say) edge-of-the-seat stuff to read just how a 30% correction might be so characterized. Just sayin’… “Oh steady on there, lad!”

A pending correction or otherwise for meme-like Gold, one may buy that sold for more to hold!
Cheers!
…m…
www.TheGoldUpdate.com
www.deMeadville.com
and now on “X”: @deMeadvillePro
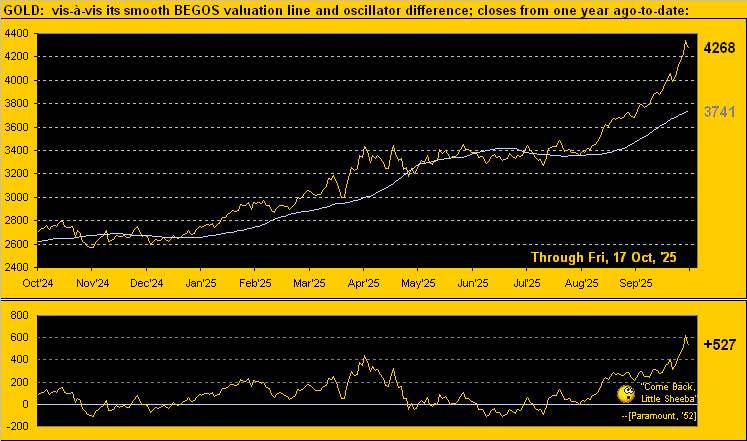
17 October 2025 – 08:45 Central Euro Time
The Bond, Euro, Swiss Franc and Gold are all at present above their respective Neutral Zones for today; below same are Silver, Copper and the Spoo, (only Oil is within same), and session volatility for the BEGOS Markets is moderate-to-robust. The fragility of the S&P 500 continues, the Spoo notably having lost -132 points in just the last 16 hours; again we point to the leading characteristic of the S&P MoneyFlow page. At close last evening, the Euro by its “Baby Blues” of linreg consistency (see Market Trends) triggered a Long signal, whilst for Copper a Short signal too was confirmed. Q3 Earnings Season is off to a good start for the S&P as 78% thus far having beaten the prior year’s like quarter; of course, problematic remains the overall level of earning is too low to support the S&P given its “live” P/E (futs-adj’d) of 48.3x at this instant. As the StateSide “shutdown” continues, none of the six metrics due for the Econ Baro today are likely to be released, (including for September Housing/Permits, Ex/Im Prices, IndProd/CapUtil).
16 October 2025 – 08:41 Central Euro Time
The Euro, Swiss Franc and Spoo are all presently above today’s Neutral Zones; below same is Silver, and BEGOS Markets’ volatility is light-to-moderate. In a microcosm of last Friday’s S&P plunge, yesterday saw 18 hours worth of Spoo gains then fully evaporate in just four hours: the S&P 500 sellers are quite quick to exit each time the Index runs out of puff; again, mind the S&P MoneyFlow page. Gold is becoming ever-more overbought both by Fair Value and BEGOS Value: the latter measure (in real-time) finds the yellow metal +506 points above its smooth valuation line (see Market Values). The StateSide government shutdown continues: due today for the Econ Baro are nine metrics, albeit we’ll likely only receive three: October’s Philly Fed Index and NABH Housing Index, plus September’s Treasury Budget, look to be the only arrivés, whilst left on the shelf shall be data points for September’s wholesale inflation and Retail Sales, August’s Business Inventories, and the prior week’s Jobless Claims.
15 October 2025 – 08:44 Central Euro Time
Save for Oil, all seven other BEGOS Markets are presently above their respective Neutral Zone for today, (Oil being within same), and session volatility is moderate. Concern lies with the S&P’s MoneyFlow (see our page thereto) as despite the Index having come off Friday’s low, the Flow is net negative, certainly so on our five-day measure. By Market Rhythms for pure swing consistency, our Top Three are (on a 10-test basis) the non-BEGOS Yen’s 2hr Moneyflow, the same measure for Gold, and the Bond’s 15mn parabolics; too, (on a 24-test basis) we’ve again Gold’s 2hr Moneyflow, Copper’s 15mn MACD and Silver’s 15mn Moneyflow; (note: our S&P MoneyFlow calculation is comprehensively different from the “canned” study we use for the futures markets). Whilst the StateSide Senate could not receive enough votes last evening to end the “shutdown”, the Econ Baro still looks today to October’s NY State Empire Index, (which of course is Fed-generated rather than by a government entity). Then late in the session comes the Fed’s Tan Tome.
14 October 2025 – 08:35 Central Euro Time
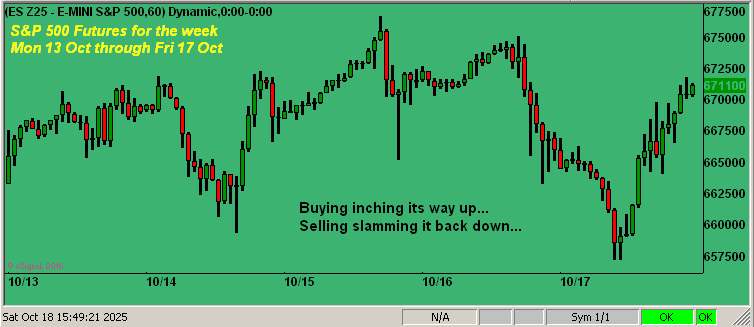
Gold is the only BEGOS Market at present inside of today’s Neutral Zone; above same are the Bond, Euro and Swiss Franc, with the balance below same; session volatility is mostly robust. Gold earlier this morning touched another All-Time High at 4191, but has since given back the sessions. The Spoo’s “Baby Blues” (see Market Trends) are dropping so swiftly (following Friday’s technical damage) that the 21-day linreg trend looks to rotate from positive to negative within the next few days; by its Market Profile, the Spoo’s more volume-dominant resistors are 6671, 6695, 6708 and 6737; there is a wee bit of volume support at 6595; indeed the current volatility for the S&P is creating fragility, and we still sense lower levels in the offing; the Spoo’s EDTR (see Market Ranges) is 74 points. Again nothing is scheduled today for the Econ Baro, (the StateSide government “shutdown” notwithstanding); and financials begin populating Q3 Earnings Season.
13 October 2025 – 08:31 Central Euro Time
Gold has tapped yet another All-Time High this morning at 4097; The Gold Update cites price as continuing to look good going forward, but that more immediately ’tis extremely high above its smooth valuation line (in real-time now +391 points “high”; see Market Values); Silver has not followed with an all-time high thus far today. Too, the missive supports a firm case for a significant correction in the S&P 500, which in six hours on Friday gave back a full month’s worth of gains; however, the Spoo is very strong this morning such that the S&P (at this moment) would open +81 points higher (+1.2%), fears over the “Trump n’ China” tariffs concern be somewhat allayed. Presently, all three elements of the Metal Triumvirate are above today’s Neutral Zones, as too are Oil and the Spoo; below same are the Bond and Swiss Franc, and volatility for the BEGOS Markets is moderate-to-robust. Nothing is due until Wednesday for the Econ Baro, which to date in October is missing 11 of the 16 metrics thus far due as the StateSide “shutdown” continues. Q3 earnings Season picks up its pace this week, notably with financial entities reporting.
The Gold Update: No. 830 – (11 October 2025) – “Silver’s New-Found Sky; Gold’s Gut-Punch from High; S&P’s Goodbye”

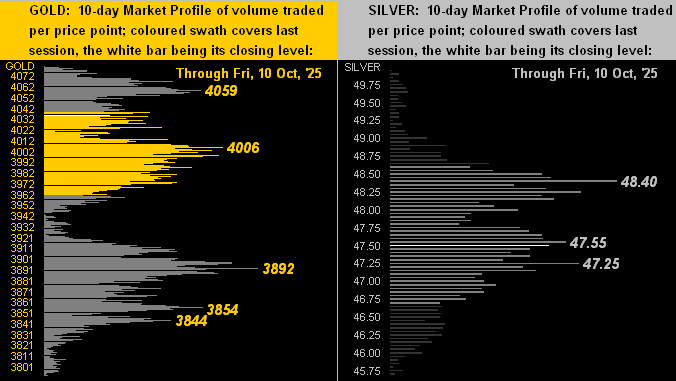
Toward closing, we’ve not stacked it up since mid-August. So let’s have a look; note therein for the Stack’s first time that “Gold’s Value per Dollar Debasement” is not at present on top, the yellow metal having achieved (as you know if you are regular reader) such Fair Value a week earlier:
The Gold Stack (continuous contract pricing):
Gold’s All-Time Intra-Day High: 4081 (08 October 2025)
2025’s High: 4081 (08 October 2025)
10-Session directional range: up to 4081 (from 3793) = +288 points or +7.6%
Gold’s All-Time Closing High: 4061 (08 October 2025)
Trading Resistance: 4059
Gold Currently: 4036, (expected daily trading range [“EDTR”]: 69 points)
10-Session “volume-weighted” average price magnet: 3952
Trading Support: notable Profile nodes: 3892 / 3854 / 3844
Gold’s Value per Dollar Debasement, (from our opening “Scoreboard”): 3870
The Weekly Parabolic Price to flip Short: 3548
The 300-Day Moving Average: 3036 and rising
2025’s Low: 2625 (06 January)
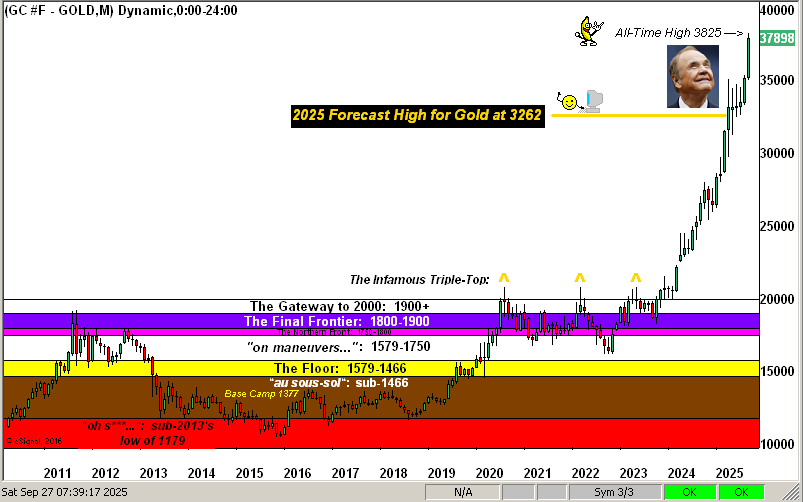
The 2000’s Triple-Top: 2089 (07 Aug ’20); 2079 (08 Mar’22); 2085 (04 May ’23)
The Gateway to 2000: 1900+
The Final Frontier: 1800-1900
The Northern Front: 1800-1750
On Maneuvers: 1750-1579
The Floor: 1579-1466
Le Sous-sol: Sub-1466
The Support Shelf: 1454-1434
Base Camp: 1377
The 1360s Double-Top: 1369 in Apr ’18 preceded by 1362 in Sep ’17
Neverland: The Whiny 1290s
The Box: 1280-1240
To wrap, does another “Black Monday” await the S&P? Instead, shall the FinMedia (which typically suffers ratings declines in bear markets) come to the rescue emphasizing “all that money piling up on the sidelines will come back into the market”? Or in reality: is it the painful withdrawal of margin? “Uh-oh…”
Just don’t you get caught with with a hole in your bankroll! Rather, (hat-tip CDS), ride Gold’s rise above its blow hole! “WHOA!”

Cheers!
…m…
www.TheGoldUpdate.com
www.deMeadville.com
and now on “X”: @deMeadvillePro
10 October 2025 – 08:38 Central Euro Time
Presently we’ve Copper below its Neutral Zone for today, whilst above same is the Spoo; session volatility for the BEGOS Markets is light-to-moderate. Spot Silver has briefly traded above 50, however by CME GLOBEX, yesterday’s December cac high was 49.97 — regardless, an all-time high — and the high thus far today lower however at 47.915. Gold high-to-low yesterday dropped -120 points (-2.9%) its eight-worst intra-day loss by points century-to-date: we’ve of late regularly been citing Gold’s excessively high price vis-à-vis its BEGOS Market Value, so ’tis no surprise (indeed expected) seeing price retreat; even at that, Gold in real-time is still +299 points above its smooth valuation line; more on it all in tomorrow’s 830th consecutive Saturday edition of The Gold Update. The P/E of the S&P 500 may exceed 50x as the day unfolds; (marked by fair value to the futs, ’tis 49.9x at the moment). For the Econ Baro we’ve the UofM Sentiment Survey for October, and purportedly late in the session September’s Treasury Budget, (the Treasury Department does operate under “shutdown” conditions).
09 October 2025 – 08:18 Central Euro Time
Copper is presently the only BEGOS Market outside (above) its Neutral Zone for today; session volatility is again moderate. Silver yesterday traded above 49 for the first time in better than 14 years; currently ’tis 48.63; Gold traded yesterday to an All-Time High at 4081. Too, the S&P 500 reached a record high 6756, the Spoo itself attaining the 6808 level. By Market Trends: Gold, Silver, Copper and the Spoo are all in 21-day linreg uptrends; the balance of the Bond, Euro, Swiss Franc and Oil are in like downtrends. Gold is now +382 points above its smooth valuation line (see Market Values) and the Spoo is +141 points above same, both markets severely stretched to the upside. Oil’s cac volume is rolling from November into that for December. And the two unlikely-to-be-reported metrics due for the Econ Baro are the prior week’s Jobless Claims and August’s Wholesale Inventories as the StateSide gov’t shutdown continues.
08 October 2025 – 08:46 Central Euro Time
Gold, having yesterday achieved 4000, has since risen today to as high as 4059; Silver however has not kept pace, “stuck” to a degree in the 47s and 48s, the Gold/Silver ratio in turn having risen from the 81s to nearly the 84s (its current real-time reading 83.7x). All three elements of the Metal Triumvirate are presently above today’s Neutral Zones (even as the Dollar strengthens, reminding us that “Gold plays no currency favourites”), and the two EuroCurrencies are below their Neutral Zones; BEGOS Market’s volatility is moderate. The Spoo’s “Baby Blues” (see Market Trends) have marginally been slipping below their key +80% axis since Friday, and price seemingly is losing its rampant upward push: the “live” P/E of the S&P (futs-adj’d) is 49.1x, and the Index is now 21 trading days (one full month) “textbook overbought”. Nothing is due today for the Econ Baro; late in the session come the Minutes from the FOMC’s 16/17 meeting.
07 October 2025 – 08:45 Central Euro Time
Gold (by its December “front month” contract) at 00:28 this morning touched 4000 for the first time. Price has since come off and is now inside of today’s Neutral Zone (3999-3970), as too are the Bond, Silver Oil and the Spoo; Copper is above its Neutral Zone, and below same are both the Euro and Swiss Franc; session volatility for the BEGOS Markets is light. Gold’s best Market Rhythm for pure swing consistency is its 2hr Moneyflow, whilst for a profit-target basis/swing (per the Market Rhythms page) is its 12hr Moneyflow, (wherein a minimum of 29 points have been gained through the last 10 swings inclusive). Cautionarily, the yellow metal settled last evening +131 points above its Market Magnet, and is (in real-time) +337 points above its smooth valuation line (see Market Values). Due today for the Econ Baro — but unlikely to be reported given the ongoing StateSide gov’t closure — is August’s Trade Deficit; then late in the session we’ve August’s Consumer Credit. Q3 Earnings Season has commenced with just one report (STZ) … which beat estimates … but its earnings were less than a year ago, (same old Wall Street game). Mind our Earnings Season page throughout the ensuing days and weeks.
06 October 2025 – 08:39 Central Euro Time
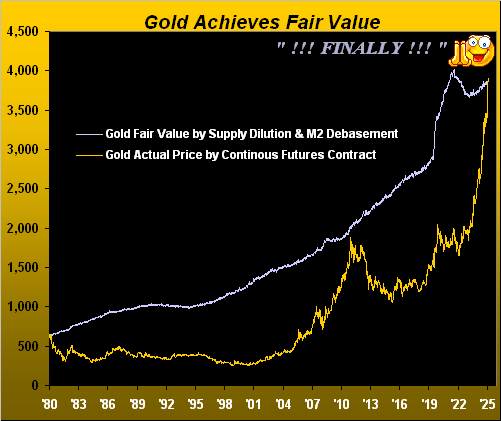
The Gold Update officially recognizes the yellow metal as having achieved, indeed surpassed, our measure of its Fair Value: congrats to Gold! Presently, both Gold and Silver are higher today, above their Neutral Zones as are Oil and the Spoo; below same are the Bond and EuroCurrencies, and BEGOS Markets volatility is session moderate-to-robust. By Market Values in real-time, Gold shows as +315 points above its smooth valuation line, whilst the Spoo too is +140 points above same, both markets currently in extreme, technically overbought states. ‘Tis a very light data week for the Econ Baro given just six metrics being due: with the ongoing StateSide government shutdown, actual reports may be less, (none are scheduled for today). And Q3 Earnings Season gets underway.
The Gold Update: No. 829 – (04 October 2025) – “Gold Achieves Fair Value”
The Baro was due to take in 13 metrics this past week … but just six (privately-generated) made the trip whilst the publicly-generated balance of seven offered zip. Of those six reports, August’s Pending Home Sales and September’s Institute for Supply Management Index improved period-over-period; but worse were ADP’s negative Employment data, the ISM Services Index, the Chicago Purchasing Manager’s Index and the Conference Board’s Consumer Confidence, all for September.
So: are you confident? As has been bandied about Wall Street over the years, when the government is out of the way, the markets positively play. Thus far for the three trading days of “no-budget” October, the S&P has risen by as much as +0.9%, indeed closing for the first time above 6700 on Wednesday, and again so on both Thursday and Friday. Cue ![]() “Do the Wall Street shuffle…”
“Do the Wall Street shuffle…”![]() –[10cc, ’74].
–[10cc, ’74].
‘Course, not so much shuffling upward as streaking higher has been Gold. Here next we’ve the yellow metal’s two-panel graphic of daily bars from three months ago-to-date on the left and 10-day Market Profile on the right. Achieving Fair Value is a beautiful thAng:
To close, we were reminded this past week of a conservation away back in the days of AvidTrader, wherein by completely mindless (let alone official) observations, ’twas determined that the mighty Goldman Sachs was correct on its various outlooks a double-digit percentage of the time … that being 50%.
Now more than two decades later, we similarly query: “Is Goldman Sachs capable of making up its mind?” To wit, this courtesy of “The Right Hand Doesn’t Know What the Left Hand Is Doing Dept.”
- Hat-tip Bloomy from this past Monday: “Goldman Strategists Turn Bullish on Stocks as Recession Risk Low”
- Hat-tip CNBC(S) from Friday: “Goldman Boss David Solomon warns investors of a stock market drawdown”
Some things never change. Yet we think ’tis The Boss who’s wiser. Especially given the S&P 500’s price/earnings ratio having just settled the week at an inane 48.6x. “Have we crashed yet?”
Either way, don’t forget who truly is the boss: Gold!

Cheers!
…m…
www.TheGoldUpdate.com
www.deMeadville.com
and now on “X”: @deMeadvillePro
03 October 2025 – 08:36 Central Euro Time
Both Silver and the Spoo are presently above today’s Neutral Zones; the balance of the BEGOS Markets are within same, and session volatility is light. Amongst the correlations of our five primary BEGOS components, the best currently is negative between Oil and the Spoo. The S&P 500 continues its streak of being “textbook overbought” now through the past 18 trading sessions; (‘twould be of note to see the “live” P/E surpass the 50x level: futs-adj’d, ’tis 49.5x at the moment). The Spoo (currently 6784) shows Market Profile support at the volume-dominant levels of 6765, 6752, 6737, 6722, and most notably across the past fortnight at 6710. As the StateSide government remains shutdown, we don’t expect September’s Payrolls to arrive today for the Econ Baro; however due, too, is the ISM(Svc) Index.
02 October 2025 – 08:41 Central Euro Time
Copper is at present the only BEGOS Market outside (above) its Neutral Zone for today; session volatility is not quite yet moderate. The “live” (futs-adj’d) P/E of the S&P 500 is 49.8x, the Index recording yet another record high. Gold yesterday found its way also to another All-Time High at 3923. By Market Rhythms for pure swing consistency, our current Top Three on a 10-test basis are the Swiss Franc’s 2hr MACD, the Euro’s 4hr Parabolics, and Copper’s 2hr Moneyflow; on a 24-test basis we’ve Silver’s 4hr MACD, Gold’s 2hr Moneyflow, and the non-BEGOS Yen’s 14mn Price Oscillator. Metrics due today for the Econ Baro include August’s Factory Orders, however given the StateSide gov’t shutdown, such report likely shan’t be released.
01 October 2025 – 08:33 Central Euro Time
The Bond, Copper and Spoo are presently below today’s Neutral Zones; above same are the Euro and Swiss Franc, and BEGOS Markets’ session volatility is moderate. Gold has again set an All-Time High at 3904, and Silver has reached up to 47.83 so far this session. The Spoo’s “Baby Blues” (see Market Trends) have dropped (in real-time) to their key +80% axis: a settle below that border regularly dictates lower prices near-term; the S&P 500 itself saw its P/E settle yesterday at 49.0x, albeit with the Spoo trading lower this morning, the “live” futs-adj’d P/E at the moment is 48.7x; the S&P is now 16 consecutive sessions “textbook overbought” and the yield a wee 1.164%, (that for “risk-free” three-month annualized T-Bill yield is 3.845%). The Econ Baro looks to September’s ADP Employment data and ISM(Mfg) Index, plus August’s Construction Spending (not reported due to U.S. government shutdown).
30 September 2025 – 08:28 Central Euro Time
Gold at 00:05 GMT this morning reached its Dollar debasement value of 3865, moving further up to (thus far) as high as 3899; this is the first time since 2011 that price has (as graphically portrayed each Saturday in The Gold Update’s Scoreboard) exceeded its Dollar debasement value; the yellow metal is at present the only BEGOS Market outside (above, obviously) its Neutral Zone for today, and volatility for the BEGOS Markets otherwise is light. In real-time, Gold (3892) by Market Values is +314 points above its smooth valuation line; by its Market Profile, Gold’s nearest volume-dominant support price area is 3856-3854. Go Gold! albeit as we’ve written of late, price is very extended to the upside, and now certainly so in exceeding its Dollar debasement value; to be sure, geopolitical sensitivity is for the moment supporting price. For the Econ Baro today we’ve September’s Chi PMI and Consumer Confidence.
29 September 2025 – 08:38 Central Euro Time
The week begins finding Gold trading ever closer (its high thus far today 3849) to its Dollar debasement value (3865). At present, every BEGOS Market is higher, with seven of the eight (save for Oil) above their respective Neutral Zones for today; session volatility is moderate-to-robust. The Gold Update notably finds Silver leading the BEGOS Markets Standings, price +58.3% year-to-date, and even more so as of today by the white metal having moved up into the 47s; (Silver’s all-time high was back on 25 April 2011 at 49.82); too, we’re a bit concerned over Gold becoming excessively stretched to the upside, in real-time now +281 points above its smooth valuation line (see Market Values). The Spoo is higher such that were the S&P 500 to open at this instant, ‘twould so do +0.4%. 13 Econ Baro metrics are due this week, starting today with August’s Pending Home Sales.
The Gold Update: No. 828 – (27 September 2025) – “Gold Furthers Record Ticks; Silver Snags 46!”


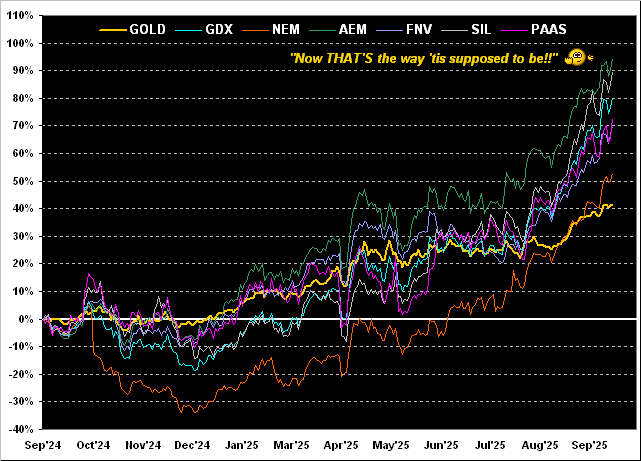
We started with Silver; let’s close with same. The last time the Gold/Silver ratio was below its century-to-date average was well into the midst of COVID on 18 May 2021, (the white metal then priced at 28.29). If anyone cares to comb back through the 227 missives penned since then to count how many times we’ve written “Don’t forget the Silver!”, do drop us a line. In the meantime…

…keep towing the precious metals line!
Cheers!
…m…
www.TheGoldUpdate.com
www.deMeadville.com
and now on “X”: @deMeadvillePro
26 September 2025 – 08:32 Central Euro Time
Silver presently is the only BEGOS Market outside (below) its Neutral Zone for today; session volatility is again light with August’s “Fed-favoured” PCE inflation gauge in the balance. Silver traded yesterday to as high as 45.50, a better than 14-year high: the white metal now easily leads the BEGOS components year-to-date standings as we’ll present in tomorrow’s 828th consecutive Saturday edition of The Gold Update. Stocks took a bit of a jolt yesterday on an unusually strong revision to finalize Q2’s GDP — perhaps putting into question another Fed rate cut — the S&P 500 nonetheless coming well off its intraday low (6569) in settling at 6605. Looking at correlations for our five primary BEGOS components, the best currently is positive between the Bond and the Euro. In addition to the PCE, other Econ Baro metrics today of course include August’s Personal Income/Spending.
25 September 2025 – 08:32 Central Euro Time
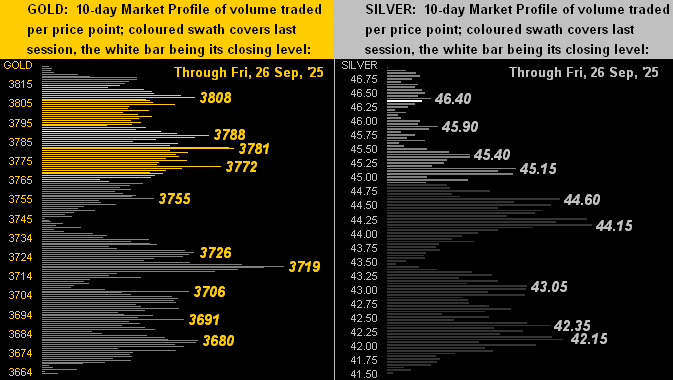
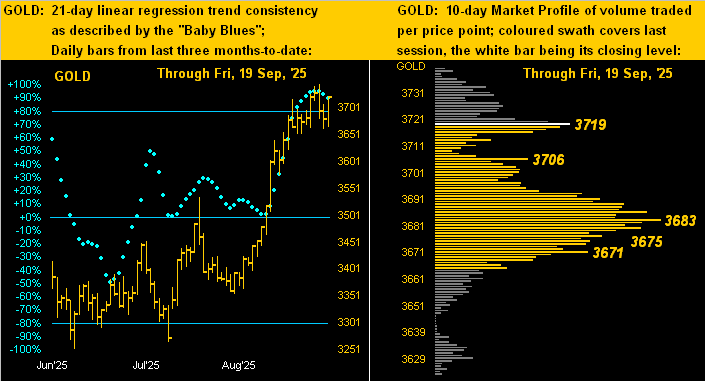
Copper, for which yesterday’s +4.0% net gain ranked fourth-best year-to-date, is higher again this morning and is the only BEGOS Market presently outside of its Neutral Zone; overall session volatility is again light. The pricing for the Spoo may be quite contained from now to tomorrow’s “Fed-favoured” PCE data for August; nonetheless, the S&P 500 itself remains “textbook overbought” and the futs-adj’d P/E 48.6x. Both Precious Metals have cooled a bit from their highs of Tuesday; still, Gold notably in real-time is +244 points above its smooth valuation line (see Market Values); and by its Market Profile, Gold shows its most dominant volume support at 3719. Incoming metrics for the Econ Baro include August’s Durable Orders and Existing Home Sales, along with the final read for Q2 GDP.
24 September 2025 – 08:26 Central Euro Time
Our two EuroCurrencies are the only BEGOS Markets presently outside (both below) today’s Neutral Zones; session volatility continues light, and by Market Ranges, save for the two precious metals, EDTRs remain relatively subdued. Our Top Three Market Rhythms for pure swing consistency are on a 10-test basis the Euro’s 1hr Moneyflow, the Spoo’s 4hr Parabolics, and the Swiss Franc’s 2hr MACD; on a 24-test basis they are Silver’s 4hr MACD, the Swiss Franc’s 1hr Parabolics, and Gold’s 2hr Moneyflow. The Swiss Franc (1.2739) is by its Market Profile in real-time on its most volume-dominant price of the past fortnight: overhead resistance by same is 1.2840 and support 1.2700. Despite yesterday’s -0.6% S&P 500 pullback, the breadth was positive (55%/44%), indicative of the largest mkt cap constituents driving the downside bus. The Econ Baro awaits August’s New Home Sales.
23 September 2025 – 08:50 Central Euro Time
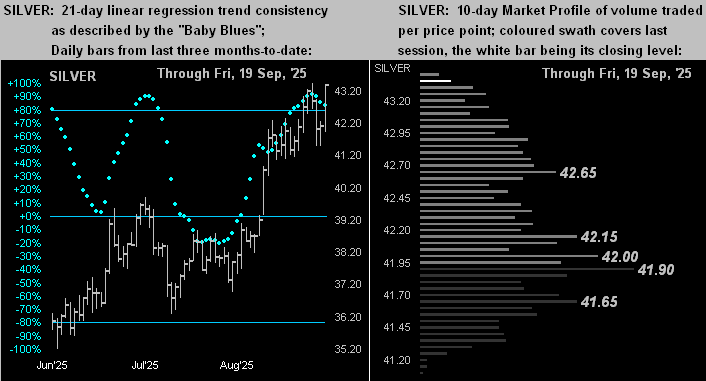
New highs continue to be recorded for both Gold (3795 thus far today) and the S&P 500 (6699 yesterday). At present, Copper is the sole BEGOS Market outside (below) its Neutral Zone for today, and session volatility to this hour is again light. Silver has today reached thus far up to 44.42, a level last traded on 03 May 2011; yet, the white metal still remains attractive vis-à-vis the level of the yellow metal given the Gold/Silver ratio of 85.8x bein well above its century-to-date average of 69.3x; Silver’s volume-dominant Market Profile support ranges from 42.65 down to 41.65; but by its Market Magnet, Silver’s settle last evening (44.32) finds it quite stretched at +1.85 points above that metric (see our Silver page). The Econ Baro starts its week today with Q2’s Current Account Deficit.
22 September 2025 – 08:42 Central Euro Time
Gold, Silver and Oil all are presently above today’s Neutral Zones; the other BEGOS Markets are within same, and session volatility is light. The Gold Update highlights both the yellow metal and S&P 500 making record highs, albeit prices are quite stretched near-term for Gold and broadly so for the S&P; the P/E of the latter in real-time (adjusted for the futs) is 48.6x. At Market Trends, only Oil is in negative linreg; however the “Baby Blues for the seven other BEGOS components are rolling over to the downside, (save barely those for the Spoo, but look poised to so do). Regardless, Gold just printed a fresh All-Time High as we type at 3748, (the previous being 3744 this past Wednesday). Nothing is due today for the Econ Baro ahead of a moderate load of incoming metrics as the week unfolds, the highlight being Friday’s release for August of the “Fed-favoured” PCE data.
The Gold Update: No. 827 – (20 September 2025) – “Gold n’ S&P Highs for All to See!”
For a month which through the last dozen years hardly has been happy for Gold — and certainly century-to-date dreadful for the S&P 500 — let’s hear it here in this September of 2025 for All-Time Highs all ’round! Whee-Heee!
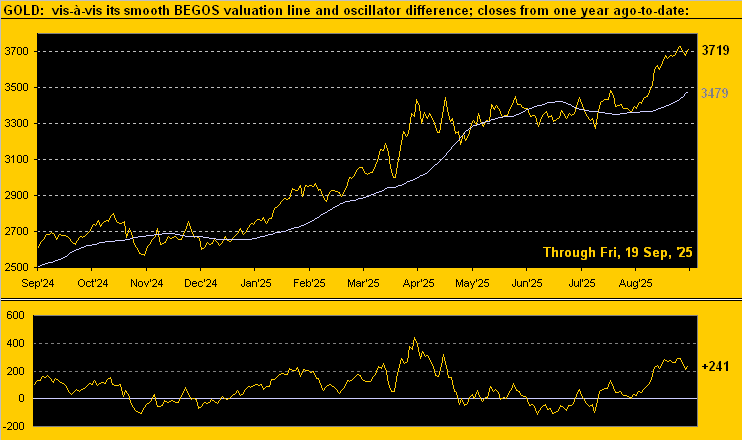
Through the 14 trading days of this September-to-date, Gold has posted record highs in eight, toward settling yesterday (Friday) at an All-Time Weekly Closing High of 3719, the year-to-date gain now +40.9%. Too for the S&P, albeit not always on the same day, there’ve also been eight days of record highs, the mighty Index settling the week at 6664, both a record daily and weekly close, the year-to-date performance now +13.3%.
Reprise from The Great Depression “The Dance of the Dollars” as crooned by the inimitable Ginger Rogers: ![]() “We’re in the money, We’re in the money…”
“We’re in the money, We’re in the money…”![]() –[Warner Bros., “Gold Diggers of 1933”].
–[Warner Bros., “Gold Diggers of 1933”].
Or as we’ve in more recent years occasionally quipped: “Marked to market, everybody’s a millionaire; marked to reality, nobody’s worth squat.”
“So mmb, obviously the S&P hasn’t crashed yet, right?”
Rather, it has what we call “up-crashed”. Squire is referring of course to last Saturday’s edition of The Gold Update per its title “Gold Gets the Cash (Ahead of S&P Crash?)“ For in spirit with the Federal Open Market Committee having voted nearly unanimously this past Wednesday to lower The Bank’s Funds Rate by our anticipated -0.25% — (an event “priced-in” a few billion times) — the S&P 500 posted a +1.2% weekly rise, as did Gold gain +1.1%. But specific to the S&P, how’s that price/earnings ratio of 48.4x workin’ out for ya?
But let’s instead turn the tables on Squire and ask him a question:
You have today $100,000 to invest for one year, and (excluding Gold), which of the following two options’ results would you select?
- Option 1: in a year’s time your $100,000 investment shall additionally have garnered $3,610 in yield such that you’ll then have $103,610;
- Option 2: in a year’s time your $100,000 investment shall additionally have garnered $1,171 in yield such that you’ll then have something in the range of $83,000 to $119,000. Squire?
“Option 1, mmb, which is the one-year T-bill, ’cause Option 2 is the too much crazily-overvalued S&P.”
Smart boy is our Squire. (For those of you scoring at home, Option 2’s $83k – $119k range includes the wee yield and is one standard deviation both above and below the S&P’s annual average percentage change through this century’s 24 completed years).
‘Course, given the perilously overvalued S&P today — similar to that just preceding the DotComBomb — a like fall of more than -50% in the S&P would instead place the low end of Option 2’s range just under $50k.
Further into a deep numerical dive, you may have seen last evening’s release by the Commodity Futures Trading Commission of the Commitments Of Traders for the S&P 500 futures: ’tis net Short -225,100 positions, the most since that which preceded last year’s S&P demise from March into April. Either way, have a nice day.
But to get on with good old Gold, century-to-date ’tis now +1,259%. ‘Course the nattering nabobs of Gold negativism are always quick to point out that Gold has no yield. We simply let them instead be happy with their S&P 500’s approximately +550% gain including yield across the same stint.
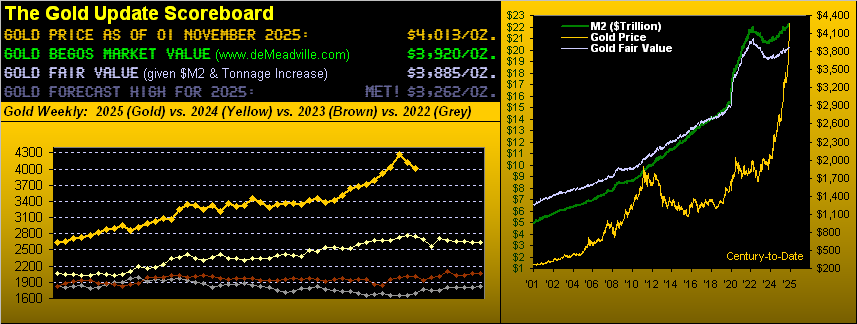
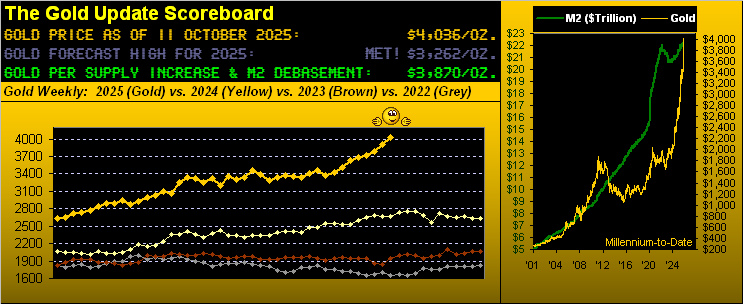
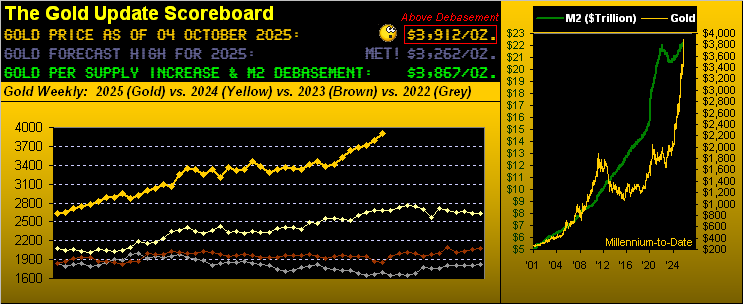
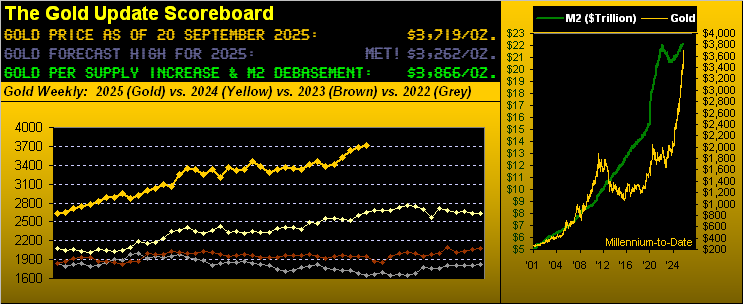
Now with respect to our opening Gold Scoreboard, price (3719) has been racing up toward the Dollar debasement value of 3866. However, per the aforementioned FedFunds interest rate cut, that ought raise the debasement bar higher still as dough more affordably flows out through the Fed window. Indeed this past week, the StateSide “M2” money supply reached its own all-time high of $22.207T. That of course “supports” (not) the current S&P 500 market capitalization of $58.800T. (Have we made mention in the past of the “Look Ma! No Money!” crash?)
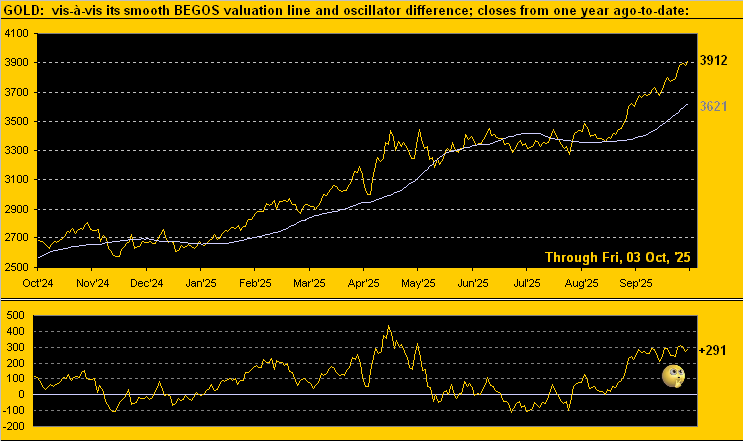
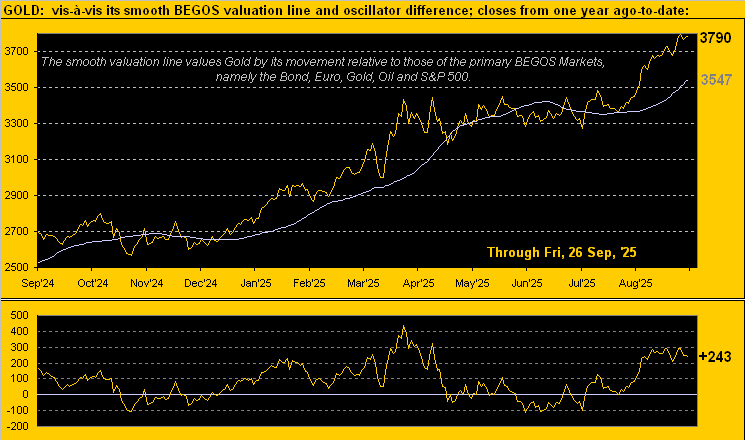
Still, as glorious as has been Gold’s recent run, might it be (only temporarily) done? Per the following website graphic of Gold’s value vis-à-vis its movement relative to those of the primary BEGOS Markets (Bond / Euro / Gold / Oil / S&P 500), price today at 3719 is +241 points “high” above its smooth valuation line at 3479, (levels rounded to nearest whole number). Across the graphic (excluding this most recent excursion), when price’s deviation has been at least this “high” by the lower panel’s oscillator, Gold within 21 trading days (one month) has declined by an average -6.1% (which from here would be -227 points into revisiting the upper 3400s). All that courtesy of the “Markets Don’t Move in a Straight Line Dept.”:

Monday at 18:19 GMT brings 2025’s autumnal equinox, (which for you WestPalmBeachers down there you call “the first day of fall”). Query: Shall “fall” arrive as a double entendre at Broad and Wall? For the S&P has gone far beyond any dutiful call…

But you can stay secure with Gold through it all!
Cheers!
…m…
www.TheGoldUpdate.com
www.deMeadville.com
and now on “X”: @deMeadvillePro
19 September 2025 – 08:39 Central Euro Time
The S&P 500 is at an all-time closing high (6632) following yesterday’s all-time intraday high (6657). The Spoo however is weaker this morning (6687) and presently below its Neutral Zone for today, as are the Bond, Swiss Franc and Oil; above same is Silver, and session volatility for the BEGOS Markets is moderate. Amongst the five primary BEGOS components, the best current correlation is positive between Gold and Oil. Gold, after reaching another All-Time High this past Wednesday (3744) is by its daily technicals showing the earliest signs of perhaps some price pullback: more on that in tomorrow’s 827th consecutive Saturday edition of The Gold Update. And Copper’s “Baby Blues” (see Market Trends) just confirmed a sell signal last evening, the level of the Blues having settled below the key +80% level. The Econ Baro is quiet today following a rather choppy week of 14 incoming metrics.
18 September 2025 – 08:41 Central Euro Time
Moving on from the Fed’s “non-event” -25bp Funds rate reduction, we’ve at present both the Bond and Spoo above today’s Neutral Zones, whilst all six of the other BEGOS Markets are below same; session volatility is firmly moderate. Specific to the positioning of the five primary BEGOS components vis-à-vis their Market Values in real-time: the Bond is 1^15 points “high” above its smooth valuation line, the Euro basically in sync with its valuation line, Gold +208 points “high”, Oil -1.17 points “low, and the Spoo +165 points “high”. Yesterday the S&P 500 posted a second consecutive down day for just the second time across the past 18 trading sessions, the “live” futs-adj’d P/E now 47.5x. And the Econ Baro concludes its week today with metrics that include September’s Philly Fed index and August’s Leading (i.e. “lagging”) Indicators.