As we saw ’round this time yesterday, trading in the BEGOS Markets is quite narrow, all eight components at present within today’s Neutral Zones and volatility is very light, albeit in the context that trading ranges have expanded significantly in recent months. Yesterday’s PCE data for February was not Fed-friendly as we’ll further display in tomorrow’s 856th consecutive Saturday edition of The Gold Update. The leading MoneyFlow for the S&P 500 cautiously suggests lower levels are ahead: by our page thereto, on the one-week basis the Index “ought be” -91 points lower than ’tis (currently 6825), on the one-month basis -139 points lower, and on the one-quarter basis a more dire -807 points lower; as trading/investing entities start to sense this going forward, it can pressure prices. The Econ Baro wraps the week with April’s UofM Sentiment Survey, March’s CPI and Treasury Deficit, plus February’s Factory Orders.
 Mark
Mark
09 April 2026 – 08:45 Central Euro Time
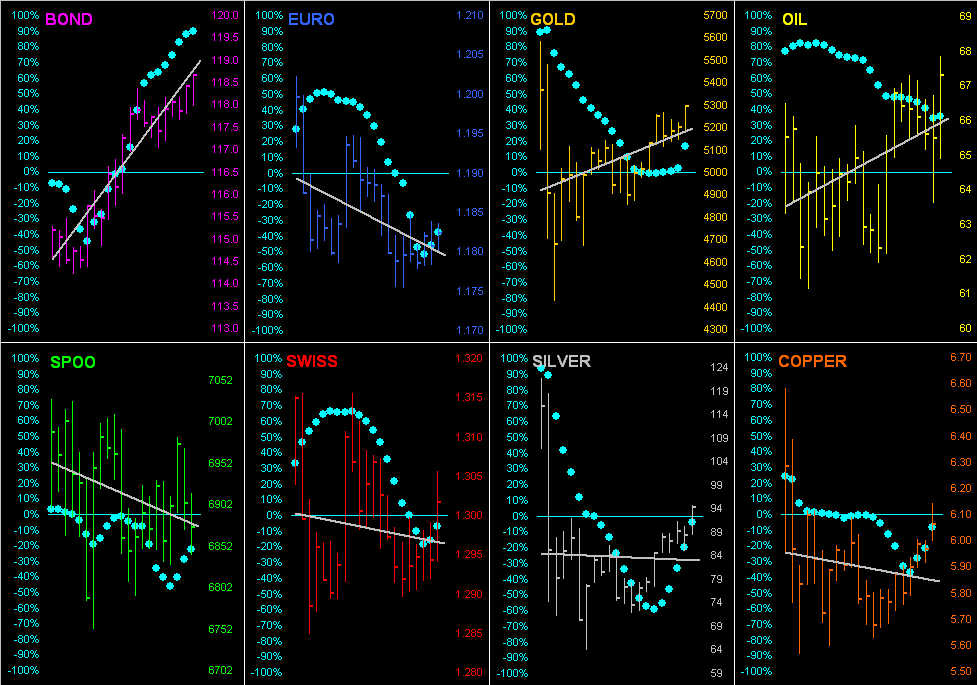
“Quiet” is the watchword for the BEGOS Markets thus far, all eight at present within their respective Neutral Zones for today; session volatility is exceptionally light. That noted, there still exist some near-term valuation extremes are we go ’round the horn for the Market Values of the five primary BEGOS components, where in real-time we’ve: the Bond -3^19 points “low” below its smooth valuation line, the Euro -0.015 points “low”, Gold -377 points “low”, Oil +13.79 points “high” and the Spoo -67 points “low”. Yesterday’s net -12.5% drop in Oil was sufficient to confirm price settling below its Market Magnet of 101.50, (currently price 97.52). Yesterday’s MoneyFlow into the S&P 500 was not fully supportive of the +2.5% up move, such leading indicator instead (regressed into S&P points) being +1.7%. The Econ Baro awaits metrics including the “Fed-favoured” PCE data for February, plus that month’s Personal Income/Spending and Wholesale Inventories, as well as the final revision to Q4 GDP.
08 April 2026 – 08:48 Central Euro Time
Suspension for two weeks of the war sees Oil down as much as -17.5% from last evening’s settle, current price 94.80 and below its Neutral Zone for today; above same are all the seven other BEGOS Markets, and session volatility (not surprisingly) is mostly robust. The Dollar Index is down more than -1% for third time year-to-date; the EuroCurrencies thus are getting a strong bid, the Euro itself by Market Trends finding its linreg having rotated from negative to positive, (that for the Swiss Franc lagging in such respect). Gold up to 4888 is nearly a three-week high: recall that Gold by its BEGOS Market Value has been deeply oversold, such real-time reading still finding price -285 points below its smooth valuation line. And the Spoo is firm such that were the S&P 500 to open at this instant, ‘twould so do +2.7%. Whilst nothing is due today for the Econ Baro, late in the session we’ve the FOMC 17/18 March meeting minutes.
07 April 2026 – 08:45 Central Euro Time
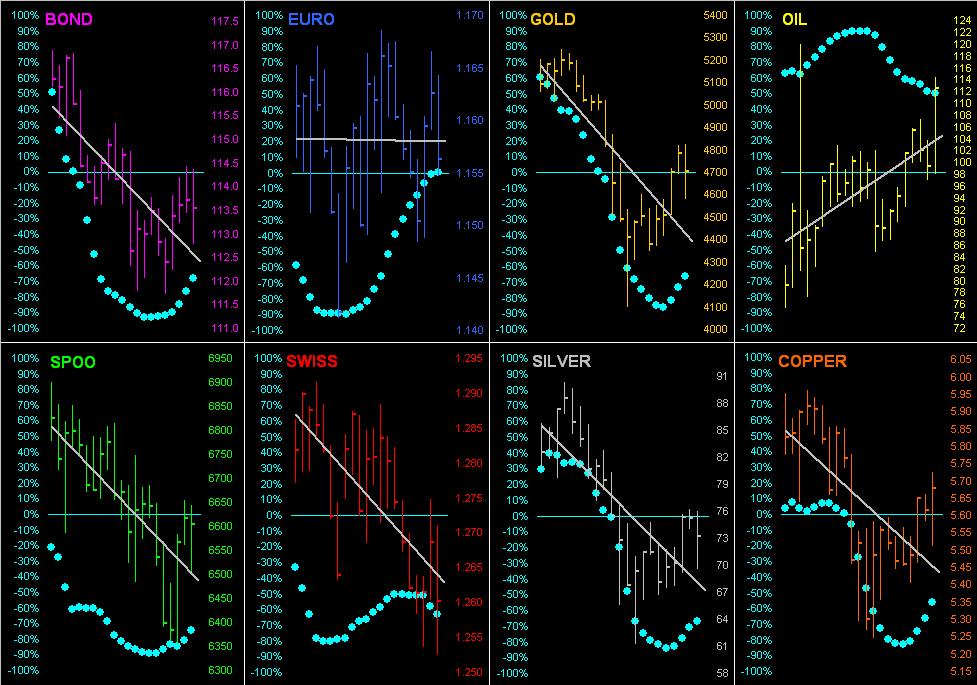
Oil is the sole BEGOS Market at present outside (above) today’s Neutral Zone; session volatility to this point is light. By their Market Profiles, the Bond, Swiss Franc and Spoo all moved yesterday above their most volume-dominant prices for the past 10 trading days, whilst Silver dropped below same, albeit today there so far lacks much continued direction. Looking at our best Market Rhythms for pure swing consistency: on a 10-test basis we’ve Gold’s 2hr Parabolics, Copper’s 6hr Moneyflow and the Euro’s 1hr Parabolics; on a 24-test basis the leaders are Copper’s 15mn Parabolics, the non-BEGOS Yen’s 30mn Price Oscillator and the Euro’s 30mn Moneyflow. The Econ Baro awaits February’s Durable Orders, plus late in the session that month’s Consumer Credit. And Q1 Earnings Season is officially underway: for Q4, 71% (an above-average pace) of S&P 500 reporting constituents bettered their bottom line of Q4 a year earlier.
06 April 2026 – 08:49 Central Euro Time
‘Tis Easter Monday on this side of The Pond, but StateSide ’tis a full trading day for the BEGOS Markets, for which at present we’ve Copper as the sole component outside (below) its Neutral Zone for today; session volatility is light. The Gold Update underscores the yellow metal’s record Q1 price volatility, overwhelming that which we’ve seen across the prior 25 years. And whilst by Market Trends the linregs remain negative for all of the BEGOS except Oil, the “Baby Blues” of trend consistency are rising notably for the Metals Triumvirate, the Bond and Spoo. The Econ Baro has a very busy week of 15 incoming metrics, including February’s “Fed-favoured” PCE data (Thursday) such that we’ll complete our inflation table through that month. Today for the Baro comes March’s ISM(Svc) Index.
The Gold Update: No. 855 – (04 April 2026) – “The Vehement Volatility of Gold”

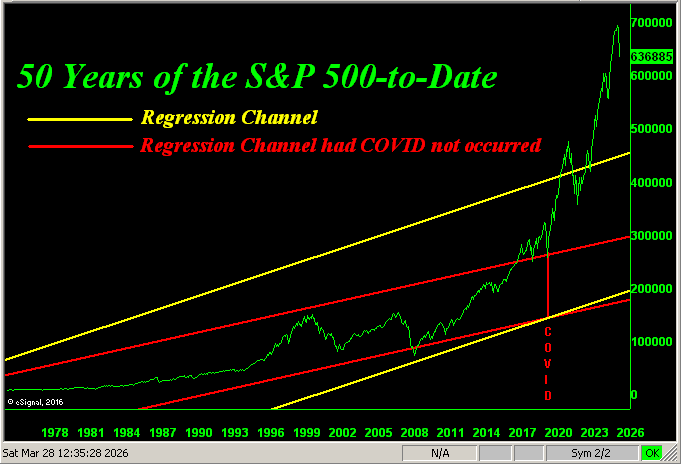
Still, both Gold and Silver are on the podium. But clearly the S&P 500 being -3.8% is certain to cause chaotic confusion for the “stocks only go up” crowd. The chilling news for such “marked-to-market millionaires” is that across the past 50 years, (which for you WestPalmBeachers down there is from 1976 through 2025), the S&P has netted 24% (i.e.12 years) that were negative … but there’s been only one down year in the past seven. Think the S&P is overwhelmingly due for a down year, or two? Reprise Murray Head from back in ’75: ![]() “Say it ain’t so, Joe”
“Say it ain’t so, Joe”![]() . Have a great day.
. Have a great day.
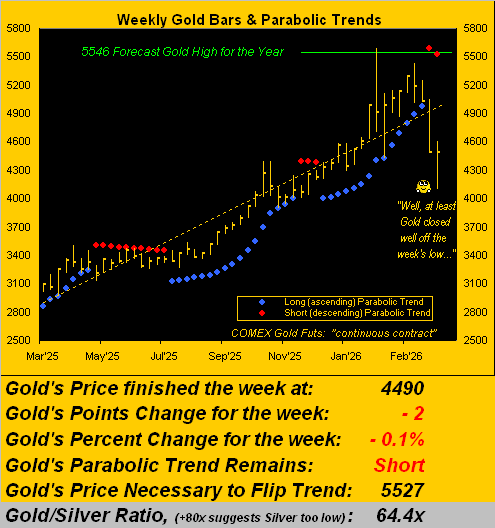
To be sure, Gold’s days are vehemently volatile, indeed as are its weeks per the following year-over-year graphic. The expected weekly trading range for Gold is now 369 points, the daily alone being 196 points. Either way — of which there’s been a lot — the red parabolic Short trend has completed a third dot. But at least Gold’s four-week losing streak is complete, this past week’s +4.7% gain a welcome treat. Moreover, Gold is still “textbook oversold” through the past 13 trading days; that would resolve upon Gold swiftly closing above 4797. ‘Course, by the opening Scoreboard, Gold is nearly -10% below its BEGOS Market Value (5220), but ’tis practically +20% above Fair Value (3930).

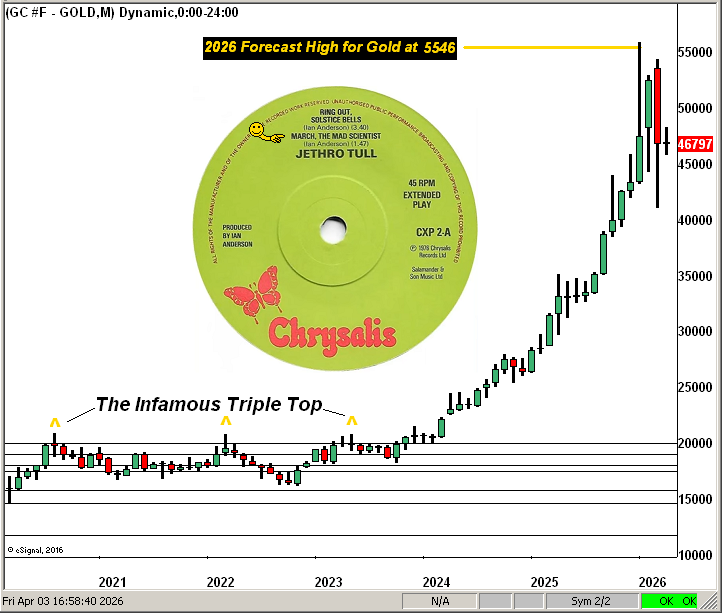
Now again, it being month-end, ’tis our own trend to present Gold by its monthly bars since 2020. And per ![]() “March, the Mad Scientist”
“March, the Mad Scientist”![]() by Jethro Tull from 50 years ago, this past March for the Gold bulls was maddening. ‘Tis the second right-most “candle”, which as jarringly red as it appears, finished March well off the aforementioned 4100 low. Then the right-most wee “doji” is this April’s two trading days pro tanto, (a little Latin lingo there). Here’s the whole show:
by Jethro Tull from 50 years ago, this past March for the Gold bulls was maddening. ‘Tis the second right-most “candle”, which as jarringly red as it appears, finished March well off the aforementioned 4100 low. Then the right-most wee “doji” is this April’s two trading days pro tanto, (a little Latin lingo there). Here’s the whole show:
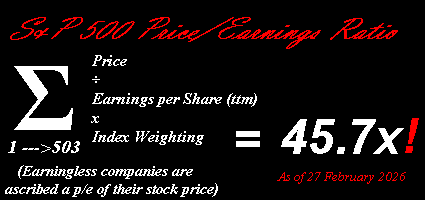
All that said, next week is the commencement of Q1 Earnings Season. You’ll recall those for Q4 found 71% of the S&P’s reporting constituents having improved their bottom lines from the like quarter a year earlier. Can such above average pace be maintained? The Baro suggests yes, but an ongoing energy crisis can eventually erode earnings. ‘Course as we oft quip, if earnings today were properly used as an equities’ valuation tool, the S&P would be half its current level, (the current price/earnings ratio still a whoppingly high 43.5x). But: ’tis different these days (until ’tisn’t).
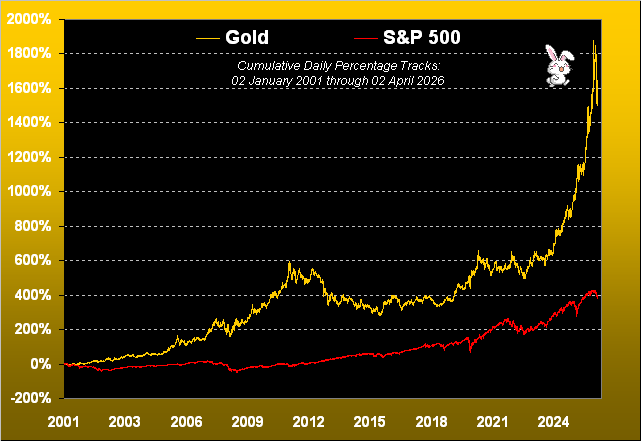
In the meantime — for those of you scoring at home — the S&P 500 (pre-yield) is +399% century-to-date (or with yield, nearly +500%); the yieldless relic — vehemently volatile Gold — is +1,618%.
So what’s in your bunny basket?
Cheers!
…m…
www.TheGoldUpdate.com
www.deMeadville.com
and now on “X”: @deMeadvillePro
03 April 2026 – 08:39 Central Euro Time
As noted yesterday, whilst today is a holiday for western bourses, because of the exceptional occurrence of this Good Friday falling on the first Friday of the month when StateSide Payrolls are released, the Bond, Currencies and Spoo are in abbreviated trading sessions such that they can respond to the data; none of those BEGOS Markets have (as yet) moved materially. Tomorrow brings the 855th consecutive Saturday Edition of The Gold Update, indeed our month and quarter-ending piece. Happy Easter!
02 April 2026 – 08:21 Central Euro Time
‘Tis the final trading day of the week, wherein at present — save for Oil being above its Neutral Zone for today — we’ve nothing but red for the seven other BEGOS Markets, all below said Zones; session volatility is mostly robust following the U.S.’ intent to ramp up war operations toward completion. As provisionally noted yesterday, both the Bond and Gold have now confirmed their “Baby Blues” of linreg consistency having crossed above the key -80% axis: however both markets are well down today (Bond -0.8%, Gold -3.8%). Looking at Market Rhythms for pure swing consistency, our leaders (10-test basis) are Copper’s 6hr Moneyflow and both Gold’s 12hr Parabolics and 1hr Price Oscillator; too, (24-test basis), we’ve the non-BEGOS Yen’s 15mn Moneyflow, Gold’s 2hr Moneyflow and Silver’s 30mn Parabolics. Today’s Econ Baro incoming metrics include February’s Trade Deficit. Whilst western bourses are closed tomorrow, we’ll nonetheless have a brief comment, noting that StateSide Payrolls shall be reported, for which the Bond, EuroCurrencies and Spoo have an abbreviated Friday session so as to respond to the data.
01 April 2026 – 08:35 Central Euro Time
Yesterday’s +2.9% net gain in the S&P 500 was the largest since 13 May a year ago (+3.3%); that for Gold of +4.2% was the most since 03 February (+6.2%). At present, the Bond, EuroCurrencies and Spoo are above their respective Neutral Zones for today; the balance of the BEGOS Markets are within same, and session volatility is light-to-moderate. By Market Trends, yesterday both Silver and Copper confirmed their “Baby Blues” of linreg consistency having moved above their key -80% axes, indicative of still higher prices near-term; today, the Blues for Gold have provisionally moved up above same. Oil (98.36) has traded down to just above its most volume-dominant Market Profile price of 98.00. Scheduled metrics for the Econ Baro are March’s ADP employment data and ISM(Mfg) Index, February’s Retail Sales, and January’s Business Inventories.
31 March 2026 – 08:42 Central Euro Time
The final trading day of Q1 finds at present the Bond, Gold, Silver and the Spoo above today’s Neutral Zones; Oil is below same, and BEGOS Markets’ volatility is again moderate. The Bond yesterday moved above what had been volume-dominant Market Profile resistance (112^22), price now a full above above that at 113^22; similarly, Copper moved above same (5.470) to now 5.509; both markets however — as remains the case for every BEGOS component except Oil — are in negative linreg (see Market Trends). Gold (presently 4591) is just beneath its most volume-dominant Market Profile resistor of 4598; too Gold is still considerably below its BEGOS Market Value of 5243, that measure itself having begun to roll over to the downside. The Econ Baro awaits March’s Chi PMI and Consumer Confidence.
30 March 2026 – 08:36 Central Euro Time
Into the new week we’ve at present the Bond, Gold and Copper above today’s Neutral Zones; the balance of the BEGOS Markets are within same, and session volatility is moderate. The Gold Update depicts price as being (by percentage) about equidistant (i.e. “♫ Stuck in the Middle with Gold ♫” between its BEGOS Market Value (some +14% higher than price) and its Fair Value (some -14% lower than price). As to our Market Values for all five primary BEGOS Components (in real-time): we’ve the Bond as -6^30 points “low” beneath its smooth valuation line, the Euro as -0.050 points “low”, Gold as -729 points “low”, Oil as +26.58 points “high”, and the Spoo as -620 points “low”. The Econ Baro is quiet today ahead of 14 incoming scheduled as the week unfolds.
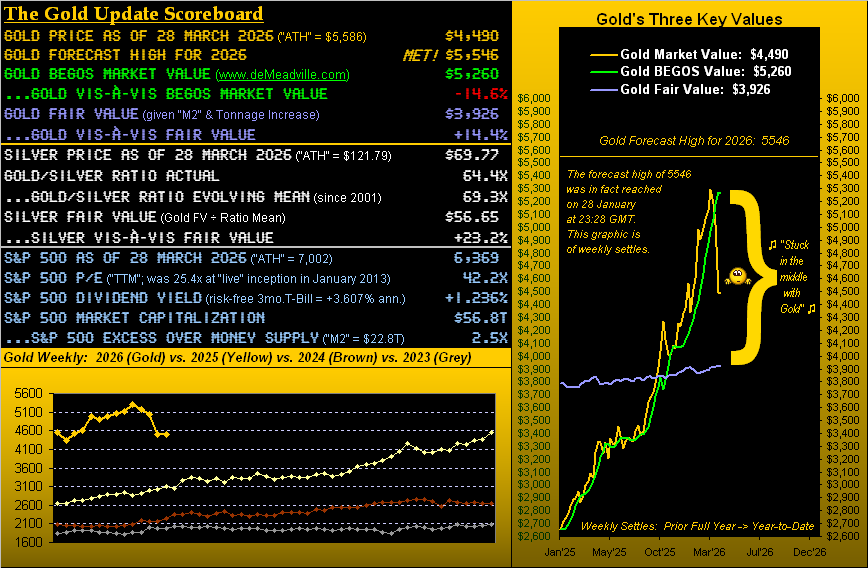
The Gold Update: No. 854 – (28 March 2026) – “♫ Stuck in the Middle with Gold ♫”
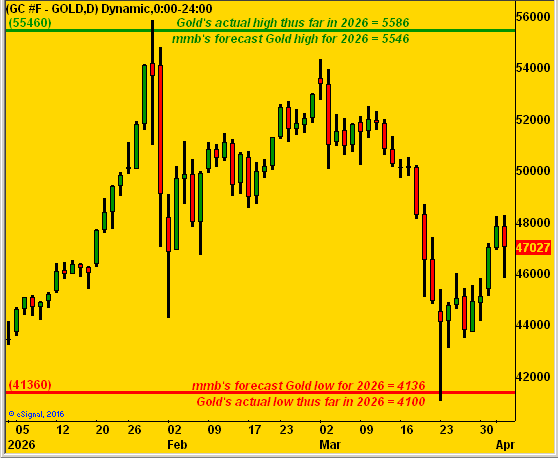
In two trading-days time, 2026 shall be 25% complete. And as was calculated back at New Year, our expected yearly trading range for Gold in 2026 came to 1410 points between the low and high. Or by percentage range, were the low to come first, the high would later be +34.1% above the low, else if vice-versa, the low -25.4% below the high, (the latter directionally being the case year-to-date).
But so far through not quite three months, the range has already surpassed our expectation in spanning 1486 points, or -26.6%, from the 29 January high of 5586 down to the 23 March low of 4100. More on Gold’s extremes vis-à-vis what we had precisely forecast come next Saturday’s month-end/quarter-end piece; (a shameless plug, that).
To be sure, from the “Means Reversion Dept.” — barring your having slept through last Monday’s trading session — that day’s low of 4100 was a “mere” +5.4% (+210 points) above Fair Value of then 3890. We say “mere” as by Gold’s All-Time High of 5586, price at that instant was +43.0% (+1681 points) above Fair Value of then 3905; (the latter has since slipped a tad given the immaterially periodic refining of the money supply).
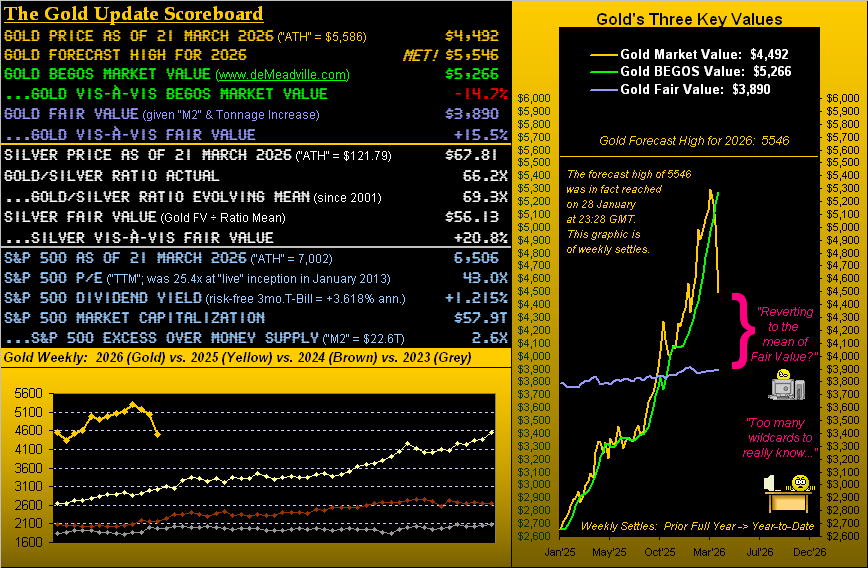
Either way, in settling the week yesterday (Friday) at 4490, Gold per the above opening Scoreboard is now fundamentally +14.4% (+564 points) above Fair Value, but technically is nearly an identical -14.6% (-770 points) below its BEGOS Market Value. Cue ![]() “Stuck in the Middle with You”
“Stuck in the Middle with You”![]() –[Stealers Wheel, ’72]. Cue, too, Gold’s year-over-year track and — just now rolling over — smooth BEGOS valuation line per our proprietary view:
–[Stealers Wheel, ’72]. Cue, too, Gold’s year-over-year track and — just now rolling over — smooth BEGOS valuation line per our proprietary view:
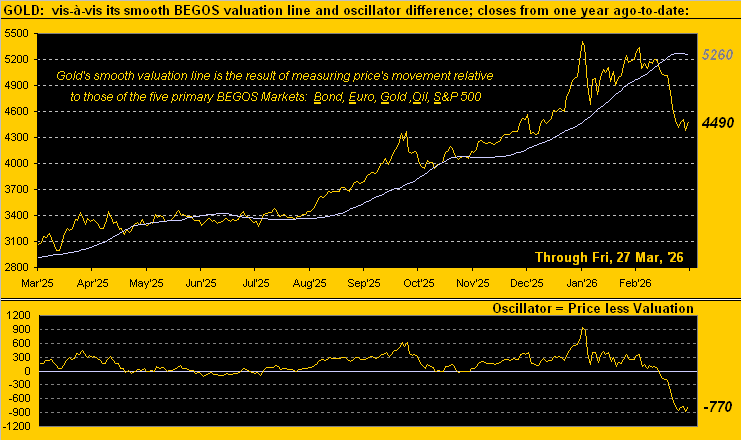
So there we have it: Gold today at 4490 is nearly equidistant between its BEGOS Market Value (5260) which has just begun to descend, and its Fair Value (3926) which is in ascent. So as to where Gold travels near-term, whilst fundamentals remain the ultimate driver of price, the swifter technicals are negative in many respects. As noted earlier for guidance, Gold’s best trading studies are comprehensively tested every night in order to qualify at our Market Rhythms page. Regardless, as herein emphasized, Gold is basically at the midpoint between our two critically important valuation metrics. But in this case, being stuck in the middle clearly is good (dare we say) “Fortuna”!

Cheers!
…m…
www.TheGoldUpdate.com
www.deMeadville.com
and now on “X”: @deMeadvillePro
27 March 2026 – 08:34 Central Euro Time
The Bond currently is below its Neutral Zone for today, whilst above same are all three element of the Metals Triumvirate; session volatility for the BEGOS Markets is again light. Gold’s cac volume is rolling from April into that for June with +33 points of fresh premium; more on Gold, ‘natch, in tomorrow’s 854th consecutive Saturday edition of The Gold Update. The Spoo yesterday moved below its most volume-dominant price (6639) for the past fortnight (see Market Profiles); as fundamentally expensive as is the S&P 500 (“live” futs-adj’d P/E 43.2x), the Index is “textbook oversold” through the last 15 trading days and the Spoo itself is (in real-time) -514 points below its smooth valuation line (see Market Values). The Econ Baro wraps its quiet week with the March revision to the UofM Sentiment Survey.
26 March 2026 – 08:45 Central Euro Time
The Bond, Gold and Silver all are presently below their respective Neutral Zones for today; the balance of the BEGOS Markets are within same, and session volatility is light. The Swiss Franc by its Market Profile yesterday moved below what had been volume-dominant support at 1.280: price is now 1.273; by Market Trends, as is the case for every BEGOS component except for Oil, the Swiss Franc and Euro are in negative linreg, but both are becoming less consistently down as the Dollar Index keeps falling back from the 100 level (currently 99.515). The S&P 500 is basically down -6% from its all-time high (7002): however by our MoneyFlow page, the Index (6592) “ought be” -95 points lower by the five-day measure, -196 points lower by the 21-day measure, and -737 points lower by the 63-day measure; the “live” P/E of the S&P (futs-adj’d) is 44.3x. Today for the Econ Baro we’ve just the usual Initial Jobless Claims from the prior week.
25 March 2026 – 08:45 Central Euro Time
Both the Swiss Franc and Copper presently are below today’s Neutral Zones, whilst above same is Gold; BEGOS Markets’ volatility is light-to-moderate. Going ’round the horn of Market Values for the five primary BEGOS components, we show (in real-time) the Bond as -7^15 points “low” vis-à-vis its smooth valuation line, the Euro as -0.053 points “low”, Gold as -721 points “low”, Oil as +17.43 points “high” and the Spoo as -451 points “low”. Oil yesterday by Market Trends saw the “Baby Blues” of trend consistency drop below the key +80% axis, indicative of still lower prices near-term: obviously the wildcard in this case is the war; thus a Short is fine, but with a firm stop in line(!); by Oil’s Market Profile, the most volume-dominant price resistor is 94.20, (vs. current price at 88.61). Today’s Econ Baro looks to February’s Ex/Im Prices and Q4’s Current Account Deficit.
24 March 2026 – 08:38 Central Euro Time
No, Gold’s intra-day drop yesterday of -9.6% was not a record; and even as Gold recovered to finish the session just -1.8%, the low trade of the day at precisely 4100 was “only” +210 points above Fair Value of 3890 … just in case you’re scoring at home. At present, Gold is in its Neutral Zone for today, as are six of the other BEGOS Markets, Copper being the sole exception below same; session volatility vis-à-vis yesterday has cooled to moderate. Topping our Market Rhythms for pure swing consistency on a 10-test basis are Silver’s 15mn Moneyflow and 30mn Price Oscillator, plus the Bond’s 30mn Moneyflow; on a 24-test basis, the leaders are Silver’s 2hr Parabolics, the non-BEGOS Yen’s 2hr MACD, and Gold’s 4hr Price Oscillator. The Econ Baro awaits the usual revisions to Q4’s Productivity and Unit Labor costs.
23 March 2026 – 08:46 Central Euro Time
Gold is -7% this morning having traded down into the 4100s: The Gold Update specifies the yellow metal having taken a double-shot of technical adversity (parabolics and MACD on the weeklies), including a table of how typically “low is low” suggestive of the 4100s; it didn’t take long; Gold is now not that far above Fair Value (3890), albeit is more than -1,000 points below its BEGOS Market Value (5275). Obviously, at present Gold is also below today’s Neutral Zone as too are Silver, Copper, the Spoo, the Bond and the Euro; Oil is above same, and session volatility for the BEGOS Markets is moderate-to-robust. With the Spoo -1.4%, the S&P 500 would at this instant open down -0.9%. The Econ Baro begins its somewhat subdued week with January’s Construction Spending.
The Gold Update: No. 853 – (21 March 2026) – “Gold’s Double-Shot of Technical Adversity”
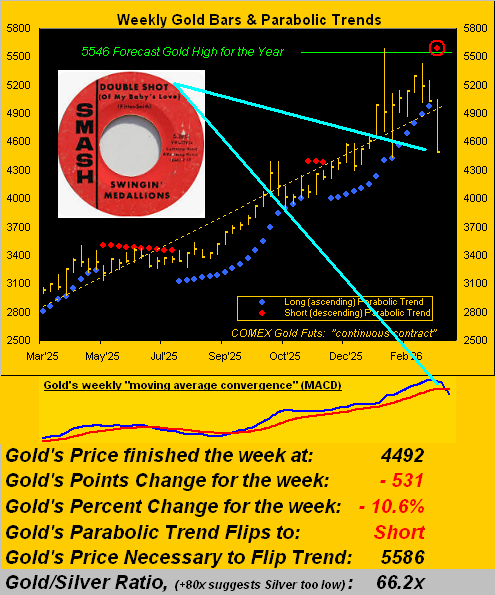
But wait, there’s more: note the above graphic’s being embedded with the now negatively-crossed “moving average convergence divergence” (MACD), the momentum of the blue line having powered down below the red line. We’ve thus now adversity by both the parabolics and momentum: hardly the ![]() “Double shot of my baby’s love”
“Double shot of my baby’s love”![]() we relish romancing for Gold, (hat-tip The Swingin’ Medallions, ’66).
we relish romancing for Gold, (hat-tip The Swingin’ Medallions, ’66).
“But negative MACDs on the weekly haven’t been that bad, right mmb?”
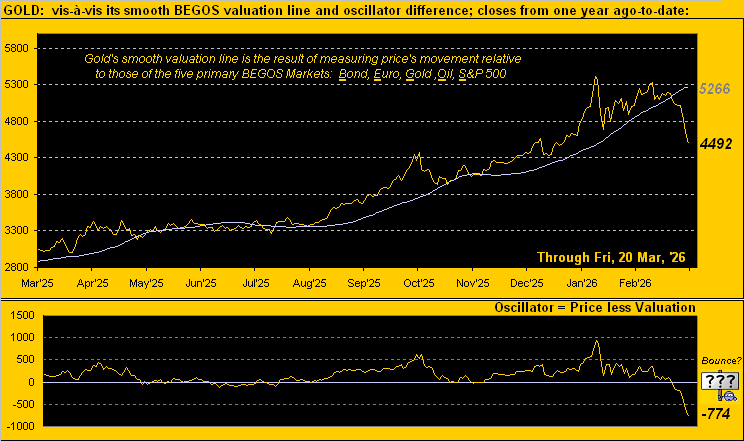
Squire, in looking at any broad-term chart of Gold from the year 2019-to-date, price has been in rally mode, (the current overvaluation downside lurch notwithstanding). Indeed, the price of Gold started 2019 at 1285 and at 4492 today is an impressive 3.5x that opening price of just over seven years ago. By comparison, the S&P 500 opened the same year at 2477 and is now 2.6x higher at 6506. And yet throughout when specific to these two markets, the FinMedia’s focus has essentially been 99% on the S&P and 1% on Gold. Oh well … perhaps they’ll figure it out someday.
Despite that, again as above graphically described, Gold has just taken a double shot of technical adversity per the weekly MACD and parabolics.
“Which, mmb, begs the usual question of ‘How low is low?’…”
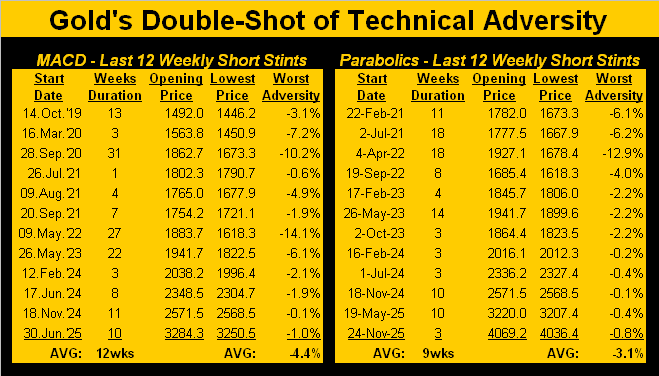
The answer being, Squire, that none of us know. Yet, we’ve history as a hint as to how low Gold may go. The following two-panel table of weekly stints displays Gold’s worst adversity for the last 12 MACD Short signals on the left and for the last 12 parabolic Short signals on the right. ‘Tis important to note that given Gold’s bold performance, adversity certainly from 2023-to-date has been comparatively minimal. And whilst “average” hardly is “absolute”, at the foot of each panel is the average Short weeks’ duration before flipping back to Long: 12 weeks for the more ponderous MACD and 9 weeks for the slightly swifter parabolics. Thus purely within the vacuum of “average” — and assuming the yellow metal opens this Monday ’round where now ’tis at 4492 — precisely hitting the MACD’s -4.4% decline would put Gold at 4294 within 12 weeks, or by the parabolics a -3.1% decline down to 4353 within 9 weeks. ‘Course, given Gold’s expected daily trading range is presently 167 points — let alone the weekly being 340 points — price could touch such adversity in a single day. Here’s the table either way:
Three weeks into the war, we’ve waxed regularly about the usual geo-political Gold “spike n’ plunge”, in so noting that ’tis a random exercise to try and regress a value for Gold based upon geo-politics. After all, since President Nixon’s nixing of The Gold Standard back on 15 August 1971, our 55-year regressing of Gold to the U.S. money supply has served well for valuing the yellow metal, even as its own supply has more than doubled since then. But the following thought has occasionally come to mind, (and doubtless same to many of you, too):
What if — to pay off the StateSide federal debt of now $39T — the Fed merely made an accounting entry of same, and ’twas distributed to all the creditors? To be sure, the “M2” money supply would leap 2.7x from today’s $22T to some $61T. Inflation would become hyper-impalpable. And were it to happen, say, over this weekend, Gold having settled Friday at 4492 would open Monday at 10,606 (by Fair Value precision) … just in case you’re scoring at home. “Got Gold?”
In summary, we offer this from the “Don’t Be That Guy Dept.”: Gold’s double-shot of technical adversity may see price work further low, but to let go of your Gold would be a bad blow!

Cheers!
…m…
www.TheGoldUpdate.com
www.deMeadville.com
and now on “X”: @deMeadvillePro
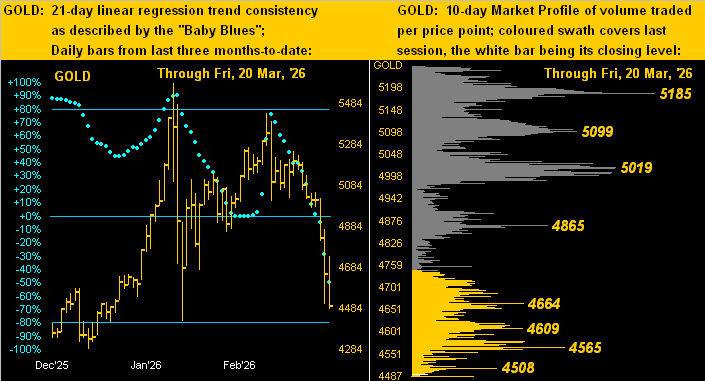
20 March 2026 – 08:43 Central Euro Time
Into week’s end, we’ve at present the Euro below its Neutral Zone for today, whilst above same is Gold; BEGOS Markets’ session volatility is light-to-moderate. Gold yesterday traded down to 4505, its lowest price since 02 February; for pure swing consistency, Gold (on a 10-test basis) by Market Rhythms has been featuring the 15-minute time frame on both the Parabolics and MACD studies; more on the yellow metal’s newly negative near-term stance in tomorrow’s 853rd consecutive Saturday edition of The Gold Update. The S&P 500 from its 7002 record high (28 January) through yesterday’s low (6558) has retraced -6.3%; a full -10% correction would be completed come 6302. The Econ Baro wrapped up its week yesterday. And today marks the arrival of Northern Hemisphere spring (14:46 GMT).
19 March 2026 – 08:38 Central Euro Time
Gold, Silver and Oil are presently below today’s Neutral Zones; the balance of th BEGOS Markets are within same, and volatility for the session is moderate. As posted last evening on “X” (@deMeadvillePro), Gold’s weekly parabolic trend has provisionally flipped from Long-to-Short; price’s low trade thus far today (4749) last traded on 06 February. At Market Trends, with the exception of Oil, the seven other BEGOS components all are in negative linreg. By Market Profiles, both the Euro and Spoo yesterday moved below their most volume-dominant support levels (1.157 and 6754 respectively). The Econ Baro wraps its week this Thursday with incoming metrics that include March’s Philly Fed Index, plus January’s New Home Sales, Wholesale Inventories, and (purportedly) Leading (i.e. “lagging”) Indicators.
18 March 2026 – 08:39 Central Euro Time
Both the Bond and Spoo are at present above their respective Neutral Zones for today, whilst below same are the Swiss Franc, Copper and Oil; session volatility for the BEGOS Markets is again light-to-moderate. The S&P 500 completed an eighth consecutive day as “textbook oversold” and would see a bounce (were it to open at this instant) of +0.6%; clearly however, the Index broadly remains overvalued, the “live” futs-adj’d P/E at this moment 45.8x. Still, by Market Values, the Spoo is -336 points below its smooth valuation line. Gold’s 21-day linreg in real-time has provisionally rotated to negative, (see Market Trends). The Econ Baro awaits wholesale inflation for February via the PPI, and purportedly (again) January’s Factory Orders; then at 18:00 GMT comes the FOMC’s Policy Statement for we expect no change in rates, albeit with a cautionary note toward stubborn inflation.
17 March 2026 – 08:49 Central Euro Time
Copper is presently below its Neutral Zone for today, whilst Oil is above same; BEGOS Markets’ volatility is light-to-moderate. For the five primary BEGOS components (in real-time) by their Market Values: the Bond shows as -6^11 points “low” beneath its smooth valuation line, the Euro as 0.070 points “low”, Gold as -195 points “low”, Oil as +29.95 points “high”, and the Spoo as -410 points low: obviously all these extremes have largely been elicited by responses to the war and firming Dollar. Specific to the Spoo, it (on Friday) confirmed a negative daily EMA has crossover: thus commencing from yesterday’s open (6660), we may near-term see 6609 trade on the downside as the last 10 such crossovers — either Long or Short — have distanced at least 50 points of follow-through travel; (see the Market Rhythm chart at the foot of BEGOS Markets > S&P 500). February’s Pending Home Sales come due for the Econ Baro.
16 March 2026 – 08:36 Central Euro Time
Both Copper and the Spoo are presently above today’s Neutral Zones; the rest of the BEGOS Markets are within same, and session volatility continues to this hour as moderate. The Gold Update underscores price having fallen through the first two war weeks, and is again lower a bit this morning: the yellow metal has completed a -10% correction from its All-Time High (5586 on 29 January). As noted, Copper is higher today, albeit has not regained the volume-dominant 5.8050 level down through which it fell on Friday (see Market Profiles). April Oil has returned above the 100 handle for the first time since last Monday, however cac volume is now rolling into that for May at a price discount of -1.90; too, cac volume for the Spoo is rolling from March into that for June with +49 points of premium. For the Econ Baro we’ve March’s NY State Empire and NAHB Housing Indices, plus February’s IndProd/CapUtil.
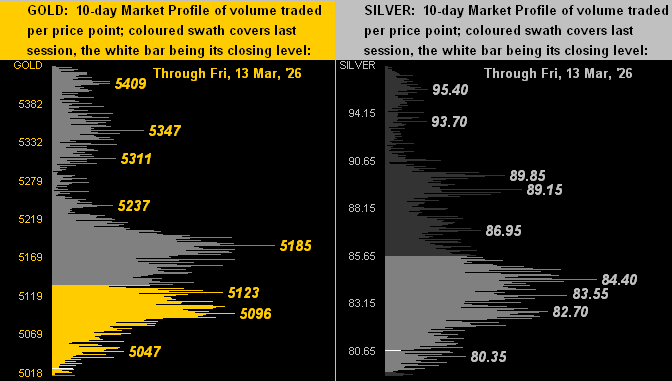
The Gold Update: No. 852 – (14 March 2026) – “Two Weeks of War Profound; Two Weeks of Gold Gone Down”

So with Gold on the wane, we go to the stack … (but hardly in vain):
The Gold Stack (continuous contract pricing):
Gold’s All-Time Intra-Day High: 5586 (29 January 2026)
2026’s High: 5586 (29 January)
Gold’s All-Time Closing High: 5411 (28 January 2026)
Trading Resistance: notables as labeled in the Market Profile
10-Session “volume-weighted” average price magnet: 5181
Gold’s BEGOS Market Value: 5179
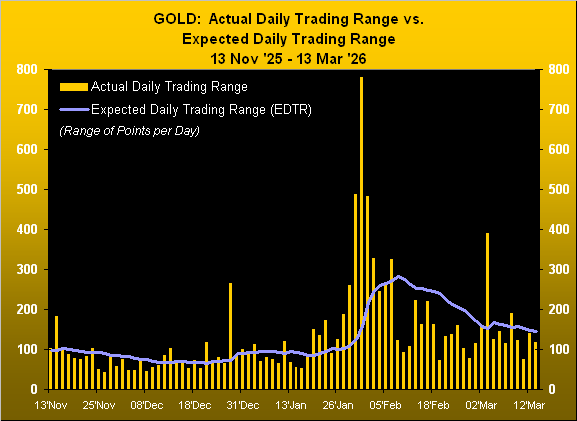
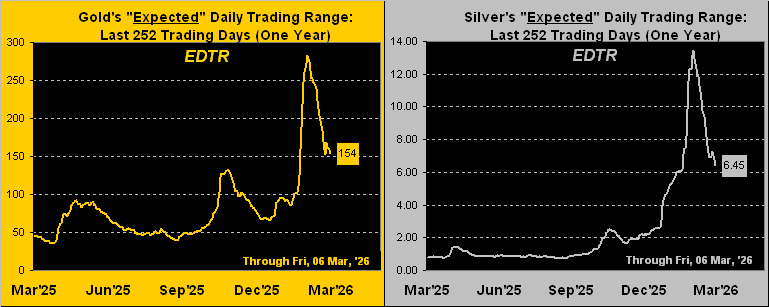
Gold Currently: 5023, (expected daily trading range [“EDTR”]: 143 points)
Trading Support: none notable by the Market Profile
10-Session directional range: down to 5013 (from 5432) = -419 points or -7.7%
The Weekly Parabolic Price to flip Short: 4972
2026’s Low: 4319 (02 January)
Gold’s Fair Value per Dollar Debasement, (from our opening “Scoreboard”): 3888
The 300-Day Moving Average: 3706 and rising
The 2000’s Triple-Top: 2089 (07 Aug ’20); 2079 (08 Mar’22); 2085 (04 May ’23)
The Gateway to 2000: 1900+
The Final Frontier: 1800-1900
The Northern Front: 1800-1750
On Maneuvers: 1750-1579
The Floor: 1579-1466
Le Sous-sol: Sub-1466
The Support Shelf: 1454-1434
Base Camp: 1377
The 1360s Double-Top: 1369 in Apr ’18 preceded by 1362 in Sep ’17
Neverland: The Whiny 1290s
The Box: 1280-1240
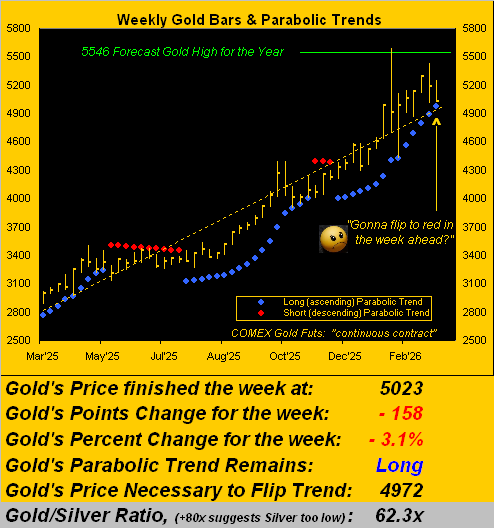
To wrap — warfare an ongoing wildcard — ‘twould otherwise appear we’ll soon see Gold slip sub-5000 and the parabolic trend flip from Long to Short, certainly so were the war to show signs of winding down, even as price presently is already -3.0% below its BEGOS Market Value. Moreover, Gold now being down -10.1% from its record high can inducing buying. But at the end of the broader day — as we regularly say — Gold remains best valued by Dollar debasement. And yes, Gold by Fair Value is overly high and due for further retracement, but ’tis always important to keep some in your basement!

Cheers!
…m…
www.TheGoldUpdate.com
www.deMeadville.com
and now on “X”: @deMeadvillePro
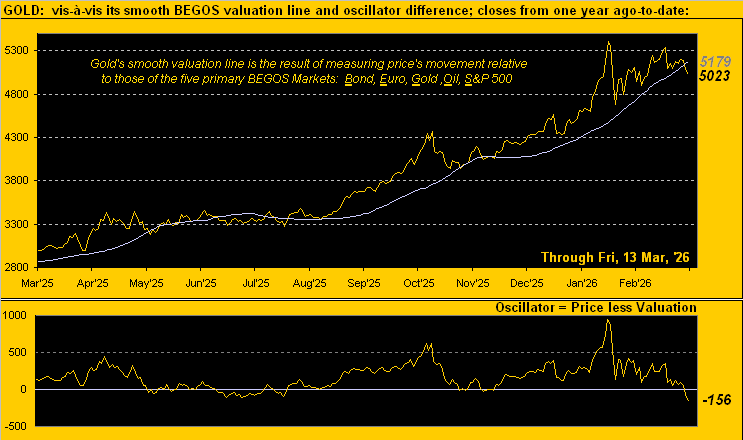
13 March 2026 – 08:32 Central Euro Time
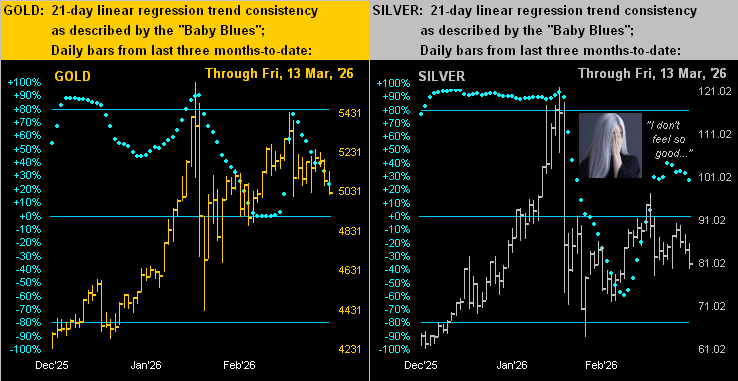
As was the case at this time yesterday, we’ve both the Euro and Swiss Franc below today’s Neutral Zones, as too are Silver, Copper and the Spoo; the Bond, Gold and Oil are within same, and session volatility for the BEGOS Markets is again moderate. Gold in its weakening uptrend (see the falling “Baby Blues” at Market Trends) has moved below its smooth valuation line, now in real-time by -95 points (see Market Values); more of course in tomorrow’s 852nd consecutive Saturday edition of The Gold Update. The S&P 500 has closed lower for eight of the past 11 trading days; technically it remains “textbook oversold”, albeit is still well-overvalued by the “live” (futs-adj’d) P/E of presently 44.8x; from the Index’s all-time high of 7002 (28 January), it has corrected by as much as -5.2% (to 6636 on 09 March). Contract volume for the Euro and Swiss Franc is rolling from March into that for June. And ’tis a busy day for the Econ Baro with incoming metrics of March’s UofM Sentiment Survey, January’s Durable Orders, Personal Income/Spending and “Fed-favoured” PCE data, along with the first revision to Q4’s GDP.
12 March 2026 – 08:42 Central Euro Time
The Euro, Swiss Franc and Spoo are all presently beneath their respective neutral Zones for today, whilst above same is Oil; BEGOS Markets’ volatility is moderate. By Market Trends, four BEGOS components are in negative linreg (the Bond, Euro, Swiss and Spoo), the other four positively-sloped (Gold, Silver Copper and Oil); however, given the volatile lurches of late, the “Baby Blues” in some cases are less consistent than the norm. Gold has slipped back below volume-dominant support of 5195 (see Market Profiles), as have both the Euro and Swiss Franc, the Dollar getting a mild bid today. Our top Market Rhythm for pure swing consistency on a 10-test basis is the non-BEGOS Yen’s 6hr Moneyflow, and on a 24-test basis again the Yen’s 2hr MACD. Metrics for the Econ Baro today include January’s Housing Starts/Permits and Trade Deficit.
11 March 2026 – 08:42 Central Euro Time
The Euro is the sole BEGOS Market at present outside (above) its Neutral Zone for today; session volatility for the BEGOS Markets is light-to-moderate. Gold is teasing either side of its Market Profile’s most volume-dominant price of 5195, (current price 5202); should such support fail, we’d look near-term down to 5105; Gold’s EDTR (see Market Ranges) is 153 points; for pure swing consistency, Gold’s best Market Rhythm has been the 4hr Parabolics (10-test basis) and 6hr Moneyflow (24-test basis). The S&P 500 has on balance worked down such as to become mildly “textbook oversold”; the Spoo by Market Values is (in real-time) -313 points below its smooth valuation line. And for the Econ Baro we await the first indications of February inflation via the CPI, even as the PCE for January shan’t be released (purportedly) until Friday; too for February we get the Treasury Budget late in the session.
10 March 2026 – 08:39 Central Euro Time
Following yesterday’s whirl ’round recovery across the BEGOS Markets — Oil notably giving back all of its extraordinary gain on the day — we’ve at present the Swiss Franc, Gold and Silver above their Neutral Zones, whilst the balance of the BEGOS bunch are within same; session volatility is mostly moderate. Save for Oil, at Market Trends the “Baby Blues” of linreg consistency are falling for the seven other BEGOS components. The Bond, after trading as anticipated down into the 115s, recovered enough to clear its most volume-dominant Market Profile resistor at 116^12, price now 116^17; for the past two trading days, the Bond’s 15mn Moneyflow has been our best Market Rhythm for that component by pure swing consistency. The Econ Baro gets its busy week underway today with February’s Existing Home Sales.
09 March 2026 – 08:43 Central Euro Time
Save for Oil (+10.1%) which is above its Neutral Zone for today, the seven other BEGOS Markets all are below same; session volatility is robust, Oil having traced 473% of its EDTR (see Market Ranges). The Gold Update underscores last week’s price decline as was anticipated; the yellow metal today (-1.4%) is just about in sync (+28 points) with its smooth valuation line (see Market Values), price reverting to that “mean”; for the other primary BEGOS Components: the Bond is -2^27 points below valuation, indeed trading in the 115s as we suggested ‘twould; the Euro shows as -0.056 points below same, the Spoo is below by -442 points, but Oil is far above valuation by +37 points. Despite the Spoo’s large deviation below its valuation line, the futs-adj’d P/E of the S&P remains critically high at 44.4x. Nothing is due today for the Econ Baro ahead of 16 scheduled metrics as the week unfolds.
The Gold Update: No. 851 – (07 March 2026) – “Gold’s War Slide is No Surprise”


As for the StateSide economy’s norm, we’re not fully convinced of various measures being on form. To date, some reports continue to be confounded from the last October-November government “shutdown”. Take this past week as an example: on Wednesday, Automatic Data Processing issued for February very improved Employment data over that for January. But then the Bureau of Labor Statistics issued February Payrolls shrinkage for the first time since that for October, (such month’s negative data we sense having been roughly pieced together, even as ADP back then reported gains).
The point (albeit a question) is: is the Federal Reserve’s Open Market Committee being put in a stagflationary box with Payrolls declining whilst inflation is rising? Cue Murray Head from ’75: ![]() “Say It Ain’t So, Joe”
“Say It Ain’t So, Joe”![]() as we go to the Baro:
as we go to the Baro:
Towards wrapping, we’ve this from the “FinMedia Exaggeration Dept.” Of the nine full trading weeks thus far this year, the past one for the S&P 500 ranked third (not most) for total points distance traveled (6901 to 6710, i.e. -191 points or -2.8%). Yet, an intra-day drop of -1.96% on Thursday for “The Dow” (that Index at which our parents used to look) was reported by a financial source we encountered as a “crash”: “they” don’t know what a crash looks like.
But the best descriptive verb we read came (again) from Bloomy, referring to the Middle East war as have roiled the markets, (our selectively therein highlighting oil). Having closed the prior Friday at 67.29, West Texas Intermediate Oil reached up to as high as 92.61 yesterday, an intra-week gain of nearly +38% to a price not seen since 29 September 2023. And with the Straits of Hormuz being characterized as “shut”, TV news here showed cars in long lines for petrol in places like Nice and Grasse. Back to the 70s we go? We hope not so.
But with respect to energy consumption there is some good news: StateSide, they shan’t be burning as much midnight oil. Why? Because with two full weeks of winter still in the balance, the U.S. “tonight” ridiculously moves to summer hours:

Why do we care? Because given the long-standing tradition of The Gold Update being posted each Saturday at 11:00 Pacific Time, if you’re outside most of North America, the following three editions (each of 14, 21 and 28 March) can be read an hour earlier as on this side of The Pond we’ll still more sensibly be on winter hours until 29 March; (thus in this CET time-zone at 19:00 instead of the usual 20:00).
Either way, price’s present slide aside, regardless of your hour, just stay with Gold’s power!
(Oh good grief, Squire…)
Cheers!
…m…
www.TheGoldUpdate.com
www.deMeadville.com
and now on “X”: @deMeadvillePro
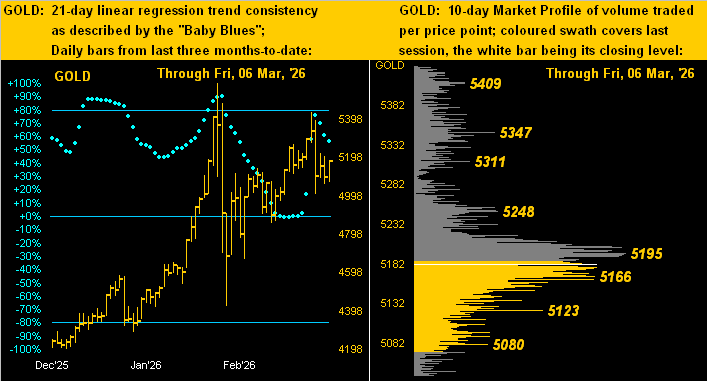
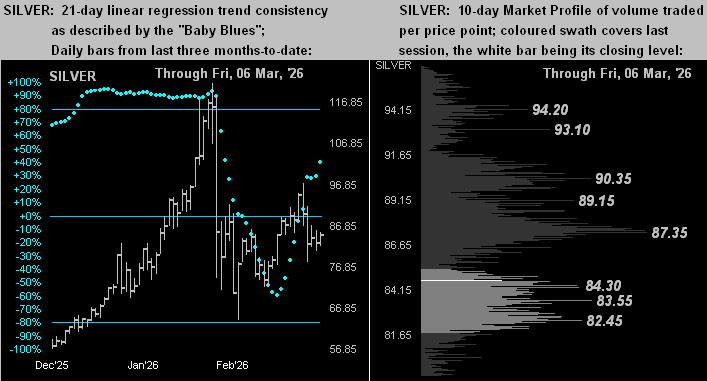
06 March 2026 – 08:32 Central Euro Time
Gold, Silver, Oil and the Spoo all are at present above today’s Neutral Zones; the balance of the BEGOS Markets are within same, and session volatility is light. Looking at Market Rhythms for pure swing consistency, our Top Three (on a 10-test basis) are Gold’s 30mn MACD, the Euro’s 8hr Parabolics and same for the non-BEGOS Yen; too, (on a 24-test basis) we’ve the Yen’s 2hr MACD and 1hr Parabolics, plus Gold’s 4hr Parabolics. Specific to the Spoo, its most consistent Rhythm has been (10-tests) the 15mn Price Oscillator and (24-tests) daily Moneyflow. Tomorrow brings our 851st consecutive Saturday edition of The Gold Update, in which we’ll emphasize (as was rather anticipated) price now being lower than ’twas pre-war. Finally for the Econ Baro, we’ve sources that conflict (the government “shutdown” hangover still affecting the data flow) as to what actually gets reported today: to be sure, metrics shall include Payrolls data for February along with Retail Sales and Consumer Credit for January; too, there may one or more reports as to various Inventories measures and Factory Orders.
05 March 2026 – 08:39 Central Euro Time
The Bond, EuroCurrencies and Copper are presently all below today’s Neutral Zones, whilst above same is Oil; session volatility for the BEGOS Markets is again moderate. The Bond’s “Baby Blues” of linreg consistency (see Market Trends) confirmed settling below their key +80% axis, suggestive of still lower prices: currently 116^15, an excursion from here down into the 115s wouldn’t be untoward; the yield on the underlying 30yr Bond itself (4.716%) has been increasing this week such that its MACD is poised to make a positive crossing; overhead Bond resistance is 117^00 (see Market Profiles). Meanwhile, the yield on the S&P 500 is 1.155% and the “live” (futs-adj’d) P/E is 45.9x. Amongst today’s incoming metrics for the Econ Baro we’ve January’s Ex/Im Prices (and purportedly that month’s still “shutdown” delayed Factory Orders), plus Q4’s initial Productivity and Unit Labor Costs.
04 March 2026 – 08:34 Central Euro Time
Both the Bond and Spoo are presently below today’s Neutral Zones; above same are (save for the Euro) all the other BEGOS Markets, and volatility is moderate. Prior to the conflict in the Middle East, Gold settled Friday at 5296; price Monday then peaked at 5434 before settling yesterday at 5100, thus recording yet another geo-political “spike n’ plunge” for the yellow metal. By Market Magnets, the following BEGOS components crossed below that leading measure yesterday: the Bond, Gold, Silver, Copper and the Spoo; too, the Bond crossed beneath its BEGOS Market Value. Today (in real-time) by Market Trends, the “Baby Blues” of linreg trend consistency are falling for every BEGOS Market except Oil, which yesterday reached as high as 77.98 after settling pre-conflict on Friday at 67.83; notable volume-dominant Market Profile supports for Oil are 72.00 and 66.50. For the Econ Baro we await February’s ADP Employment data and the month’s ISM(Svc) Index. Then late in the session comes the Fed’s Tan Tome.
03 March 2026 – 08:34 Central Euro Time
At present we’ve the Bond, Euro, Swiss Franc, Silver and the Spoo all below their respective Neutral Zones for today, whilst Oil is above same; BEGOS Markets’ volatility is moderate-to-robust. Gold (having settled last Friday at 5296), traded as a geo-political spike yesterday up to 5434 (+138 points over Friday); now at 5327 ’tis but +31 points over Friday: as we’ve oft written, when Gold gets a geo-political spike, price then tends to return from whence it came, and indeed today’s low thus far of 5292 is -4 points below Friday. By Gold’s Market Profile, 5191 remains price’s most volume-dominant supporter. As for Oil, now at 73.33 ’tis 10.01 points above its smooth valuation line, (see Market Values). The Dollar Index thus far this session has traded up to its highest level since 22 January at 98.765. Nothing is due today for the Econ Baro ahead of 15 metrics scheduled for the balance of the week.
02 March 2026 – 08:40 Central Euro Time
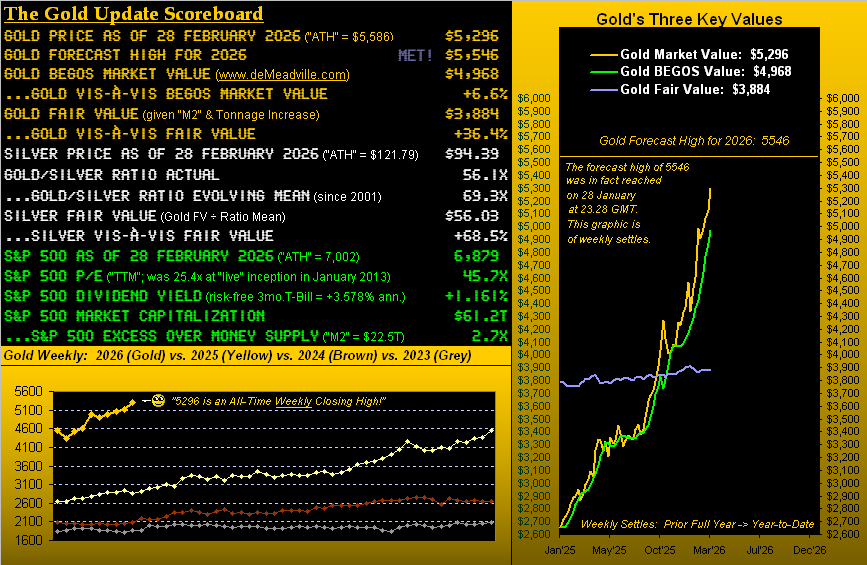
Saturday’s Gold Update cites the 5400s as already trading on the weekend; the COMEX high for the Monday session thus far is 5434. At present, Gold, Silver and Oil are above today’s Neutral Zones and respectively are +2.5%, +1.7%, and +8.2%; below same are the Bond, EuroCurrencies and the Spoo, itself -1.2%; session volatility for the BEGOS Markets is mostly robust. We are keen to see if Gold near-term reverts back from whence it has come as typically is its wont following geo-political price spikes: currently 5423, Gold settled Friday at 5296, its BEGOS Market Value (in real-time) 4984 and Fair Value 3884. On verra. Q4 Earnings Season has concluded: for the 457 S&P 500 constituents having therein reported, 71% improved their bottom lines over Q4 a year ago, bettering the average improvement pace of 66%; but as we regularly caution, the S&P’s overall level of earnings is considerably low relative to price, (the “live” futs-adj’d P/E at this moment 45.1x). The Econ Baro awaits February’s ISM(Mfg) Index.
The Gold Update: No. 850 – (28 February 2026) – “Gold Garners Praise, Silver Ablaze … but Must the Fed Raise? (And Now Iran Weighs)”

Towards the wrap, ‘twouldn’t be month’s end without our chart of the Gold Structure by the month from 2020-to-date. Note that the rightmost candle — indeed Gold’s eighth consecutive up month — for February could not eclipse that for January’s having reached the All-Time High of 5586; but again given the now amped-up geo-political stress, let’s see what the new week holds in store. For as sang Sly in ’69: ![]() “I want to take you higher”
“I want to take you higher”![]()
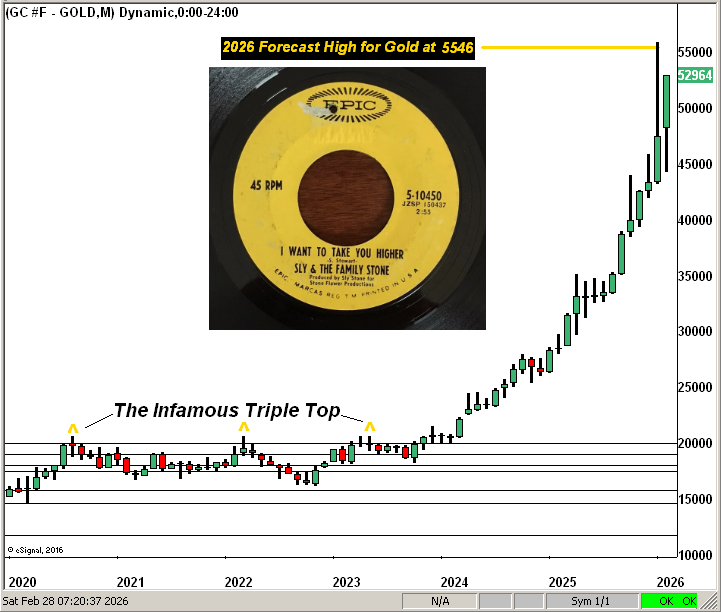
Oh look –> our long-time valued assistant Miss Gibbs (she’s a winner) just dropped on our desk this photo as transmitted today from a waving Squire during his avalanche duties up in Les Grands Montets. He sends his congrats for our making it 85% of the way to missive No. 1,000. Thanks mate, albeit one week at a time is our gait. (We wonder as well if that avalanche is a prélude to an S&P “correction”):

Closing note: following this piece’s “Opening note”, in now approaching late Saturday afternoon here, the weekend Gold trade has not furthered itself higher from the 5400s we’d seen earlier this morning. Too, ’tis reported (reliably or otherwise) the Straits of Hormuz are now closed; (if so, best get to the petrol station before the lines get long). In any event, ’tis no time for panicky trading. Instead, patiently mind your Gold rather than fold!
Cheers!
…m…
www.TheGoldUpdate.com
www.deMeadville.com
and now on “X”: @deMeadvillePro
27 February 2026 – 08:52 Central Euro Time
We’ve presently both Silver and Copper above today’s Neutral Zones; the balance of the other six BEGOS Markets are within same, and session volatility again is light. At Market Ranges, the EDTRs for all eight BEGOS components are in decline, very notably for Gold and Silver; by Market Trends, the 21-day linreg for Gold is mildly positive whilst that for Silver is mildly negative; more of course in tomorrow’s 850th consecutive Saturday edition of The Gold Update. The Spoo by its Market Profile is sitting above a swath of trading support spanning from 6903 down to 6854: to the extent that holds through the session can be affected by January’s PPI; other Econ Baro metrics also due today are February’s Chi PMI, and well in “shutdown” arrears November’s Construction Spending in tandem with that for December. And we put a wrap of Q4 Earnings Season today, which as we’ve regularly been noting has been running at an above-average pace for year-over-year improvement, but not enough so by valuation to maintain the S&P 500’s lofty P/E of 46.6x (the “live” reading as futs-adj’d).
26 February 2026 – 08:36 Central Euro Time
All eight BEGOS Markets are at present inside their respective Neutral Zones for today, session volatility being light. By Market Ranges’ EDTRs, all eight are narrower than they were both a day ago and a week earlier. Amongst the five primary BEGOS components, the best correlation currently is negative between the Bond and the Spoo; indeed by Market Trends, the Bond’s positive linreg is of the highest consistency (+87% in real-time) of all the components; the balance of the bunch find their “Baby Blues” (of trend consistency) lacking conviction regardless of current linreg direction. Our most steadfast Market Rhythm on a 10-test basis has been Gold’s 2hr Parabolics, whilst on a 24-test basis ’tis the Swiss Franc’s 4hr Moneyflow. The “live” (futs-adj’d) P/E of the S&P 500 is 46.6x and the yield a scant 1.140% (vs. that annualized for the 3mo T-Bill of 3.588%). The sole metric due today for the Econ Baro is the prior week’s Initial Jobless Claims, ahead of wholesale inflation for January (PPI) to be reported tomorrow. And two days remain in Q4 Earnings Season.
25 February 2026 – 08:47 Central Euro Time
Presently, the Bond is below its Neutral Zone for today, whilst above same is the Euro and all three elements of the Metals Triumvirate; BEGOS Markets’ volatility is light-to-moderate. Silver’s cac volume is rolling from March into May, as did that yesterday for Copper; too, the Bond’s cac volume is rolling from March to June. The Gold Update noted that a robust up move would right the yellow metal’s linreg (see Market Trends) from having briefly been negative back to positive, which indeed is the case, albeit into week’s end we may see rotation back to negative should price not further climb from the 5200s area: this is because price was significantly higher 21 days ago, the All-Time High still maintained at 5586. Silver today has regained the 90 handle for the first time since 04 February, the Gold/Silver ratio reaching back down into the 50s: ’twas 60.7x at last week’s settle, and is now in real-time 57.7x. Originally scheduled today for the Econ Baro was January’s New Home Sales; however the Census Bureau along with “HUD” continue to run behind, given last autumn’s “shutdown”.
24 February 2026 – 08:42 Central Euro Time
Per last night’s note, we experienced a data outage such that metrics from Friday were carried forward for Monday; thus pages such as Market Trends are redundant of Friday’s data for Monday; however, this shall all be corrected/resolved today and put right for tonight’s data runs. As for the present, Gold is below its Neutral Zone for today, whilst Copper is above same; session volatility for the BEGOS Markets is again mostly moderate. The Spoo thus far today is in a volume-dominant band from 6854-6874 (see Market Profiles, the data for which was not affected by the outage); Gold too is centered it a profile band spanning from 5218 down to 5170. The Econ Baro looks to February’s Consumer Confidence, and what would appear to be a re-reporting of December’s Factory Orders from last Thursday.
Data Outage Notice
Our Monday Night (23 February) runs were interrupted by a data outage such that some of the website analytics — notable those for Market Trends — are redundant to Friday’s data rather than those through Monday. Reparations shall be made during Tuesday such that we fully expect all being accurately restored-to-date by Tuesday night’s runs. …m…
23 February 2026 – 08:41 Central Euro Time
We start the week finding at present both the Euro and Swiss Franc above today’s Neutral Zones, whilst below same are Copper, Oil and the Spoo; session volatility for the BEGOS Markets is mostly moderate. The Gold Update depicts the yellow metal’s 21-day linreg trend as having rotated to negative, albeit just barely so, even as price this session has made a higher-high for a third consecutive day. Going ’round the Market Values horn in real-time for the five primary BEGOS components: the Bond is just slightly “low” (-0^13 points) vis-à-vis its smooth valuation line, the Euro -0.023 points “low”, Gold +256 points “high”, Oil +3.70 points “high”, and the Spoo -223 points “low”, although by earnings generation, the S&P 500 remains extremely overvalued. ‘Tis the final week of Q4 Earnings Season. And the Econ Baro awaits “shutdown-delayed” Factory Orders for December.
The Gold Update: No. 849 – (21 February 2026) – “Gold’s Key Near-Term Trend Rotates to Negative”
“By the way mmb, I may get called away for avalanche duty next week above Chamonix…”
Well Squire, J. P. Morgan had to do without you for an entire career, as perhaps shall we for a week. Just mind your dynamite belt.
In fact, given we opened with the empire established by Morgan, let’s close with him by crediting ol’ Pierpont in reading the de facto source for leading market information:
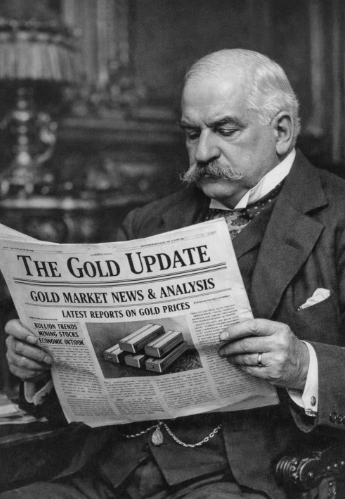
He understood the value of Gold, as having read this, do you!
Cheers!
…m…
www.TheGoldUpdate.com
www.deMeadville.com
and now on “X”: @deMeadvillePro
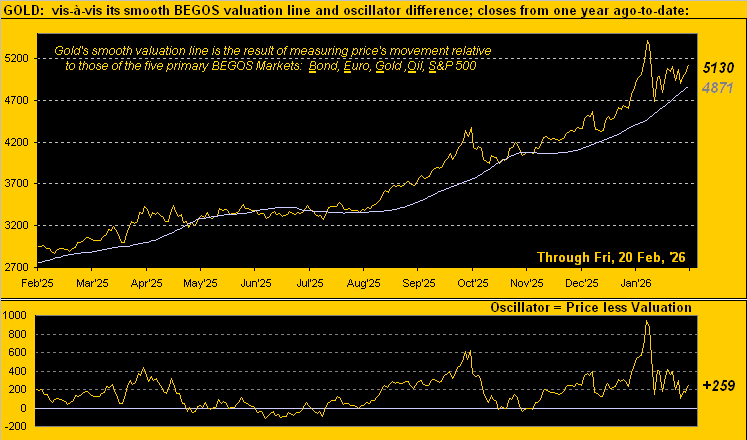
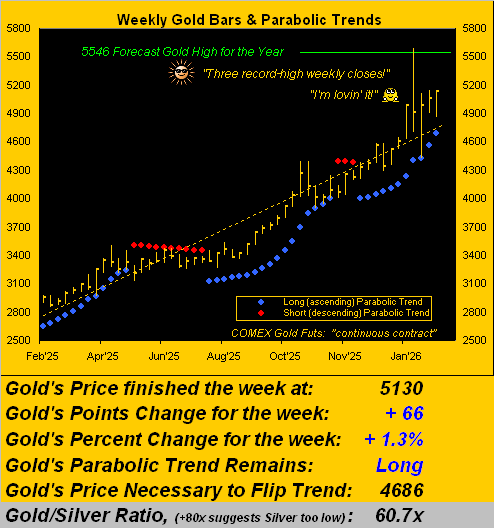
20 February 2026 – 08:41 Central Euro Time
Across the eight BEGOS Markets, just one is presently outside (below) its Neutral Zone for today: the Euro, as the Dollar’s firm February continues. Overall session volatility is again to this hour very light. Notably by Market Ranges, EDTRs are narrowing for the Euro, Swiss Franc, Gold, Silver and Copper. The yellow metal has spent the past three weeks flirting either side of the 5000 level, regardless remaining overvalued throughout both by its BEGOS valuation and Fair Value; too as anticipated, Gold’s 21-day linreg trend yesterday settled having rotated to negative; more of coure in tomorrow’s 849th consecutive Saturday edition of The Gold Update. The Econ Baro concludes its week with the revision to February’s UofM Sentiment Survey, the first peek at Q4 GDP, and Personal Income/Spending including the much FinMedia anticipated “Fed-Favoured” PCE data for December, which we sense is a bit of a non-event given we’ve already had January’s CPI.
19 February 2026 – 08:43 Central Euro Time
We’ve at present the Bond below its Neutral Zone for today, whilst above same are both Gold and Silver; BEGOS Markets’ volatility is very light. At Market Trends, the “Baby Blues” of trend consistency are now in decline for every BEGOS component, save for the Bond, the Dollar on balance improving during February; and specific to Gold, its falling Blues are (in real-time) crossing beneath the 0% axis as the trend rotates toward negative, perhaps to be confirmed into the weekend. Oil has shown strength of late, moving yesterday above what had been Market Profile resistance of 64.00, as well as back above its Market Magnet. Today’s incoming metrics for the Econ Baro include February’s Philly Fed Index, January’s Pending Home Sales, and for December the Trade Deficit, purportedly along with (in “shutdown” arrears) Wholesale Inventories and Leading (quite lagging) Indicators.
18 February 2026 – 08:50 Central Euro Time
Both the Euro and Swiss Franc are at present below their respective Neutral Zones for today, whilst above same are both Gold and Silver; session volatility for the BEGOS Markets is light. Gold’s 21-day linreg trend (see Market Trends) has all but rotated to negative, the “Baby Blues” of trend consistency poised to move below the 0% axis; too by Market Magnets, Gold confirmed moving below said metric such that we ought see still lower prices near-term, even as the precious metals are getting a bid today. The MoneyFlow for the S&P 500 remains very net-negative vis-à-vis the Index itself: by our MoneyFlow page, the S&P per this leading indicator “ought be” on be (on a one-week basis) -130 points lower than ’tis, and (on a one-month basis) -535 points lower, plus (on a one-quarter basis) -641 points lower; the S&P’s futs-adj’d “live” P/E is 45.9x. For the Econ Baro we’ve January’s IndProd/CapUtil, plus December’s Housing Starts/Permits and Durable Orders. Then late in the session come the 27-28 January FOMC Minutes.
17 February 2026 – 08:36 Central Euro Time
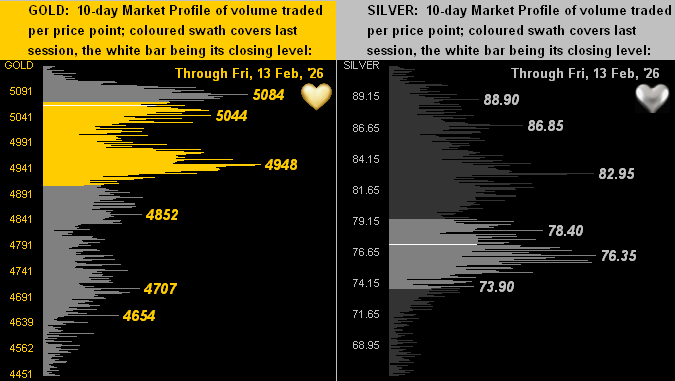
The BEGOS Markets’ two-day session continues with volatility naturally having widened from light at this time yesterday to now moderate. Above the session’s Neutral Zones are the Bond and Oil, whilst below same are the two EuroCurrencies, the three elements of the Metals Triumvirate, and the Spoo. Gold high-to-low through the combined session has declined by as much as -199 points; by Market Values, Gold (in real-time) is +131 points above its smooth valuation line after having been +418 points a week ago; too by its Market Profile, Gold has slipped below its most volume-dominant support level of 4948; ’tis the like case for Silver having eclipsed down through 76.35. Oil’s cac volume is rolling from March into that for April. The week’s parade of 18 scheduled Econ Baro metrics begins today with February’s NY State Empire and NAHB Housing Indices.
16 February 2026 – 08:42 Central Euro Time
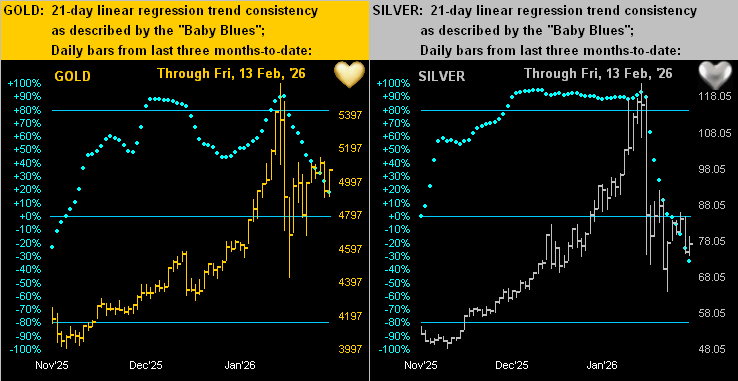
Given the StateSide holiday, ’tis a two-day session for the BEGOS Markets with settlement tomorrow (Tuesday). Presently, we’ve but one BEGOS component outside (below) its Neutral Zone for the session, that being Gold -0.9% (5017); overall volatility thus far expectedly is quite light. The Gold Update cites (as we’d anticipated a week prior) a compressing of the yellow metal’s trading range; Gold’s EDTR (see Market Ranges) for today is 248 points, but doubtless the actual range shan’t be that vast, (barring something geo-politically untoward); too, given the ongoing drop by Gold’s “Baby Blues” (see Market Trends), the 21-day regression trend may confirm having rotated to negative by week’s end. Nothing is due today for the Econ Baro with a heavy balance of 18 metrics scheduled through the week. And with two weeks to run in Q4 Earnings Season, we still expect reports from some 100 S&P 500 constituents: thus far, 71% have bettered their like Q4 of a year ago, which continues to be an above-average pace; however, the “live” P/E (futs-adj’d) at present 46.2x is a significant downside warning sign.
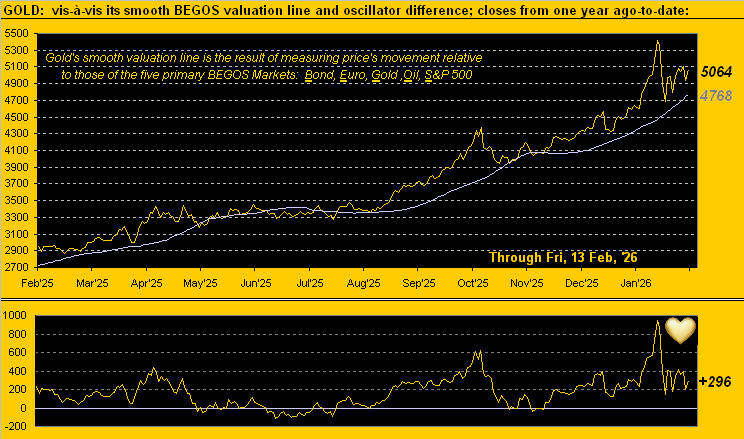
The Gold Update: No. 848 – (14 February 2026) – “Gold’s Range Compresses as the Uptrend Regresses”
And so, to the stack:
The Gold Stack (continuous contract pricing):
Gold’s All-Time Intra-Day High: 5586 (29 January 2026)
2026’s High: 5586 (29 January)
Gold’s All-Time Closing High: 5411 (28 January 2026)
10-Session directional range: up to 5140 (from 4428) = +712 points or +16.1%
Trading Resistance: notable by the Market Profile, 5084
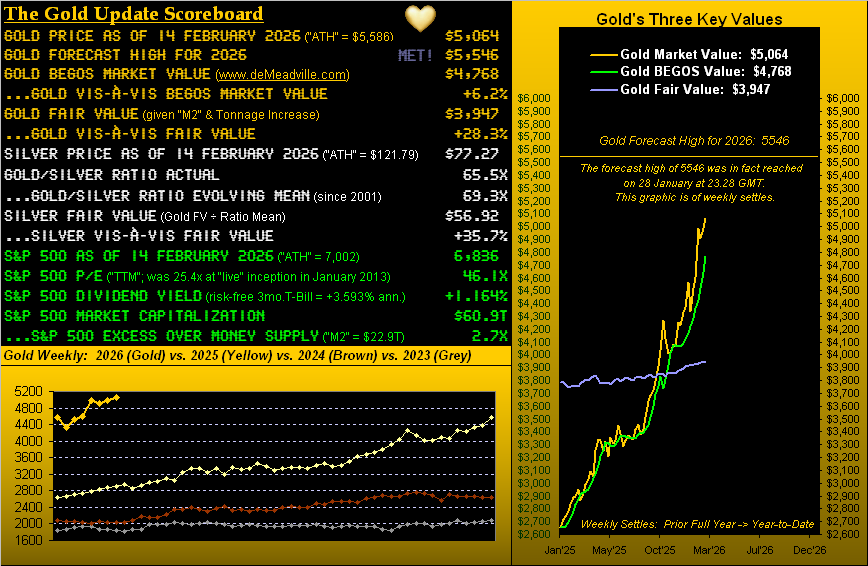
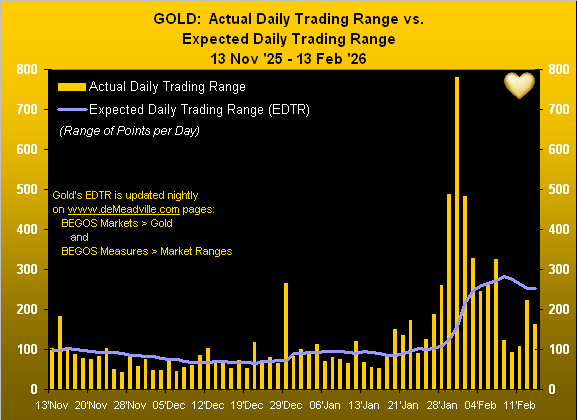
Gold Currently: 5064, (expected daily trading range [“EDTR”]: 248 points)
Trading Support: notable by the Market Profile, 5044 / 4948 / 4852 / 4707 / 4654
10-Session “volume-weighted” average price magnet: 4921
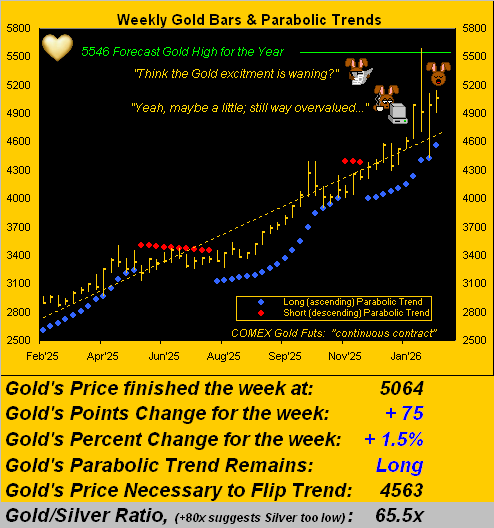
The Weekly Parabolic Price to flip Short: 4563
2026’s Low: 4319 (02 January)
Gold’s Fair Value per Dollar Debasement, (from our opening “Scoreboard”): 3947
The 300-Day Moving Average: 3549 and rising
The 2000’s Triple-Top: 2089 (07 Aug ’20); 2079 (08 Mar’22); 2085 (04 May ’23)
The Gateway to 2000: 1900+
The Final Frontier: 1800-1900
The Northern Front: 1800-1750
On Maneuvers: 1750-1579
The Floor: 1579-1466
Le Sous-sol: Sub-1466
The Support Shelf: 1454-1434
Base Camp: 1377
The 1360s Double-Top: 1369 in Apr ’18 preceded by 1362 in Sep ’17
Neverland: The Whiny 1290s
The Box: 1280-1240
To close, a most highly-valued reader of The Gold Update just enlightened us as to equity margins being on the up move. Without our doing the actual math, margin debt today purportedly exceeds the $1T level, last year alone having increased some 36%.
“Wow, mmb, that’s more than double what the S&P did last year…”
‘Tis so, Squire, the S&P 500’s net gain in 2025 being +16.4%. Is it any wonder that (again per the opening Scoreboard) today’s S&P market capitalization of $60.9T is 2.7x the liquid money supply? Sell your stock and get cash from your broker? Or just an I.O.U.?
But wait, there’s more: how are how those precious metals’ margin requirements working out for ya? Three years ago on Valentine’s Day in 2023, the price of Gold was 1864 and the COMEX margin required to trade one futures contract was $7,000. Today at 5064, Gold is +172% higher than ’twas then … but the margin today at $46,000 is an increase of +557%! And as for Silver (deep breath): she settled Valentine’s Day 2023 at 21.85 with required contract margin of $8,000. Now Silver at 77.27 is +254% higher … but her requisite margin per contract at $76,000 is a +850% increase! Nuthin’ like a li’l volatility to keep one on one’s liquidity toes, eh?
Still, we close with this happy news. For even as price compression may weigh, with trend regression in play, everyday with Gold is Valentine’s Day!

Cheers!
…m…
www.TheGoldUpdate.com
www.deMeadville.com
and now on “X”: @deMeadvillePro
13 February 2026 – 08:34 Central Euro Time
Presently we’ve the EuroCurrencies below their respective Neutral Zones for today, whilst above same are the precious metals; BEGOS Markets’ volatility remains light into this hour of the session. Gold, after having on Wednesday moved up through its Market Magnet, was unable to sustain upside furtherance, falling back down through same yesterday, as did both Oil and the Spoo; and all three elements of the Metals Triumvirate yesterday failed to hold their most volume-dominant support levels (see Market Profiles). Also, EDTRs (see Market Ranges) — whilst still vast — have begun to narrow a bit; more on the metals in tomorrow’s 848th consecutive Saturday edition of The Gold Update. And although we’re still a week away from the “Fed-favoured” PCE for December, today the Econ Baro receives the CPI for January. As for Q4 Earnings Season, with two weeks yet to run, some 100 S&P 500 constituents are still to report. Monday is a StateSide holiday for physical bourses.