The Gold Update: No. 888 – (21 November 2026, Our 17th Anniversary Edition) – “Gold & Silver Well-Undervalued; S&P Still Way-Overvalued”

The Gold Update by Mark Mead Baillie — 888th & 17th Anniversary Edition — Monte-Carlo — 21 November 2026 (published each Saturday) — www.deMeadville.com

“Gold & Silver Well-Undervalued; S&P Still Way-Overvalued“

‘Tis hardly the happiest anniversary given the state of the precious metals, but ’twas 17 years ago to this very day (Saturday, 21 November, 2009) that we penned the first edition of The Gold Update in the form of an e-mail to but one recipient … and you know who you are out there, JGS!  Now fast forward with the “eights are wild” as straightway we get into Edition No. 888.

And “oh goodness gracious” are Gold and Silver both so attractively undervalued!  It brings to mind such  time-honoured expressions as “Time to back up the truck!” and “I love it when I buy Gold and then the price goes down because it’s like having an insurance policy with declining premiums!”

“Well that’s all clever, mmb, but gold and silver are taking a heckova beating…”

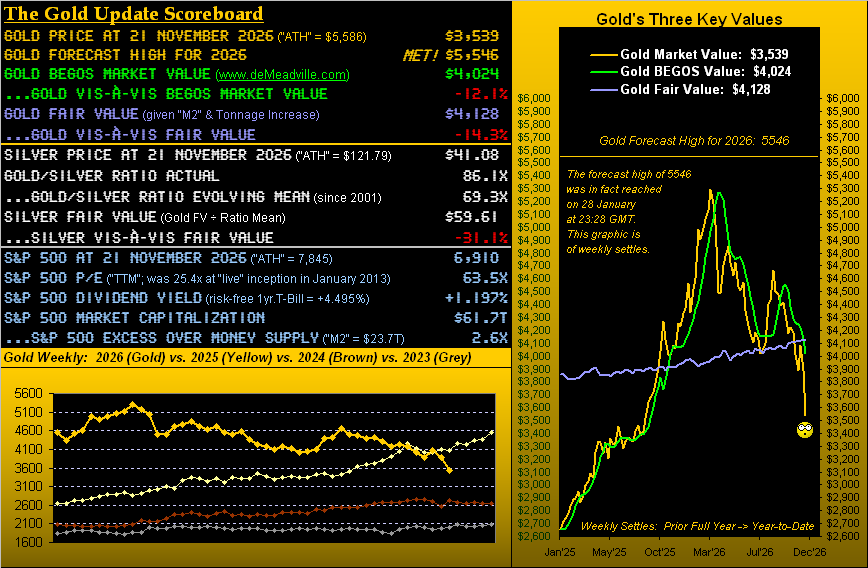
Comparatively, Squire, from their respective All-Time Highs (both of which printed back on 29 January), Gold then 5586 settled this past week yesterday (Friday) at 3539, a -37% decline from that top.  But poor ol’ Sister Silver — her week’s settle at 41.08 being down from her record 121.78 level — is a fallout of -66%.  That acknowledged, regular readers will recall week-in and week-out this past winter our cautioning over the precious metals’ excessively lofty valuations.  To now wit, our present perspective per the opening Gold Scoreboard:

  • Gold today at 3539 is -14.3% below its Fair Value of 4128;

  • Silver today at 41.08 is -31.3% below her Fair Value of 59.61.

“Got Value?”  Hardly does the S&P 500.  To be sure, its high-to-low correction thus far is -12.3%.  For those of you scoring at home, ’tis — on a mutually discrete basis — the seventh such correction, or worse, thus far this century.  But here’s the crazy bit:  even now at 6910, the S&P is actually more overvalued today than ’twas on 28 August at 7712.  How can that be?  Lack of earnings, as in the wrap you’ll see.

“Wow, that is nutz, mmb!  But for gold, is this a repeat of 2011-2015?”

Squire, of course, is referring to Gold’s great -46% four-year demise from its then All-Time High of 1923 on 06 September 2011 through the 1045 low of 03 December 2015.  And “NO“, dear Squire, ’tis not a repeat.  Back then, you’ll recall the world was all “a-ga-ga” (technical term) over the go-go stock market, the S&P soaring 80% for that stint, Gold in turn being once and forevermore discarded as a yieldless, antiquated relic from prior millennia.

But five years hence came COVID combined with the withering of purchasing power via Dollar debasement, the wokey word “awareness” thus returning to Gold, indeed overly so as we witnessed this past winter.  Yes, Gold and Silver have taking a hit; but they remain a vastly larger part of the investment conversation today than they did from 2011 through 2015.  And reversion in this case back up to their respective valuation means is inevitably in the cards.

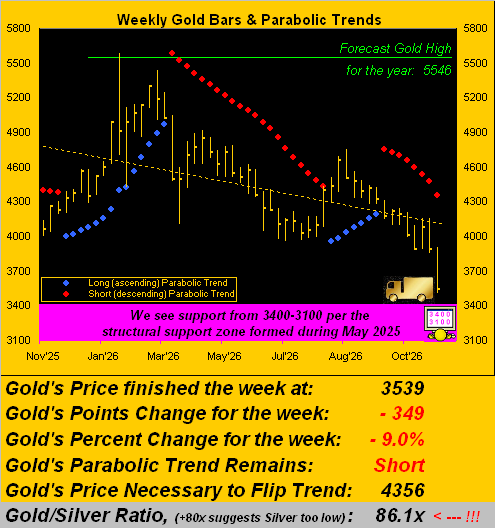
All that said, as herein graphically depicted a week ago (and then again emphasized in last Wednesday’s Prescient Commentary), upon Gold’s being unable to regain “The Floor” of 4000, there was “nothing but air” should 3800 fail, all the way down to at the least the 3400s, which nearly is what has happened, price on Friday reaching 3503 as the week’s low.  And thus to Gold’s weekly bars and parabolic trends we go with the 3400-3100 support zone embellished in rose:

‘Course, aiding and abetting the selling of Gold is nervousness of an (albeit improbable) Federal Open Market Committee vote to hike its Bank’s funds rate by +50bp rather than +25bp come the 09 December Policy Statement:  certainly Fed Governor and FOMC voting member Christopher “Up the Wall” Waller is in that +50bp camp, (as too we herein opined following the Committee’s failure to raise the rate by +25bp back on 28 October).

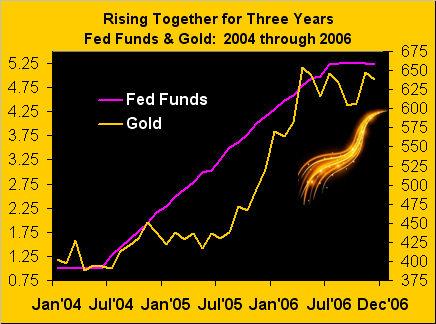
In fact, next week brings the completion of the October inflation puzzle with the release on Wednesday of the “Fed-favoured” Personal Consumption Expenditures Index, the key “core” rate for which is expected to maintain a +0.3% pace (i.e. +3.6% annualized), nearly double the Fed’s +2.0% desire.  And — although oft immaterially — Fed rate hikes may actually decrease the money supply (“M2” basis) as banks pay back debt through the Fed window, which in turn can serve to reduce Gold’s Fair Value.  But then again, we reprise this graphic reminder of Gold and the Fed Funds rate from 2004 through 2006:  what’s not to like?

Either way, with but 27 trading days remaining in 2026 and Gold now -18.3% from 2025’s settle at 4332, the yellow metal may well be en route to recording a down year, after having on 29 January reached 5586 via our almost perfectly projected high of 5546 … but our forecast low was only 4136, which quite obviously has failed.

Far more overcooked on the downside is the white metal, now -42.1% for 2026.  In turn, the Gold/Silver ratio has catapulted from just 46.1x on 27 January to now the year’s high (thus far) at 86.1x.  The interpretation?  Silver relative to Gold is a STEAL!  Reverting merely to the ratio’s evolving mean of 69.3x puts Silver +20% higher from here to 51.10.  Indeed should the precious metals record a positive track in 2027, Silver may be next year’s stellar star.  To reprise ad nauseam:  “Do NOT forget the Silver!!”

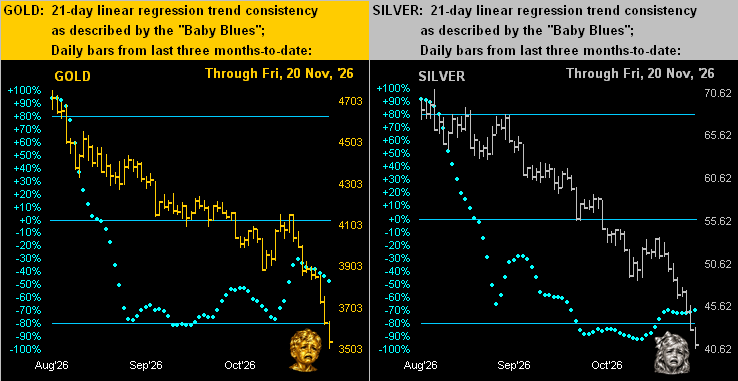
That harkened, ’tis a rather sad segue to our two-panel display for Gold’s daily bars from three-months ago-to-date on the left and those for Silver on the right.  The baby blue dots of day-to-day trend consistency are erratic at best, and have not led to higher prices (otherwise overwhelmingly the rule rather than this exception) upon passing back up through their respective -80% axes.  However, not to worry:  our two bawling metals shall get over it once the investing world wakes up to their very attractive undervaluation as aforementioned:

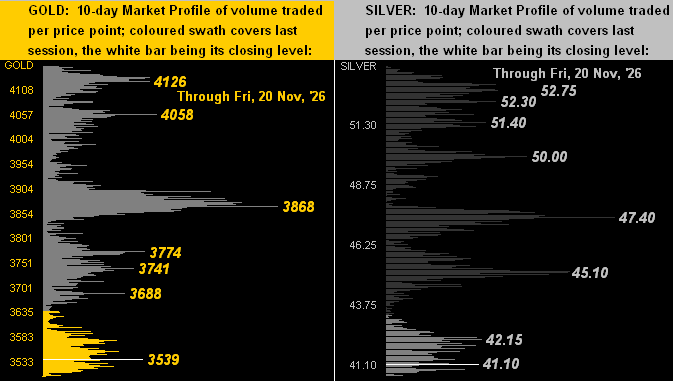
Too, as we go to the 10-day Market Profiles for Gold (below left) and for Silver (below right), they’re akin to those of a week ago, the difference being the pricing scales having both significantly shifted lower.  Basement dwellers they are, our precious metals!

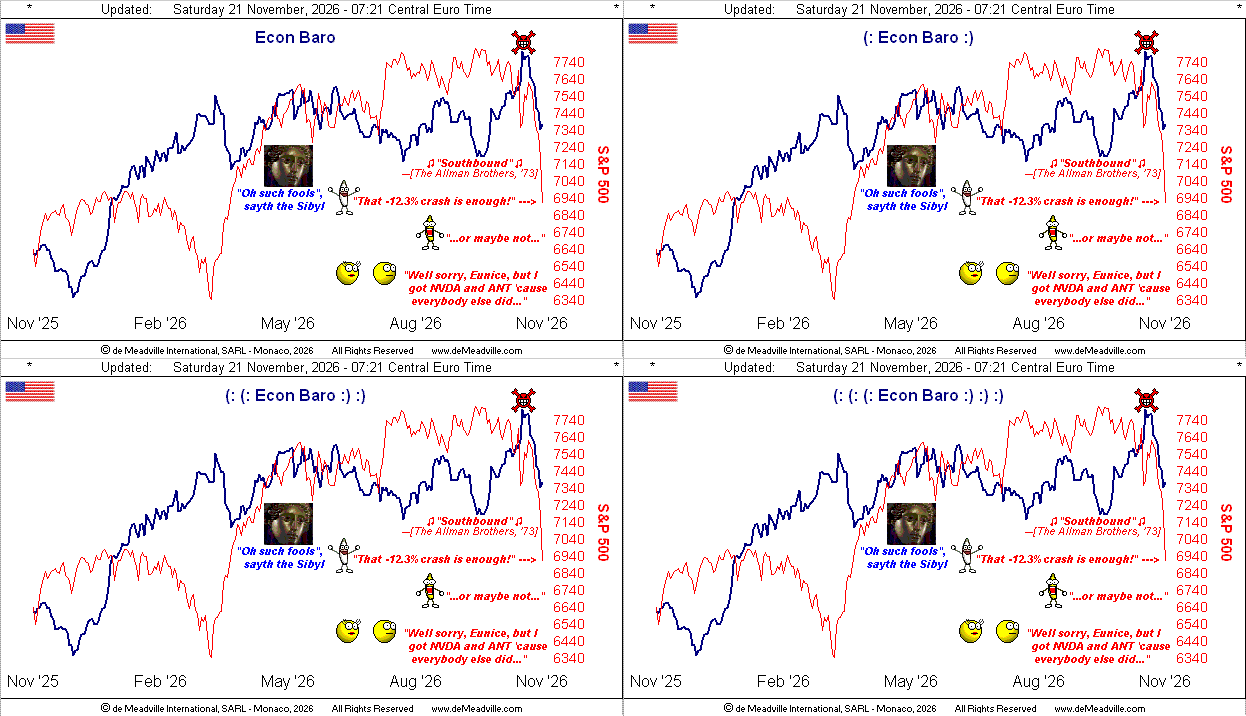
Now to the Economic Barometer which, too, has entered a rather sad state.  Of the past week’s 16 incoming metrics, 13 were worse period-over-period, notably including shrinkage in both October’s Leading (aka “lagging”) Economic Indicators and Industrial Production.  Also, the pace of Pending Home Sales again retreated.  And as stated, the Fed is poised for likely only a +25bp rate hike.  Do we dare therefore again mention the “s” word:  stagflation?  Next week’s mix of nine metrics would “by consensus” appear to be net neutral … but enough so as to curtail the correcting S&P?  We shall see by Thursday’s StateSide day of the turkeys…  Meanwhile, always heed what the infallible Sibyl sees:

So per our title and analysis, just as Gold and Silver are now well-undervalued, the S&P 500 — even in having so far corrected -12.5% — remains way-overvalued.

The mighty Index stands today at 6910, a level first achieved on 28 October 2025 (269 trading days ago).  From there, it took 235 trading days to reach this past 06 October’s record high of 7844 … (deep breath) … only to now have given back the entirety of that gain in just the past 33 trading days.  Effectively, that’s a drop at seven times the pace of the overall advance.  (Welcome to real markets).

Moreover, we just made the above quip that the S&P today at 6910 is more overvalued than when it was higher on 28 August at 7712.  Impossible, right?  Wrong.  (We purposely selected 28 August as it followed the earnings release of CrowdStrike [CRWD] such as to maintain calculation continuity for the price/earnings ratio of the S&P).

Here you go:  the P/E of the S&P at close (7712) on 28 August was 61.5x (or ex-CRWD 38.8x); now, including yesterday’s S&P -3.7% move to 6910, the P/E is actually up to 63.5x (or ex-CRWD 40.0x).  Thus from 28 August, the S&P is now -10% lower … but its P/E is +3% higher.  What that means for you WestPalmBeachers down there is that by proper earnings valuation, the S&P is even more expensive today than ’twas prior to this correction, (or “crash” as the more ignorant FinMedia outlets are characterizing it).

Further, we acknowledge with Q3 Earnings Season having concluded yesterday, there were year-over-year quarterly improvements for 79% of the S&P 500’s constituents, handily beating the 10-year average (ex-COVID) for improvement of 69%.  That’s the good news.  But at the risk of being repetitive, the bad news remains the overall paltry level of earnings generation, which is why the P/E is so unsustainably high at 63.5x (or ex-CRWD 40.0x).  Recall Jerome B. Cohen’s 15x-18x deemed as “average” for a bull market:  we’re double to triple that today, with a one-year U.S. T-Bill market yield four times that of the S&P 500; (but that’s boring).

As to how low the S&P may go:  -10% corrections have a hankering of bringing buyers back into the market.  And as ’tis that “festive time of year” oft featuring the “Santa Claus Rally”, perhaps stocks now get a grip.  But as is our wont, we did a little downside Fibonacci math based on the S&P’s structural correction from last February/March:  therein, “Golden Ratio” retracements would be to both 6740 and 6579, that overall structure becoming bust below 6317 (at which from the 7744 record high would then be an all-in correction of some -18% vs. -12% so far).  Perhaps not immediately … but then comes January.

Thus although in correction, ’tis still the way-overvalued S&P…
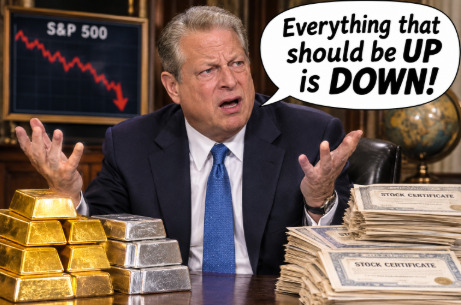
… as opposed to well-undervalued Gold and Silver!

–> Logistic Note for Next Week:  weather permitting, we are to be in motion.  Thus No. 889 is planned to be very brief, even as ‘twould normally be a graphics-rich month-end edition.  Yet in due course, we’ll get ’em all in!  In the meantime to you StateSiders over there, Happy Thanksgiving!

Cheers!

…m…