The Gold Update: No. 883 – (17 October 2026) – “Gold Basing Against Its Short Trend’s Tracing”

The Gold Update by Mark Mead Baillie — 883rd Edition — Monte-Carlo — 17 October 2026 (published each Saturday) — www.deMeadville.com

“Gold Basing Against Its Short Trend’s Tracing“

In gliding toward the Federal Open Market Committee’s next vote come 28 October by which ’twill raise its Bank’s funds rate from the current 3.75%-4.00% range to that of 4.00%-4.25%, we’ve nonetheless a Gold technical positive — as teased in yesterday’s Prescient Commentary — even as the weekly parabolic Short trend remains in force.  ‘Tis the Market Rhythm of Gold’s Moneyflow.

“And that’s the standard ‘canned’ Moneyflow, right mmb?”

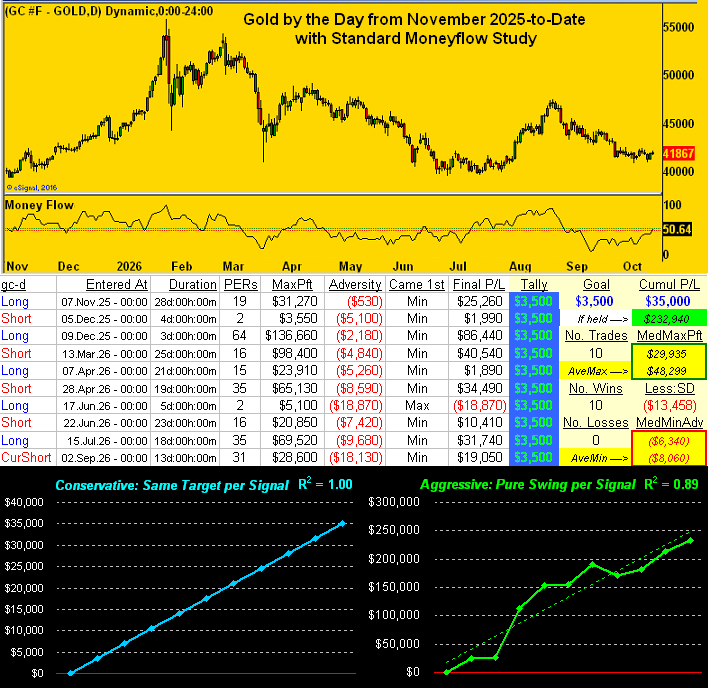
So ’tis, Squire, a feature provided across most data platforms of substance.  And for this occasion, we take you for a rare glimpse deep within the deMeadville analytics that ultimately drive our Market Rhythms page.  This next graphic’s upper panel is Gold by the day from November 2025-to-date with the standard Moneyflow study; the center panel depicts the stats per signal; and the lower split panel both conservative and aggressive approaches to using the signal:

“And what does it all mean, mmb?”

That hindsight is a beautiful thing, Squire.  The Moneyflow has triggered 10 swing signals since November 2025, naturally alternating back-and-forth between Long and Short, (notwithstanding our tenet that “Shorting Gold is a bad idea”).  A Long signal is confirmed upon price passing up through and settling above the Moneyflow’s thin green line, else a Short signal if passing and settling beneath the thin red line.

But to the point:  were one to have determined in trading a single COMEX Gold futures contract ($100/point) to target 35 points (i.e. $3,500/trade) of price follow-through per signal, such goal was achieved for all ten following cases as cumulated via the conservative blue line in the above graphic’s lower left panel.  However, ’tis not so simple per this two-bullet cautionary note:

  • The Math:  We’ve referred in the past to the great French polymath Pierre-Simon, Marquis de Laplace, whose probability formula determined that if a like result is obtained ten consecutive times (in this case 35 follow-through Gold points per signal), the odds of an 11th like consecutive occurrence is 91.67%.
     
  • The Reality:  Specific to markets, the odds of an 11th consecutive like occurrence is actually 50.00%.  Do try not to get carried away.

But wait, there’s more (a lot more):  see the aggressive cumulative green line in the above graphic’s lower right panel?  That’s the pure swing result across the 10 signals without targeted follow-through.  It totals $232,940 (ex-slippage and commissions) on a base margin requirement of $21,000, (i.e. an 11-month return in excess of 1,000%).  The reason ’tis working so well is the vast expanse of Gold’s bi-directional trading range through these many months.  However, it shan’t continue in perpetuity because it never so does.  A word to the wise therefore is sufficient, this again merely being an exercise given hindsight:  foresight is up to you.

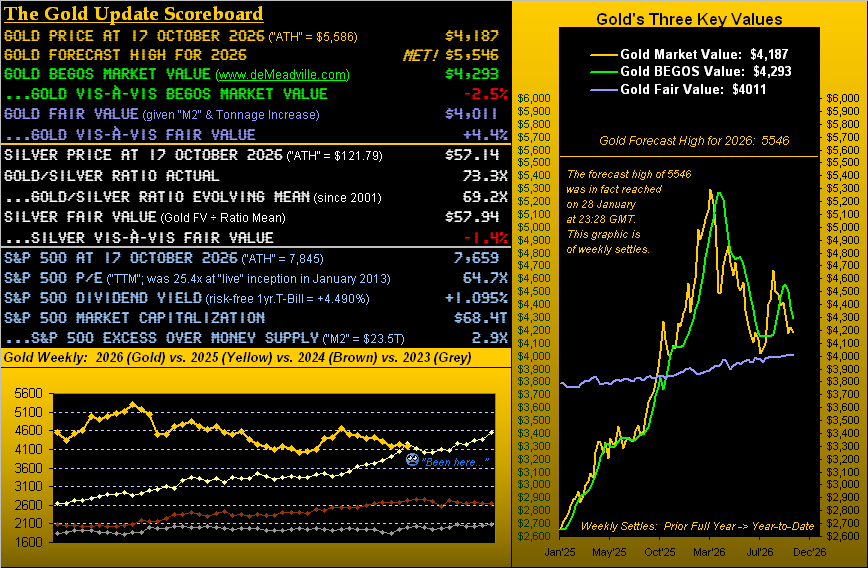
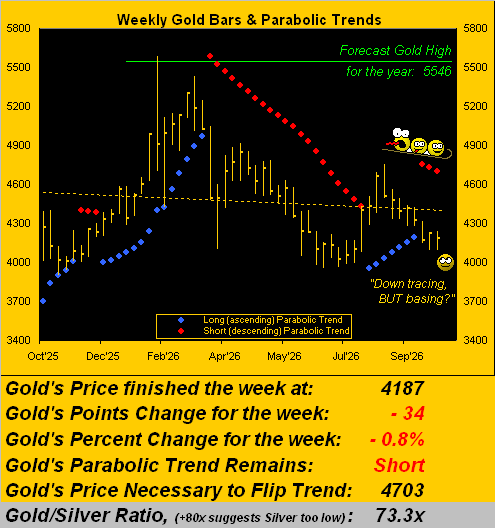
Now to our wise view of Gold’s weekly bars and parabolic trends from one year ago-to-date.  Therein we see a third week of red-dotted parabolic Short trend, although our sense is Gold’s downside is limited to “The Floor” at 4000, (albeit as the sole recipient [JGS] of the first edition of The Gold Update would opine:  “There’s always the overshoot”).  Either way, as herein cited a week ago, we are comfortable with today’s Gold price, it having settled yesterday (Friday) at 4187 as sandwiched between Fair Value of 4011 and our BEGOS Market Value of 4293, (the latter determined by price’s movement relative to those of the five primary BEGOS Markets being the Bond, Euro, Gold, Oil and S&P 500).  That said, the tilt of the whole chart has rotated to negative per the dashed regression trendline.  But given the inevitable Federal Reserve “mass creation” of more faux dough, broadly the buyside clearly is the way to go.  And as our title states, price near-term appears more to be basing than downside tracing:

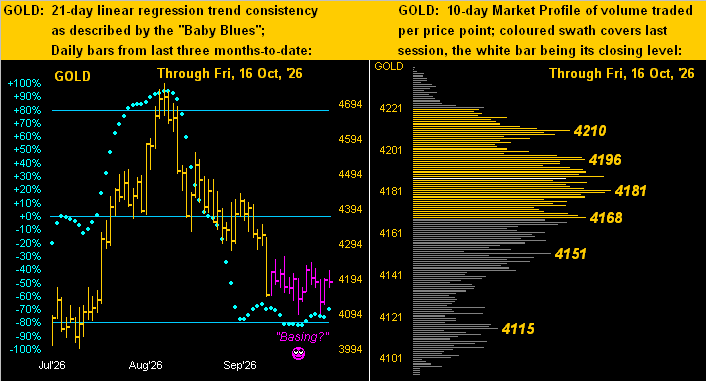
Indeed specific to said basing, here next we’ve our two-panel graphic of Gold’s daily bars from three months ago-to-date on the left and 10-day Market Profile on the right.  We’ve coloured the recent trading days in violet to emphasize what appears to be price basing rather than declining.  Moreover, the baby blue dots of regression trend consistency are continuing their attempt to push up after having been beneath the key -80% axis (as herein depictively detailed a week ago).  As to the Profile, price is at present within the big belly of volume-dominant trading which essentially extends from 4168 up to 4210:

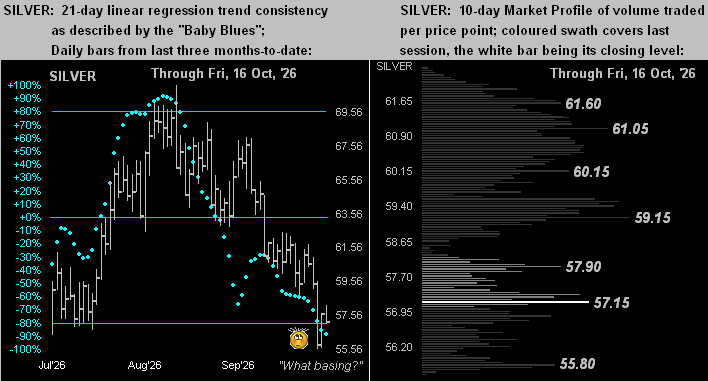
Having aforementioned that “we are comfortable with today’s Gold price”, we see Silver through this past week as perhaps a bit underpriced, her settling Friday at 57.14.  Per the opening Scoreboard, the Gold/Silver ratio has ratcheted up to 73.3x, on Wednesday reaching 74.0x, the highest level since 04 December a year ago.  And whilst today’s price of 57.14 is not that far from Fair Value of 57.94, hardly has Silver been basing in concert with Gold, (which for you WestPalmBeachers down there is why the ratio is rising).  So given Sweet Sister Silver’s pricing relative to Gold, the white metal’s next upside progression may be even more bold.  As to her like two-panel graphic, at left Silver’s “Baby Blues” are not enthused, even as at right she basically settled on a volume-dominant handle per the white bar.  “C’mon Sister Silver!”

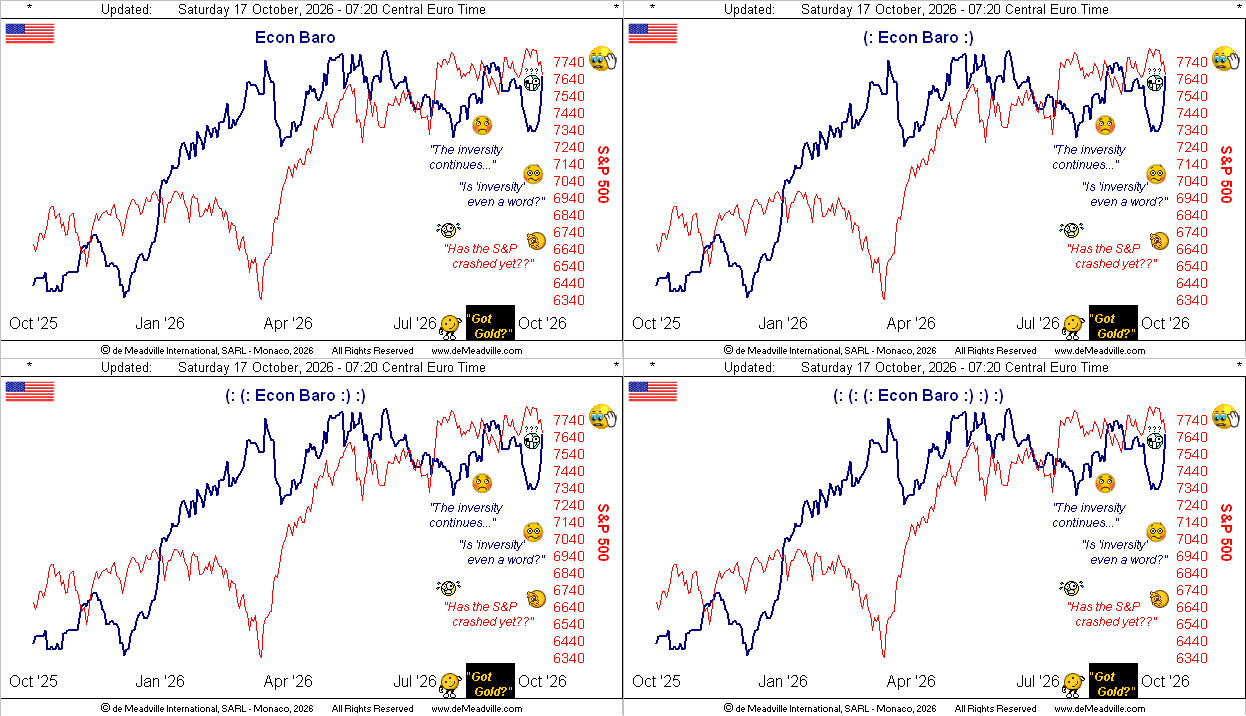
Be the precious metals basing within their broader negative tracing, the Economic Barometer is in (dare we coin the word) “inversity” to the S&P 500 as starkly next shown.  ‘Twas a fine week for the Econ Baro as 11 of the 16 incoming metrics bettered themselves period-over-period.  Notably improving were both Industrial Production and Capacity Utilization for September:  they bettered consensus as well as the August paces, which in turn were revised higher.  “America is at work!”

“Well, it’s also back to work from summer, mmb…”

We’ll grant you that one, Squire.  Still, the month’s Existing Home Sales expanded, plus the New York State Empire Index for October leapt beyond any and all expectations from September’s 7.6 to now 25.5.  ‘Course, the S&P continues to wriggle through the seasonal worries typical of October wherein  many-a-mutual fund ends its fiscal year, the extreme overvaluation of the Index itself notwithstanding.

Oh to be sure, early as ’tis, Q3 Earnings Season is off to an excellent start:  of the 29 S&P 500 constituents thus far having reported, 25 (86%) have improved their bottom lines from Q3 in 2025.  The average year-over-year earnings growth (for those having reported) is +15.6% … and therein lies the inevitable problem:  earnings really need be doubling and then some to justify the level of the S&P itself (7659); for even ex-CRWD, the “live” P/E of the S&P is at this instant 44.5x, triple that taught as “acceptable” in portfolio theory.  How long can that last as rates and yields rise?  Here’s the Baro with the S&P in red:

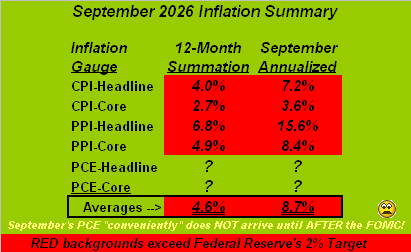
“Got Gold?” indeed.  With its Moneyflow crossing to positive, as stated we sense price is basing even within the parabolic Short trend’s tracing.  Gold’s expected weekly trading range is now 198 points, which (for those of you scoring at home) is within one week’s reach of testing “The Floor” at 4000 should price run down from here.  Moreover, conventional wisdom says higher yields equal lower Gold, which we’ve herein disproven over these many years, (notably citing from 2004 though 2006).  And as stated at the outset, the FOMC shall raise the funds rate on 28 October.  They’ve no choice but to so do as we go to our partially-completed table of the September Inflation Summary.  Note that the “Fed-favoured” Personal Consumption Expenditures data shan’t be reported until the day after (29 October) the FOMC’s Policy Statement (28 October).  So this is what they’ve got, the “Averages” wildly beyond any 2% inflation target:
Such as that all stacks up for the Fed, here we wrap with The Gold Stack:

The Gold Stack (continuous contract pricing):
Gold’s All-Time Intra-Day High:  5586 (29 January 2026)
2026’s High:  5586 (29 January)
Gold’s All-Time Closing High:  5411 (28 January 2026)
The Weekly Parabolic Price to flip Long:  4703
The 300-Day Moving Average:  4343 and rising
Gold’s BEGOS Market Value (from our opening “Scoreboard”):  4293
10-Session directional range:  up to 4241 (from 4093) = +148 points or +3.6%
Trading Resistance:  nearby Market Profile notables:  4196 / 4210
Gold Currently:  4187, (expected daily trading range [“EDTR”]:  75 points)
Trading Support:  nearby Market Profile notables:  4181 / 4168 / 4151 / 4115
10-Session “volume-weighted” average price magnet:  4172
Gold’s Fair Value per Dollar Debasement, (from our opening “Scoreboard”):  4011
2026’s Low:  3955 (30 June)
The 2000’s Triple-Top:  2089 (07 Aug ’20); 2079 (08 Mar’22); 2085 (04 May ’23)
The Gateway to 2000:  1900+
The Final Frontier:  1800-1900
The Northern Front:  1800-1750
On Maneuvers:  1750-1579
The Floor:  1579-1466
Le Sous-sol:  Sub-1466
The Support Shelf:  1454-1434
Base Camp:  1377
The 1360s Double-Top:  1369 in Apr ’18 preceded by 1362 in Sep ’17
Neverland:  The Whiny 1290s
The Box:  1280-1240 

And mind that Gold Moneyflow!

Cheers!

…m…