The Gold Update: No. 877 – (05 September 2026) – “Gold’s Recent Rally is Weakening … But an Up Week Can Right It”

The Gold Update by Mark Mead Baillie — 877th Edition — Monte-Carlo — 05 September 2026 (published each Saturday) — www.deMeadville.com

Gold’s Recent Rally is Weakening … But an Up Week Can Right It

We open with the yucky, wokey noun “awareness”, as ’tis increasing of late with respect to acknowledging the money to cover that which is owed isn’t there … a very Gold positive.

To wit, let’s start straightaway with this from the “A.I. On Your Side Dept.”  Ready?

Our A.I. Query –> “Concern: The U.S. federal debt is $40T; the S&P 500 market capitalization is $68T; but the liquid money supply to support it (the total being $108T) is only $23T. What is the end-game?”

The A.I. Response –> “Your math highlights a classic economic puzzle … creating an apparent shortfall. However, … it is the natural state of a highly developed financial system.  The “end-game” is … a complex balancing act managed through monetary velocity, debt rollovers, and asset valuation dynamics.

Our Logical Reaction –>  “GOT GOLD?!?!?!

“That is really scary, mmb…”

Scary, indeed, Squire.  ‘Tis the greatest game of “Chicken” in the history of the world.  Who shall first blink?  “Uhhh… can you pay us in something other than Dollars?”  Headline“World Ends, Dow +2”.  Just something upon which to chew amongst you StateSiders at your long Labor Day Weekend BBQs.

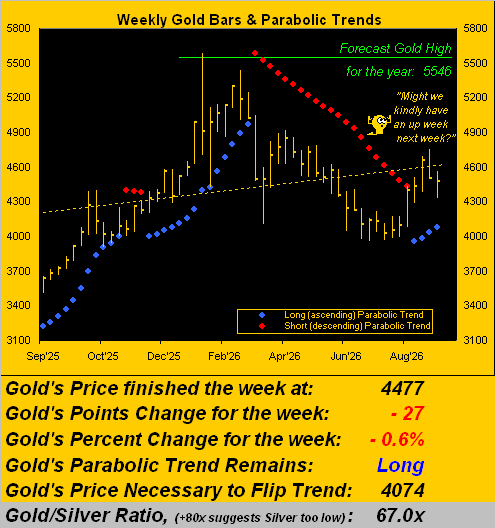
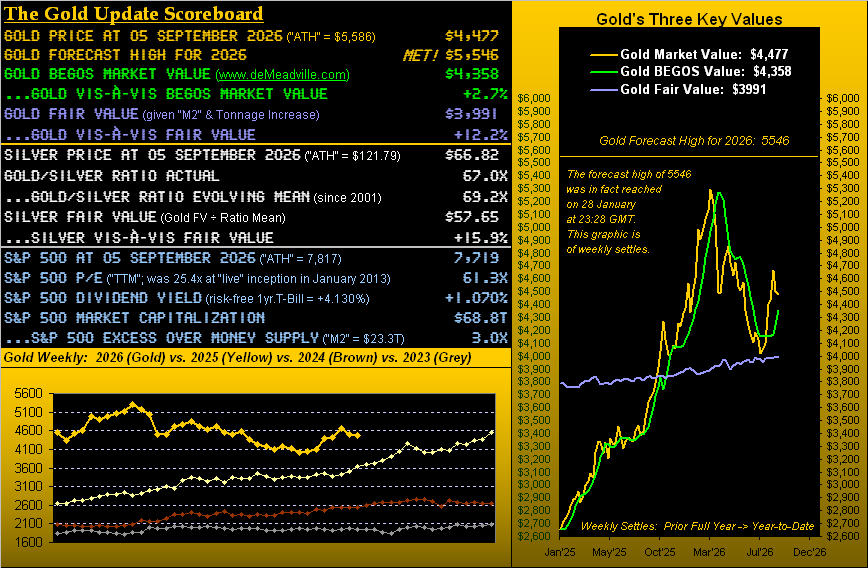
As to the week just past, not much was cookin’ on the grill for Gold.  ‘Twas its second consecutive down week, wherein the support structure we cited a week ago (4509-4366) was overshot, price having traded Wednesday to as low as 4329, before rebounding to settle yesterday (Friday) at 4477, although still -0.6% (-27 points) net for the week.

“But what if price goes down again for next week, mmb?”

Superb question, Squire.  Gold decade-to-date is now in its 14th weekly parabolic Long trend.  With but one exception (from November 2021 into March 2022), a third consecutive down week likely portends the end to the trend.  Rather, we’d like to consider these past two down weeks as merely a pause in the upside action.  But in facing the fundamentals, the war remains a Gold negative upon the Dollar getting 1) a bid to purchase Oil and 2) a bid for better (i.e. higher) yield.  ‘Course, ’tis not yet next week.  However, either way, here we’ve Gold weekly bars from a year ago-to-date, the rightmost blue-dotted parabolic Long trend having completed a fourth week.  “Up, please?”
Even were Gold to put in a third consecutive down week, it reasonably would not be enough to (at least initially) flip the above trend from Long to Short:  the distance from here (4477) to the flip level (4074) is -403 points, whereas the expected weekly trading range is now “only” 237 points, (the daily being 115 points).  Regardless, as Quarrel the Cayman Islander said to James Bond:  “It don’t do for a man to tempt Providence too often.” –[Dr. No, United Artists, ’62].  On verra, ya…

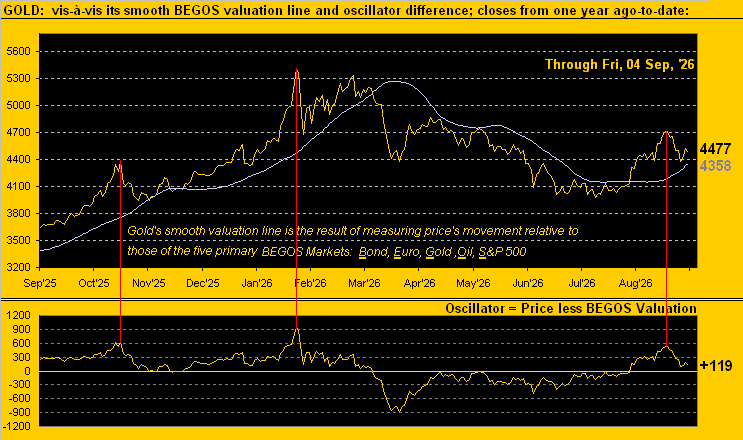
Specific to Gold vis-à-vis its BEGOS Markets’ smooth valuation line, we’ve updated the year-over-year graphic as presented two missives ago with the three oscillator red peak lines.  As you’ll recall, we were becoming a bit wary over price getting too far afield from its BEGOS Market Value.  Indeed, since the last swing peak at 4755 on 25 August (valuation then 4175, i.e. +580 points “high”), price through this past week’s low marked a -9.0% drop (-426 points), albeit by the Oscillator, Gold today (4477) still is +119 points above this valuation metric (4358) as we next see:

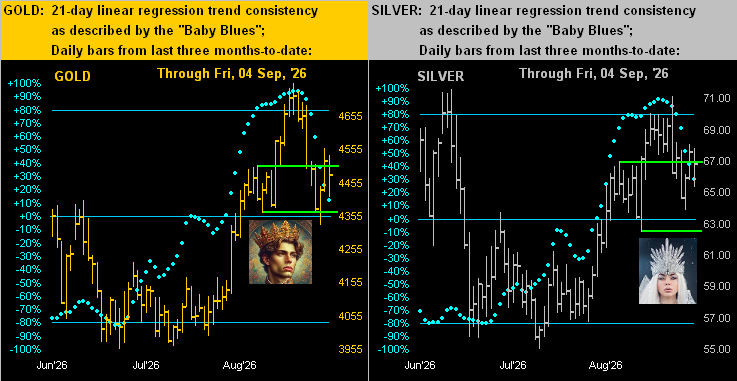
Further, should Gold trade down through the smooth valuation line, the proven rule (rather than the exception) is to anticipate still lower prices near-term.  And in turning to our two-panel daily graphic across the past three months of Gold on the left and of Silver on the right, we see for both metals the baby blue dots of regression trend consistency having accelerated their respective falls from a week ago:  should the “Baby Blues” eclipse below the 0% axes, the 21-day trends shall have rotated from positive to negative.  Note therein the horizontal green lines:  they describe the structural support zones, which as mentioned Gold briefly violated mid-week, but within which Silver remains (66.98-62.45).  Nonetheless as we on occasion quip:  “Follow the Blues instead of the news, else lose yer shoes.”  But as well discern that “Shorting Gold is a bad idea.”  Here’s the graphic:

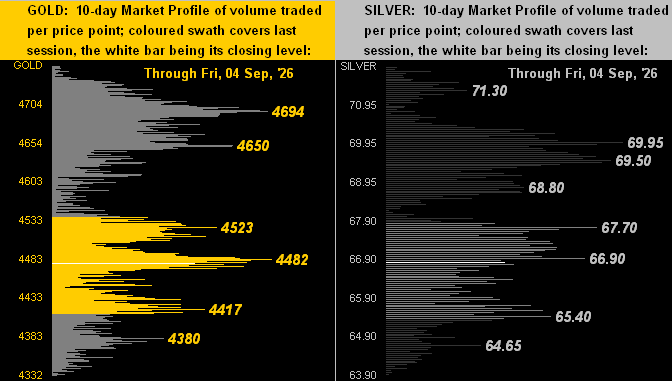
Next, the 10-day market Profiles for both the yellow (at left) and white (at right) metals find price just below their respective midpoints.  For Gold, the 4650-4694 span appears resistive, whilst same for Sister Silver is 68.80-69.95.  Other volume-dominant prices are as labeled:

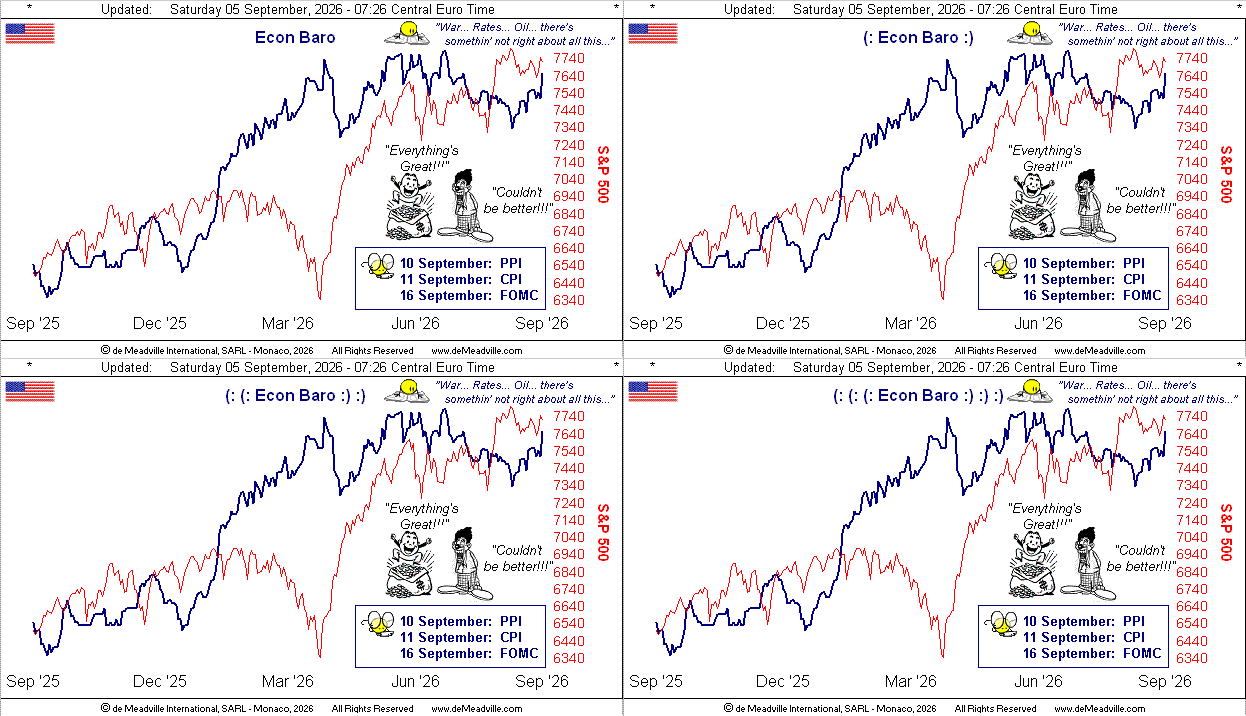
As for the Economic Barometer, ’twas buoyed this past week by Labor’s take on August employment, the 162k net Payrolls increase four times that expected, with July’s number also being revised from shrinkage to growth.  ‘Course, by ADP’s measuring, August employment slowed from July as well as missed consensus.  So in which reporting entity do you believe?  The ADP number is of course geared toward private jobs growth rather than that for public, although Labor’s own private measure (unlike ADP’s) was also very positive.  Also boosting the Baro were Factory Orders, having swung from June shrinkage (-0.2%) to July growth (+0.9%).

As for the Federal Reserve, the countdown to the Open Market Committee’s next Policy Statement is just seven trading days (16 September), within which we’ll next week get both wholesale and retail inflation data for August.  Shall such measures remain benign for a third straight month such as to keep the Fed at bay?  Let’s see what the numbers say, even as the Baro is making some headway, with our old “marked-to-market millionaire” buddies still at play as “crash season” prey, (should it turn out that way):

To close, as herein put forth a week ago, we’re not predicting an imminent crash for the S&P 500, albeit ’tis “crash season” and the “earningless n’ yieldless” Index is wildly overdue for one.  In updating our numbers from a year ago, the first 25 Septembers thus far this century — when combined — amount to a -30.9% decline for the S&P, even as October tends hold the dubious distinctions of Black Tuesday (’29), Black Monday (’87) and (within the FinCrisis) Black Wednesday (’08).  Then, too,  there’s ol’ Black Swanee.  When might he come floating by?

Make sure you’ve Gold when the rest go bye-bye!

Cheers!

…m…