The Gold Update: No. 828 – (27 September 2025) – “Gold Furthers Record Ticks; Silver Snags 46!”

The Gold Update by Mark Mead Baillie — 828th Edition — Monte-Carlo — 27 September 2025 (published each Saturday) — www.deMeadville.com

Gold Furthers Record Ticks; Silver Snags 46!

With so much to expend into month n’ quarter end, on to that we’ve prodigiously penned!

And straight out of the chute we start with our year-to-date BEGOS Markets Standings, the sweetest component of them all again topping the stack:  Sister Silver!  You tell ’em, Jackie:

No, thy eyes do not thee deceive:  Silver year-to-date is +58.3% in settling out the week yesterday (Friday) at 46.37, yet remains short of her all-time high.  For as noted in last week’s piece:  “Silver’s all-time intraday high is 49.82 from 25 April 2011.”  Still, the Metals Triumvirate continues to dominate the Standings’ Top Three podium positions.

So as we turn to Gold’s weekly bars — price settling the week at 3790 — note at the foot of the following graphic the Gold/Silver ratio now down to 81.7x — which by that ratio’s century-to-date average of 69.3x means that relative to the yellow metal, the white metal still remains cheap!

‘Course, let us duly acknowledge that Gold is significantly upside-stretched at present, indeed scoring another All-Time High this past Tuesday at 3825 on approach to the opening Scoreboard’s Dollar debasement value of 3865.  To be sure by the website’s BEGOS valuation for Gold, price per the next graphic shows as +243 points “high”, and inevitably shall revert to the smooth grey line, even as it also is rising:

Thus with Silver in mind, upon Gold’s decline, the white metal — again still cheap relative to the yellow metal — shall as well unwind.

So yer thinkin’ prices are gonna drop, eh mmb?”

As Squire well knows, Gold and Silver — indeed all of the BEGOS markets — are very liquid.  As such they all from period-to-period engage in one of three possible trends:  up, sideways, or down.  Too, with the FinMedia having of late actually giving notice to Gold, precious metals reports these days are richly ripe with hype.  Moreover, recall what happened the last time Gold graphically caught up to its Dollar debasement value (again see the the righthand panel of the opening Scoreboard):  price went from its then All-Time High of 1923 (06 September 2011) down to 1045 (03 December 2015), a better than four-year decline of -47.7%.

Are we expecting same again?  Hardly, albeit “Never Say Never Again” –[Taliafilm, Warner/Columbia-EMI, ’83].  But Gold’s reverting to its BEGOS valuation in the 3500s wouldn’t be a wit untoward, and (not to drag you too deeply into the technical weeds) there was structural support recorded this past April/May that lasted through August in the 3586 to 3208 range, the midpoint of which is 3397 … and structural midpoints are oft keenly eyed by those on the dip-buying side … just in case you’re scoring at home.

Speaking of scoring, the precious metals equites have been putting on a clinic!  For many-a-year we hear ’tis axiomatic that the equities outpace the yellow metal itself.  ‘Course we’ve seen as well that one both lives … and dies … by the equities’ leverage.  Yet from a year ago-to-date, the equities are livin’ large versus the Gold price.  Here are the percentage tracks from least-to-most for the whole gang featuring Gold itself +41%, Newmont (NEM) +53%, Franco-Nevada (FNV) +70%, Pan American Silver (PAAS) +73%, the VanEck Vectors Gold Miners exchange-traded fund (GDX) +80%, the Global X Silver Miners exchange-traded fund (SIL) +90%, and Agnico Eagle Mines (AEM) +95%.  Behold the beauty:

Comparatively, the ludicrously-overvalued, earnings-lacking Casino 500 is +16% across the same stint.  Oh yes, Gold is a bit over-extended near-term:  but at least ’tis properly priced in the area of its Dollar debasement value, whereas the S&P is priced at a whacky 48.4x earnings.  (Note:  “AI” [“Assembled Inaccuracy”] puts it at 25.9x; however, when we’ve fed “AI” the precise price/earnings formula — which we’ve herein on occasion posted — ’tis unable to perform the math.  Is your financial manager using “AI“?  Oh well).

Doing well of late is the Economic Barometer, sufficiently so that it brings into question the Federal Open Market Committee voting come 29 October to again reduce The Bank’s Funds rate.  And when the final revision to Q2 Gross Domestic Product was released this past Thursday, it put by that reasoning quite a sudden scare into the S&P, the futures sporting their second-worst 60-minute drop to that point of the week.  For you WestPalmBeachers down there, quarterly GDP is thrice reported, the final revision rarely of substantive change.  But this time, for Q2 annualized, it leapt from the second estimate of +3.3% to +3.8%, the biggest final upward revision since that for Q1 away back in 2015!  So suddenly, life is good!  Here’s the Baro, for which seven of the past week’s 11 incoming metrics improved over the prior period:

Along with the GDP surprise came the most anticipated data of the week, that comprising the Fed’s preferred gauge of inflation as Personal Consumption Expenditures for August.  The “headline” number cooled from July’s +0.3% to +0.2% … but the more scruntinized “core” number heated from +0.2% to +0.3%.  All-in-all per our August 2025 Inflation Summary table, the 12-month summation’s average of +2.8% is still above the Fed’s desired +2.0% target, whilst that for August alone is spot on at +2.0%.  But the Fed having just cut can make those paces turn up:

Thus from “The Rising Tide of Inflation Lifts All Boats Dept.” we go ’round the horn for all eight of our BEGOS Markets, their respective grey trendlines ascending in each case:

But the ‘Baby Blues’ are weaking for some of them, mmb…”

Squire understands trend consistency as measured by our baby blue dots, which (save for Oil) are rolling over to one degree or another.  In other words, the trends remain up, but as such are weakening, noticeably so for the Bond, Euro, Swiss Franc, to an extent Copper, and just perhaps beginning for the S&P 500.

As for the precious metals, they remain nothing short of amazing by their 10-Market Profiles as shown next for Gold on the left and Silver on the right.  The most volume-dominant price support and Market Magnet (per the website) for the yellow metal are 3719 and 3744, whilst respectively for the white metal they are 44.15 and 43.78 with Silver looking ever so great of late!

And to exemplify Gold’s latest All-Time High, we’ve the 16-year chart of price’s structure by the month from 2010 now well into 2025, impressively exceeding our year’s forecast 3262 high.  Or to reprise the late, great, StateSide sportscaster Dick Enberg:  “Oh my!!”:

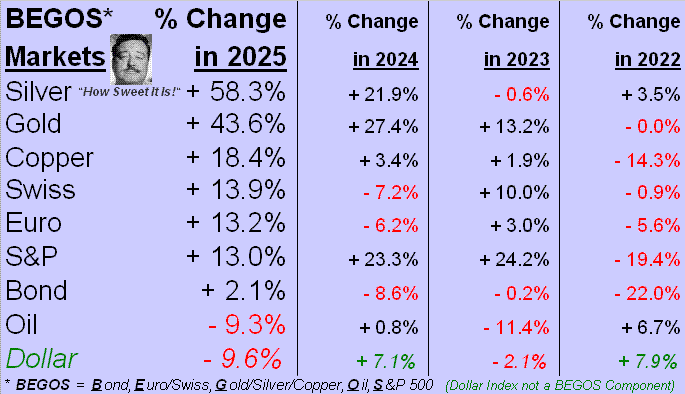
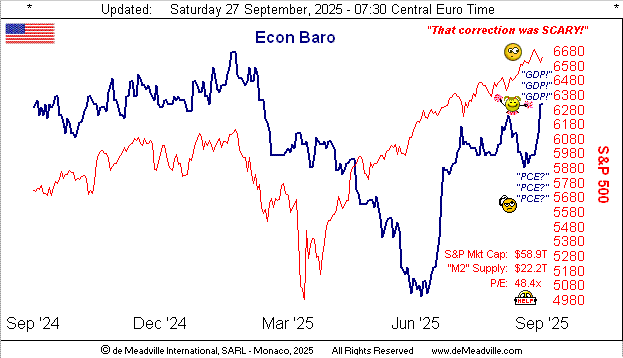
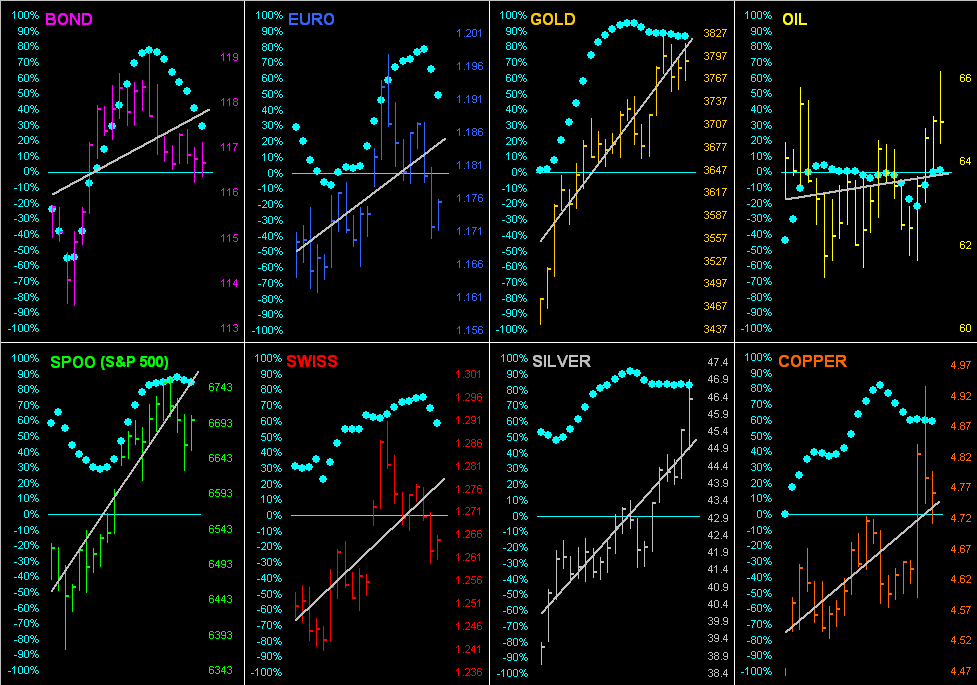
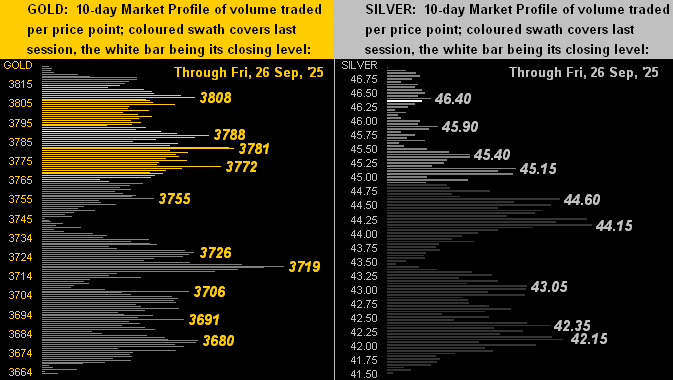
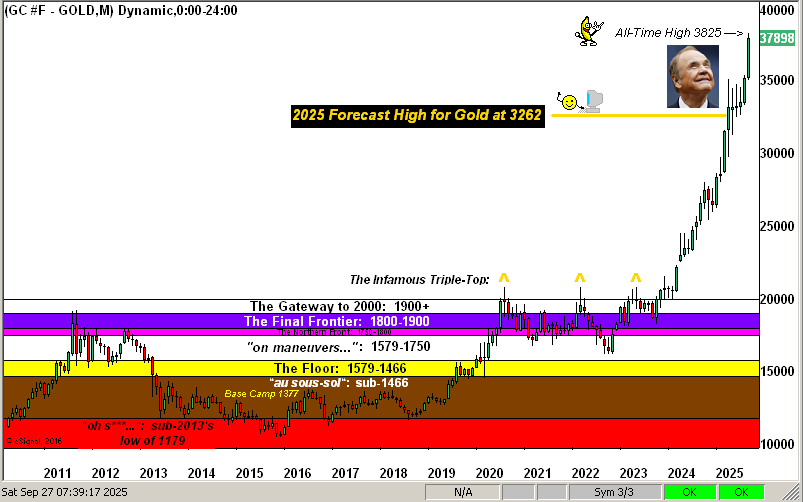
We started with Silver; let’s close with same.  The last time the Gold/Silver ratio was below its century-to-date average was well into the midst of COVID on 18 May 2021, (the white metal then priced at 28.29).  If anyone cares to comb back through the 227 missives penned since then to count how many times we’ve written “Don’t forget the Silver!”, do drop us a line.  In the meantime…

…keep towing the precious metals line!

Cheers!

…m…