The Gold Update by Mark Mead Baillie — 825th Edition — Monte-Carlo — 06 September 2025 (published each Saturday) — www.deMeadville.com
“Is Gold (Again) Getting Ahead of Itself?“
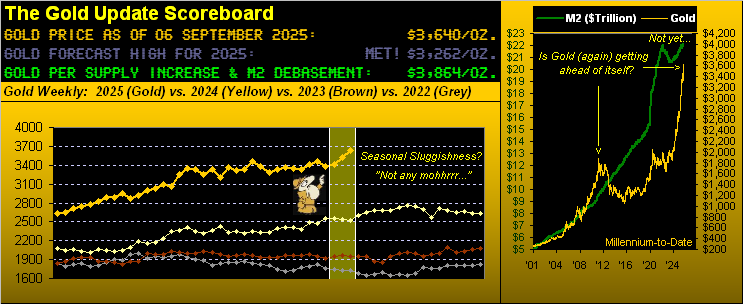
Today is 06 September 2025. Do you recall up to where Gold traded on this very date 14 years ago?
“On this day in 2011 price reached an all-time high of 1923, right mmb?”
Precisely so, Squire, yet then for nearly nine years ’twas never higher. Rather, from that landmark day’s All-Time High of 1923, Gold embarked on an almost -46% correction to as low as 1045 on 03 December 2015, before fully recovering through the ensuing four and one-half years to reach 1942 on 27 July 2020 whilst COVID cloaked the globe.
And long-time readers may recall ’twas shortly after 06 September 2011 — indeed on 01 October 2011 in the 98th Edition of The Gold Update — we wrote that Gold had gotten “ahead of itself”. As above shown in the righthand panel of the Gold Scoreboard, the price of Gold as graphed was exceeding the track of the green “M2” money supply line.
Now fast forward to today’s title, we query same: “Is Gold (Again) Getting Ahead of Itself?” The answer is (a little drumroll please…): 
No. But: ’tis not far from so doing! Again per the Scoreboard, Gold settled its week yesterday (Friday) at 3640, an All-Time Closing High, recording en route an All-Time Intraday High of 3656. And the current Dollar debasement value for Gold — even in duly adjusting for its own supply increase — is 3864. That’s just +224 points (+6.2%) higher than here. So given that Gold’s current EWTR (“expected weekly trading range”) is presently 124 points, come September’s end, Gold truly may have again gotten ahead of itself. ‘Tis not a prediction, but well worth minding.
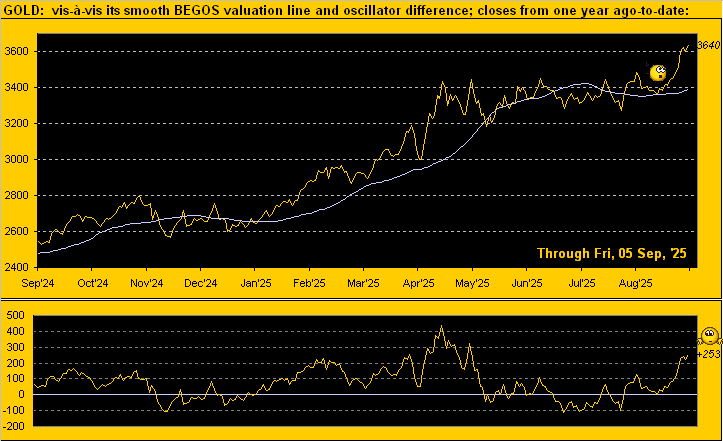
Too, by our Market Value graphic for Gold (wherein price’s movement is measured vis-à-vis those of the other primary markets which comprise BEGOS (Bond / Euro / Gold / Oil / S&P 500), the yellow metal shows as currently +253 points “high” above valuation to which it always reverts (be it up or down) … just in case you’re scoring at home:
“But mmb, are you getting bearish then on Gold?”
Oh heavens no, dear Squire. We’re merely sensitive to the fact that markets don’t move in a straight line, (save, ‘twould seem, for the ever-higher S&P 500). As noted and per the above oscillator, price always reverts to the BEGOS valuation, which itself too (albeit more ponderously) rises and falls.
Meanwhile making the rounds in the midst of it all is a Goldman Sachs call (should the Fed fall) for Gold 5000. We read the FinTimes piece of GS’ warning over “Trump political this” and “lost confidence that”. But despite the mention of inflation, hardly was the key driver of Gold’s value directly stated: again, (for you WestPalmBeachers down there) ’tis Dollar debasement.
So typically as is our wont, we did the math. And to the nearest trillion, were the Federal Reserve to add another $6T to the StateSide money supply, ‘twould “equate” to valuing Gold at 5000. Albeit, you’ll recall the $7T accommodation for COVID instead benefitted the S&P 500 rather than Gold. Which is why the S&P to this day remains so dangerously overvalued: “How’s that 45.3x price/earnings ratio workin’ out for ya?” Cue Nat King Cole in parody from ’51: ![]() “Unsustainable…”
“Unsustainable…”![]() .
.
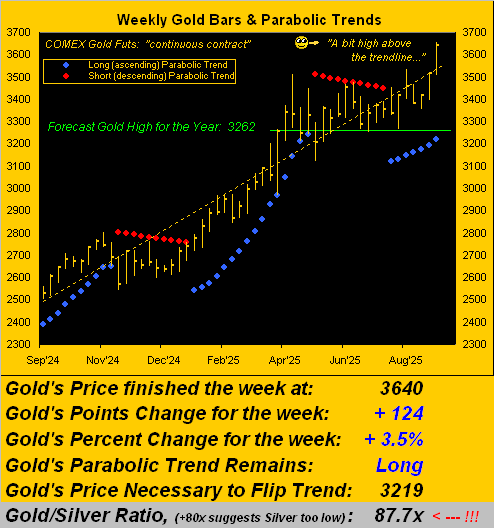
Certainly sustaining its weekly Long trends is Gold as we turn to those bars from one year ago-to-date. Our wee friend therein points toward present price being high above the dashed linear trendline; however the blue-dotted parabolic Long trend now seven weeks in duration offers 421 points of safe space between here (3640) and there (3219). Note too how our forecast high for this year (3262) is providing support at its green line. All-in-all, quite the bullish picture to this point:
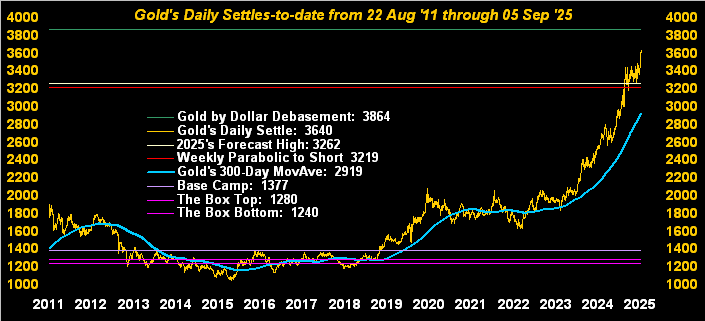
More broadly, here we’ve daily Gold from our opening discourse about price having gotten ahead of itself away back there in 2011. Came the aforementioned correction, followed by years of battling ad nauseum in and about “The Box” (1240-1280, remember that?) Yet now in retrospect, we surely can say “You’ve come a long way, baby!”
More recently, the Economic Barometer had been making its own way back up … until this past week having gone bottoms-up. Of the 13 incoming metrics, just five improved period-over-period, notably so for August both the Manufacturing and Services readings from the Institute for Supply Management. Too, Productivity for Q2 was revised sharply higher from the initial +2.4% read to +3.3% … and you know what that means: less jobs!
Thus barring inflation having spiked (as shall be determined in the new week), here comes the 17 September Fed cut, because for August, both ADP’S Employment and Labor’s Payrolls data were poor. ADP reported job creation of less than 100k for the fifth time in the past seven months, prior to which such benchmark had not been missed since September 2023. And Labor missed the 100k mark for the third consecutive month. ‘Twill be interesting to see if the leading pace of July’s very inflationary Producer Price Index (+0.9%) feeds into that for August’s Consumer Price Index come Thursday. Stay tuned…
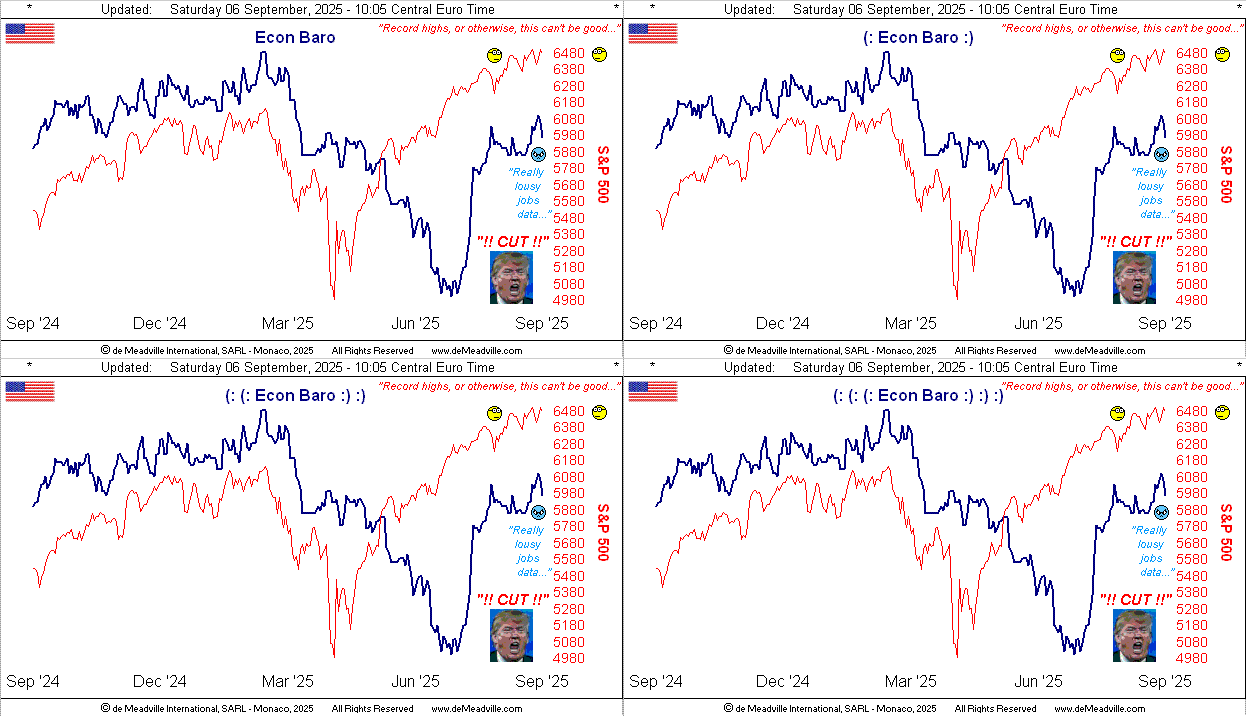
Too, we must acknowledge the S&P 500 yesterday having reached another record high (6533), before taking a -51-point drubbing into the close (6482). We see a wary September wearing on, so much so that we made this “X” remark (@deMeadvillePro) earlier in the week prior to yesterday’s still higher high:
“The S&P 500 ‘September Storm’ (per The Gold Update) is beginning. How low do we go?
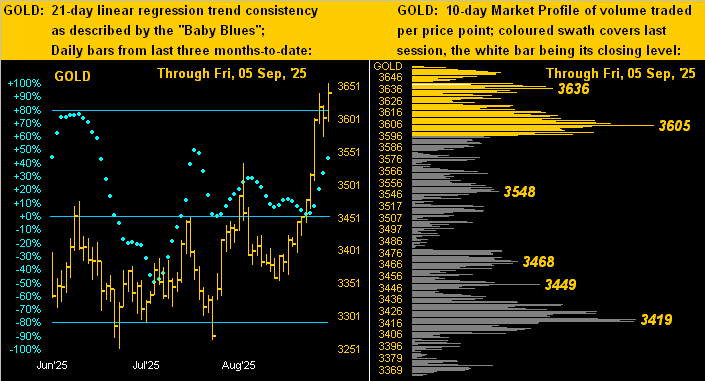
As for record-setting Gold, here next we’ve our classic two-panel display of price’s daily bars from three months ago-to-date on the left and 10-day Market Profile on the right. Gold may be getting a tad stretched, but the baby blue dots of day-to-day trend consistency are nicely on the up move.
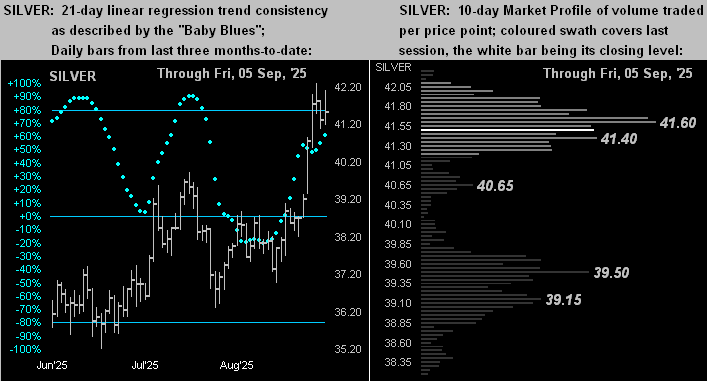
Too for Silver, here’s the like graphic. Her new-found 40s held through the entire week as she traded from as low as 40.56 to as high as 42.29. The “Baby Blues’ (below left) are getting a bit of a boost, whilst by her Profile (below right) 41.60 shows as the most volume-dominant price of the past fortnight. “Way to go, Sister Silver!”
So to close for you, how stormy is becoming the September view?

Even if ahead of itself, ‘tis best to keep Gold in your investment queue!
Cheers!
…m…
www.TheGoldUpdate.com
www.deMeadville.com
and now on “X”: @deMeadvillePro