The Gold Update by Mark Mead Baillie — 803rd Edition — Monte-Carlo — 05 April 2025 (published each Saturday) — www.deMeadville.com
“Gold Comes Off; Stocks Finally Boffed“
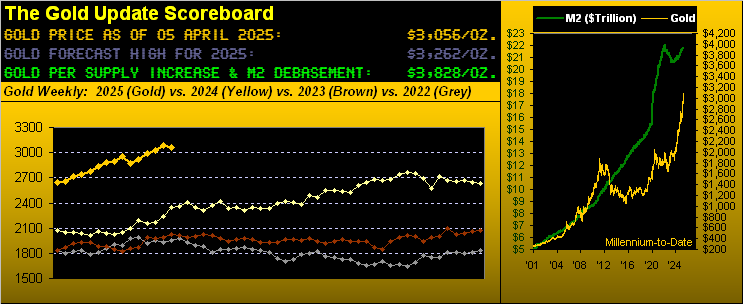
Long-time readers of The Gold Update know our favourite final future headline is: “World Ends, Dow +2”, (“The Dow” of course being that Index at which our parents used to look) … except these last two days instead brought Dow -3,911 … just in case you’re scoring at home.
“The Dow” thus having gone down, obviously, the world didn’t end, albeit as a seasoned investor here said earlier in the week: “Nobody at Goldman has ever experienced a down market”. Hence the hysteria over something way overdue, certainly so across these last few years.
Indeed on the heels of last week’s missive “Gold Aware, Stocks Beware”, an ever-so long-awaited Stocks Crash Catalyst was finally revealed in the form of a StateSide attempt for tax equality on imported goods. (See our personal experience closing wrap on that). More catalyst crash considerations later. But first, let’s cut to the quick.
Thursday and Friday saw Gold — itself overdue to come off — finally so do whilst stocks got boffed … and Sister Silver summarily slaughtered in loss … all below summarized in this BEGOS Markets’ two-day net change table nonetheless featuring Gold now as 2025’s boss:
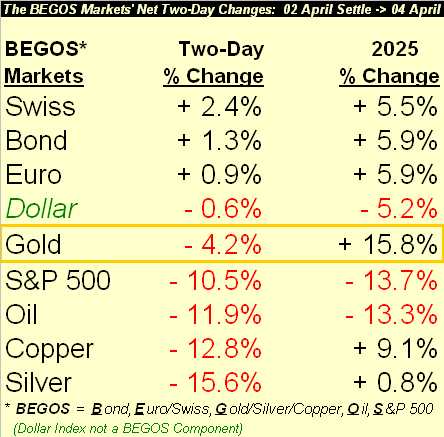
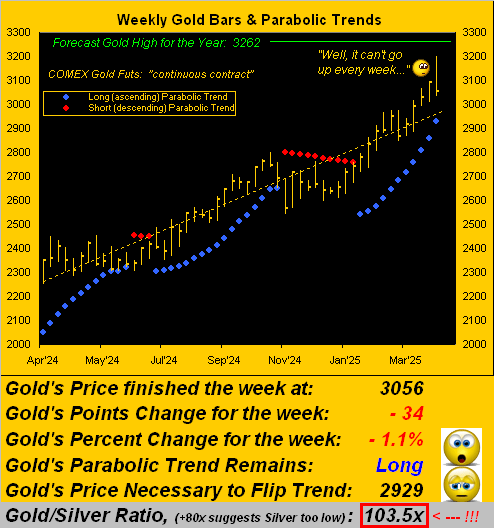
And still up +15.8% for the year, Gold this past Wednesday recorded another All-Time High at 3202: that’s a mere 60 points away from our Golden Goal Three forecast high of 3262. But then the selling ensued, price settling the week yesterday (Friday) at 3056. Through the 14 trading weeks year-to-date, ’twas just the second that was down. But yes, Virginia, Gold (below left) now at 3056 still shows technically near-term as +110 points “high” above its smooth valuation line of 2946, whereas the S&P 500 (below right) by the like metric for the futures is -787 points “low”:
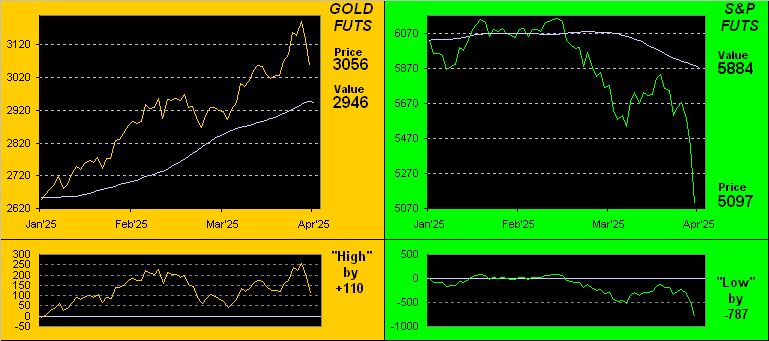
Again, we emphasize that is technically near-term: Gold is too high and the S&P 500 too low; (and you can find such stances as updated daily on the website’s BEGOS Market Values page). But fundamentally broad-term, ’tis comprehensively au contraire, mes chères soeurs et frères! True valuation of Gold is mathematically solved per debasement of the U.S. Dollar, whereas for the S&P ’tis by a rational generation of earnings.
Thus in the following table wherein Gold for the moment is +3.7% overvalued and the S&P -13.6% undervalued, of far greater importance is Gold being -20.2% undervalued (per our opening Scoreboard by Dollar Debasement) and the S&P +40.2% overvalued (per our “live” price/earnings ratio initiated a dozen years ago):

“So what you’re saying, mmb, is this sudden S&P ‘crash’ is just peanuts in the bigger picture, eh?”
Squire, throughout the 68-year existence of the S&P 500, the evolving average of its p/e always reverts to its mean. We’ll spare you the math history, but per the above table wherein we’ve calculated price by p/e as +40.2% too high — assuming earnings growth remains rather muted — price “ought” correct from here by another -28.7%, ultimately placing the S&P in the 3600s. Remember: had COVID never happened, regressing the S&P’s growth track puts it today at best in the low 3000s. But therein lies the good news: the $7T post-COVID “accounting entry” (by which the S&P made it up into the 6000s) remains in the monetary system: thus just as swiftly as dough has left the S&P, so too can it go back into the S&P, see? For the investor, ’tis at present high stress. For the trader, ’tis as present high times. Either way, a ferocious “relief rally” for the S&P wouldn’t surprise us a wit.
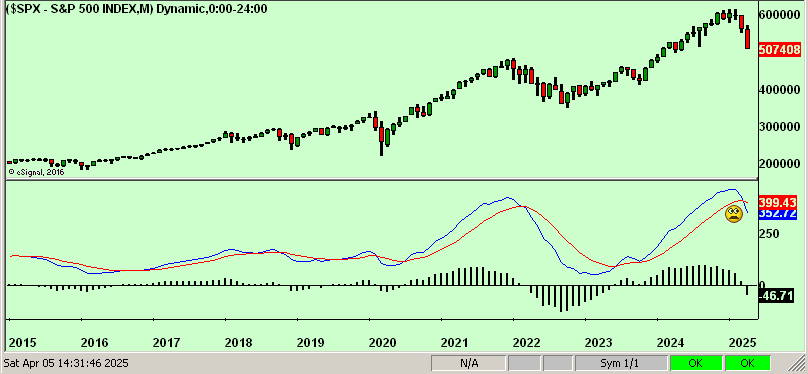
That said, this next graphic does not portend well for the S&P 500 as it shows a provisional negative MACD (moving average convergence divergence) crossover on the monthly candles. ‘Course, it would confirm at month-end, (barring first a significant recovery). Yikes…
And as earlier noted with respect to a long-awaited Stocks Crash Catalyst, we’ve oft referred to the “Look Ma, No Earnings!” crash and/or the “Look Ma, No Money!” crash. To be sure as we’ve underscored ad nauseam across many-a-missive, earnings have become meaningless, and the amount of money “invested” in the S&P 500 (aka “Casino 500”) is better than twice the size of the actual readily-available money supply to cover it all. But in awaiting the now appointed “Tariffs!” catalyst, recall what we penned back on 22 February: “Is this at long last the beginning of the end of the Investing Age of Stoopid? Either way, as to the media’s perfect scapegoat upon whom to lay blame… think about it.” Bingo.
But these past five days were not an ongoing “Bingo!” by Gold’s weekly bars as next shown. The rightmost bar high-to-low was by percentage (-5.3%) Gold’s worst intra-week loss since that ending last 22 November, whilst on a points basis (-187) the worst since that ending 14 August 2020. ‘Course year-to-date, again, +15.8% is great. But Silver’s -15.6% two-day slaughter pushed her ratio from Gold up to 103.5x, the highest reading since 14 May 2020. Priced instead to the century-to-date evolving average of 68.9x Silver right now would be +50% above her present 29.53 level at 44.38! “GOT SILVER?“ More on her in a bit. Here’s Gold’s graphic:
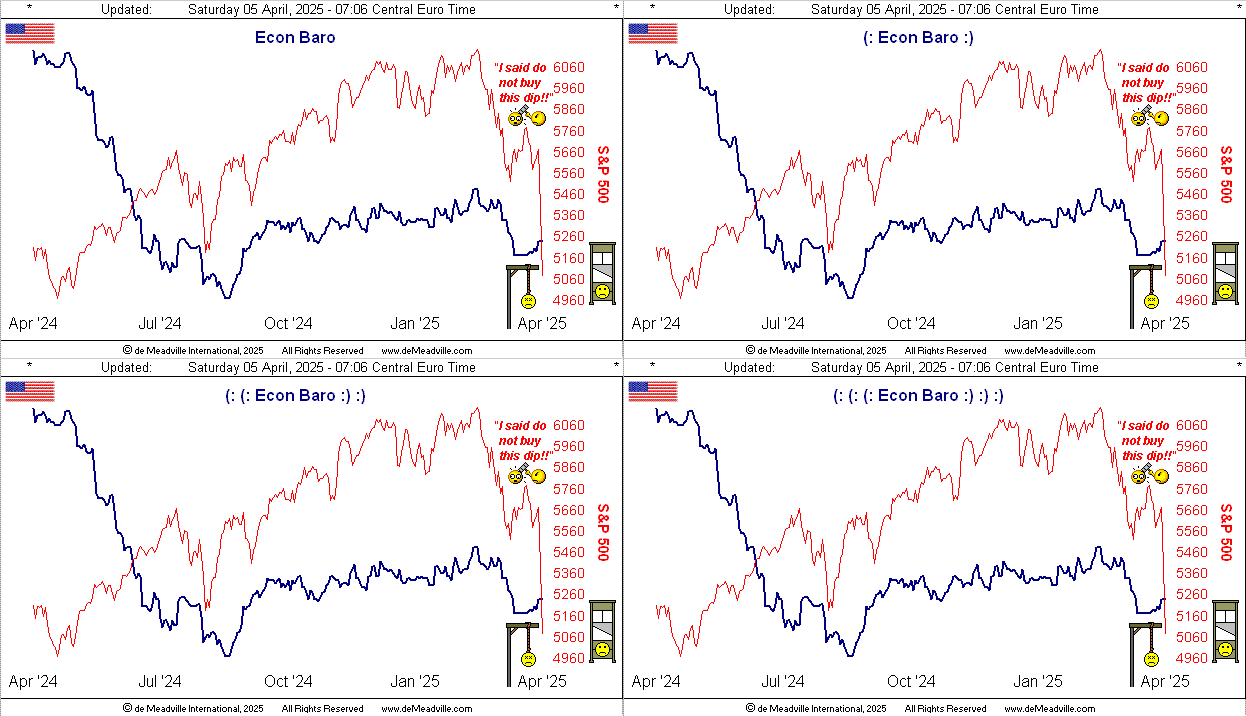
As to the Economic Barometer, the past week gave it a bit of a boost: seven of the 12 incoming metrics improved period-over-period, the best standout being March’s ADP Employment data which also beat consensus as well as having February revised upward. Negatively however, Unemployment picked up a pip whilst both the Institute for Supply Management’s Manufacturing and Services Indices declined. ‘Course, the obvious lowlight in the graphic is the S&P 500 (red line). Here’s the year-over-year view:
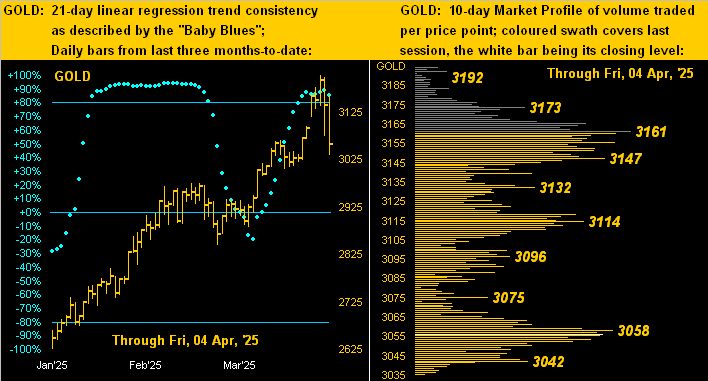
On to the precious metals daily bars for the past three months-to-date and 10-day Market Profiles. First we’ve those for Gold, her “Baby Blues” (at left) of trend consistency appearing to run out of puff; in the Profile (at right) we find it mostly populated by overhead resistors as labeled:
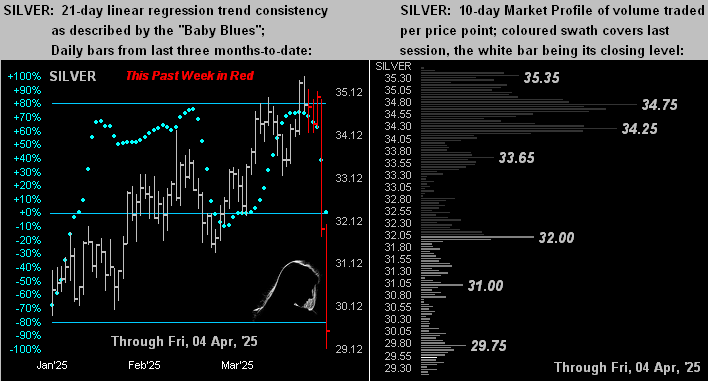
Second, there’s the like drill for poor ol’ Sister Silver: Slaughtered, creamed, annihilated, ’tis one of her worst graphics on record. So much so, that we present last week’s five trading days using red bars on the left. As for her Profile, ’tis nothing but resistance on the right. And specific to these past two days, Silver abandoned her precious metal pinstripes for her industrial metal jacket in inebriated sympathetic (indeed simply pathetic) decline (-15.6%) with Cousin Copper (-12.8%). In fact, Silver percentage-wise lost in just two days what Gold has gained year-to-date (+15.8%)! We can’t bear to look!
We’ll wrap up here for this week with a little personal experience tariff talk.
We (on the very rare occasion) make a purchase that is shipped from the United States. Our most recent case was $99 worth of a specific popping corn we simply cannot find on this side of The Pond. The shipping charge was $25, and thus the all-in cost paid to the exporter was $124.
Then came the fun part in order to take receipt of the shipment.
A customs tariff of €28 ($29) was levied along with the beloved value-added tax of €35 ($37) for an all-in cost of $190 for $99 worth of popping corn. Ex-shipping, 40% of the cost went to tariff and tax.
No wonder the “Leader of the Free world” is fired up. Just don’t let ’em get your Gold!

A team player, our Squire. Cheers!
…m…
www.TheGoldUpdate.com
www.deMeadville.com
and now on “X”: @deMeadvillePro