The Gold Update by Mark Mead Baillie — 712th Edition — Monte-Carlo — 08 July 2023 (published each Saturday) — www.deMeadville.com
“Gold’s Downtrend Duly Dissed? Stocks’ 10 Crash Catalysts!“
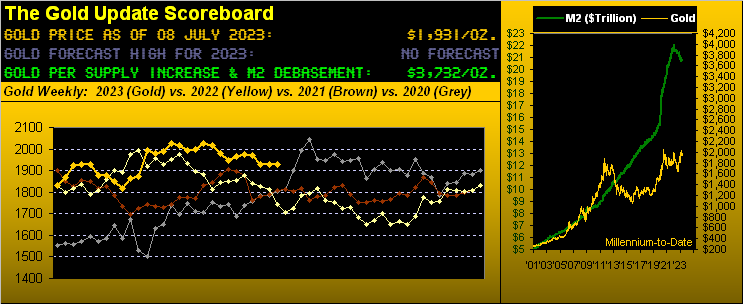
As worried as we are over the wildly overvalued stock market — our 10 crash catalysts itemized herein — let’s start with Gold as ’tis our mold. And from this week’s title we behold Gold’s downtrend for the present has instead gone on hold. Thus to the yellow metal’s weekly bars and parabolic trends we straightway go:
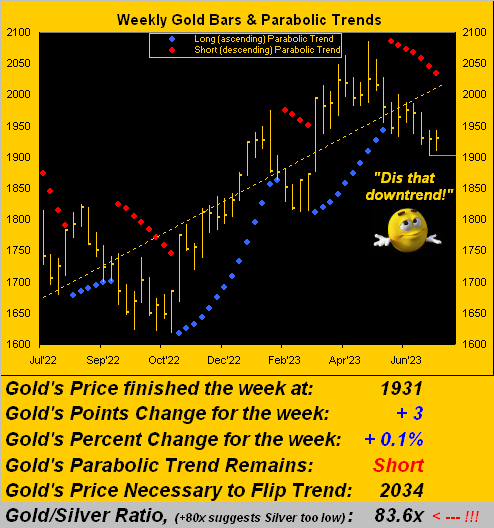
And per that rightmost run of declining red parabolic Short dots, we see the trend is now seven weeks in duration. Both the average and median durations of the prior 10 such Short trends are 13 weeks, which in such technical vacuum implies this current trend is now through its halfway mark in terms of time. ‘Course, for the trend to officially end by the dots turning blue and thus ascend, price already need be well on the move upward. And given Gold a week ago having precisely hit our selected low (futures 1901 per the wee green line, or spot 1893), this past week’s bounce to as high as 1943 suggests the Short trend is starting to lack sellers’ respect — indeed by current street vernacular — ’tis becoming “dissed”, perhaps a buying opportunity not to be missed, (lest we forget proper cash management should lower lows persist).
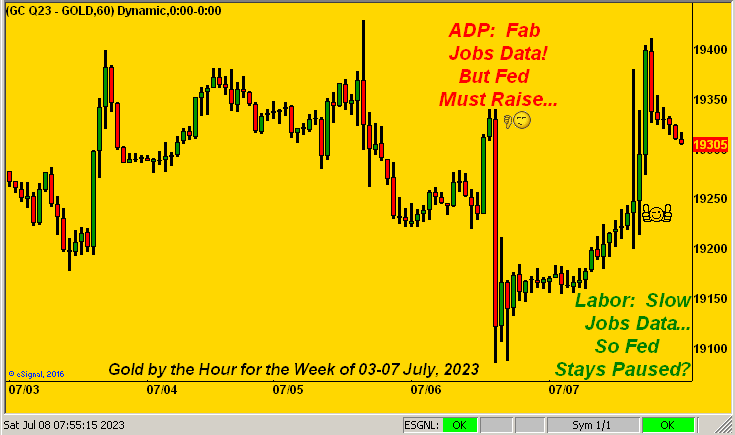
Too, in this current “Nuthin’ but Fed” trading environment (hat-tip “Depends Who’s Counting What Dept.”) this past week brought significantly disparate Payrolls’ reports for the month of June. First on Thursday came ADP’s count of fabulous jobs data — the best in 17 months and more than double the consensus expectation — immediately sending all five primary BEGOS Markets (Bond / Euro / Gold / Oil / S&P) into swift plummet for fear that the Federal Open Market Committee shall vote to raise their Bank’s Funds Rate come the 25/26 July Policy Statement. Second a mere 24 hours later came Labor’s survey indicative of the slowest monthly jobs creation since March, in turn sparking the BEGOS bunch to back up in belief of Fed benevolence. So upon the dust settling yesterday (Friday), Gold closed at 1931 as we below see per price by the hour through this past week, furthering the notion that this downtrend is now being dissed:
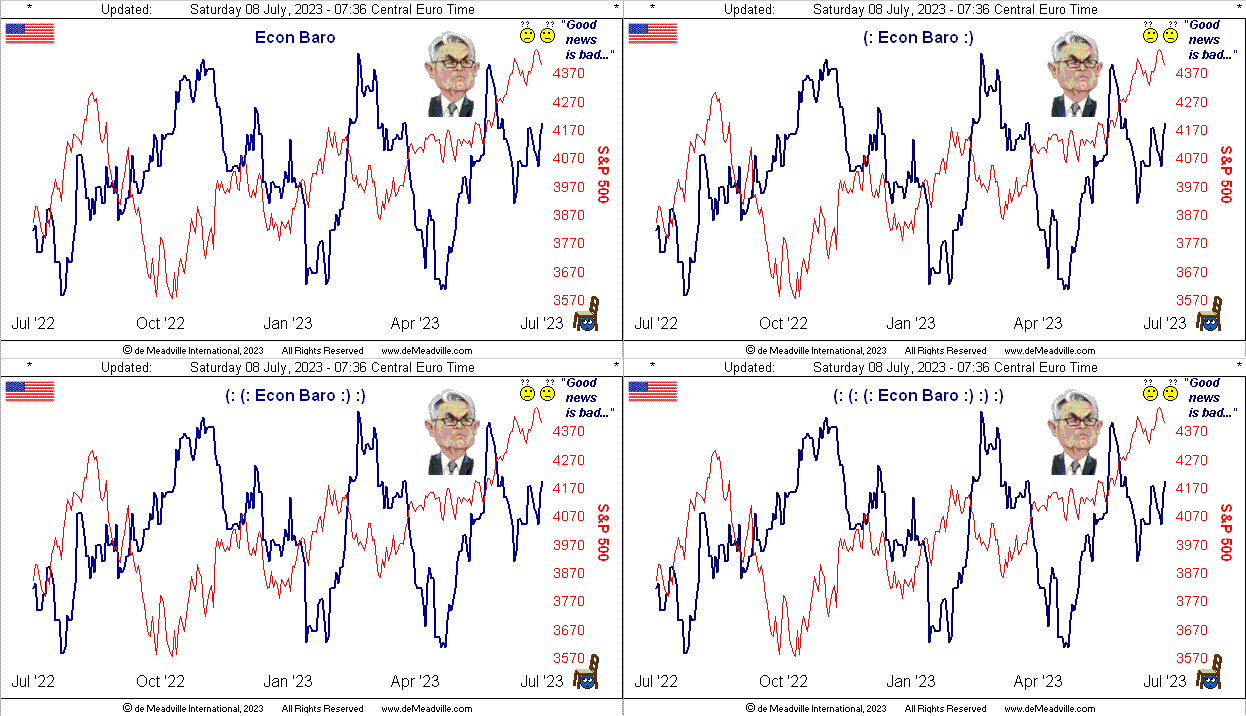
Opposing job summations aside, for the Economic Barometer at large, the past week’s mix of 11 incoming metrics were of net benefit, notably from June’s lengthened Average Workweek and dip in the Unemployment Rate, along with the Institute for Supply Management’s increase to its Services Index, plus a reduction in the StateSide Trade Deficit for May. But from the Fed’s view, good news is deemed as bad news especially given May’s stubbornly inflationary Core Personal Consumption Expenditures Prices. And guess what arrives the day after the next Fed Rate Raise on 26 July? The Chain Deflator for Q2’s Gross Domestic Product. Economic growth by substance is a good thing; ’tisn’t if by inflation. Here’s the Baro:
Next as promised from the “Worry Warts (and rightly warranted) Dept.” comes our assessment of the state of stocks as measured by our preferred gauge: the S&P 500. As egregiously overvalued as ’tis — our honestly calculated “live” price/earnings ratio having settled the week yesterday at 55.7x — the market is never wrong: the herd has put price precisely where ’tis (S&P 4399); it cannot be “willed” to somewhere else. Such is the present case, even as by universally used “textbook technical measures” the S&P just completed its 24th consecutive trading session as “overbought”. Still by the website’s MoneyFlow page, the differential of inflow over price change remains firmly positive, supportive of substantive money being thrown at the market. ![]() “When will they ever learn…”
“When will they ever learn…”![]() –[Pete Seeger, ’55].
–[Pete Seeger, ’55].
And yet, you can feel the market’s fragility. Prior to the ADP reactive price plunge on Thursday, we’d earlier in the week graphically tweeted (@deMeadvillePro) the large price gap in the S&P Futures’ 10-day Market Profile, price then taking a -42-point hoovering (ironically its “expected daily trading range”) in just under three hours. Yes, Virginia, it can go quickly.
Be that as it may, the broader fundamental picture certainly is scarier. Just as we have our Investors’ Roundtable back in whatever’s left of SanFran, here in MC we’ve expanded by respectfully meeting with some very well-established, hardened investors: and the bearishness is rife. A long-time StateSide mate just passed through here bemoaning “I’ve lost so much money shorting the market”; another is “triple-short the S&P”; further are those multi-decade experienced analysts who’ve been anticipating it all going wrong for the S&P on scales from -25% to -50% … and yet it hasn’t happened. All of this led to a discussion here last week of “What will be the catalyst that crashes the S&P?” To that end… “Nice double-entendre there, mmb…” …oh merci, Squire, mon cher ami, we’ve put together a list of 10 S&P 500 crash catalysts as follows, in no particular order as all are viable, and have been cited in past missives:
- This is the one nobody wants: a geo-political global disaster such as a nuclear incident in Ukraine, China seizing Taiwan, et alia;
- The August implementation of a Gold-based BRICS currency, but does it take? And does the Dollar break?
- Acknowledged lack of real earnings growth; ’tis obviously already in the aforementioned P/E of the S&P, and Q2 Earnings Season has just started;
- As has happened in the past, XYZ Investment Bank announces a 20% reduction in clients’ exposure to equities;
- The yield on the “everything to risk” S&P is 1.538%; for the riskless Three-Month U.S. T-Bill ’tis an annualized 5.213%;
- “Hey Martha! We need more money for the mortgage, the car, and Muffie’s skyrocketing tuition!”
- Remember the recent banking crisis? It came and went in a heartbeat. So ’tis over, right?
- The money doesn’t actually exist: as of yesterday, S&P Market Cap = $38.4T, liquid M2 Money Supply = $20.7T … Oops …
- Goofball headlines (last Monday): “Amazon is the cheapest of the ‘Magnificent Seven’ Stocks” … it’s p/e per yesterday’s close is 309.6x;
- The herd finally “hears” and in turn commences good old-fashioned fear.
Feel free to select any or all of the above as the Investing Age of Stoopid rolls right along.
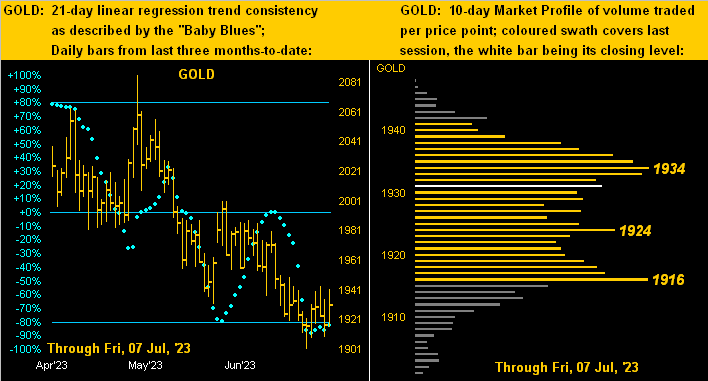
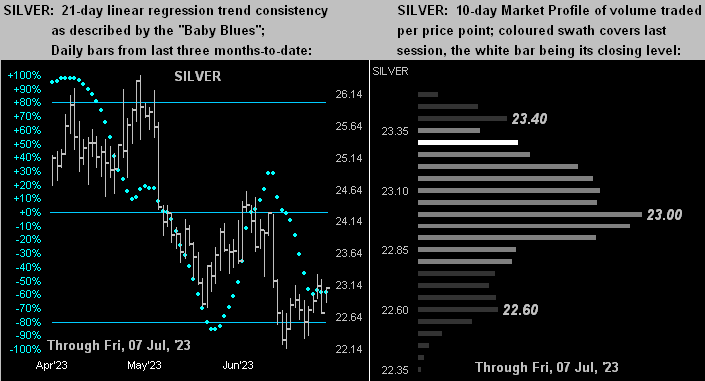
Similar is Silver’s stance, her “Baby Blues” (below left) not having suffered as much downside consistency damage as have those for Gold, whilst in her Profile (below right) she again has taken better flight:
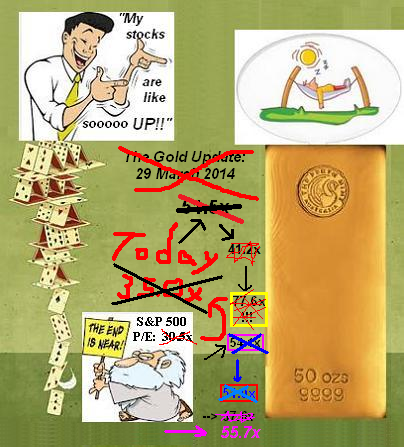
Thus with Gold poised to rise whilst the S&P faces demise, what better way to wrap than with this long-running graphic of The Gold Update, reflecting stocks’ truly inane earnings-less strain:
The ensuing week brings June inflation data at both the retail and wholesale levels, the respective headline numbers “expected by consensus” to be higher than those for May. Yep, that means more Fed impetus to keep on raisin’ dem rates, (arguably a Gold negative, albeit we’ve herein proven otherwise). But this is what you get when you flood the market with more Dollars to the tune of +31% in just three years: inflation! Which is why too ’tis time to get Gold!
Cheers!
…m…
www.TheGoldUpdate.com
www.deMeadville.com
and now on Twitter: @deMeadvillePro