The Gold Update: No. 887 – (14 November 2026) – “Gold Snowed, The Buck Behold!”

The Gold Update by Mark Mead Baillie — 887th Edition — Monte-Carlo — 14 November 2026 (published each Saturday) — www.deMeadville.com

“Gold Snowed, The Buck Behold!“

Just as a week ago we were looking for further Gold upside — price then 4080 in having reclaimed “The Floor” of 4000 — into this past week the “conventional wisdom crowd” rid themselves of Gold, given so-called “Dollar strength”.

We thus give a tip-of-the-cap to dear old “Dixie” (aka the Dollar Index) in having now reached up into the 103s, that as stated in Thursday’s Prescient Commentary was a 19-month high against its other six fiats (€uro, ¥en, Sterling, C-Dollar, Krona, and Swissie), which along with the Buck compete in the ever-futile “Ugly Dog Contest”.  And by this past week’s Buck performance to behold, Gold in turn got snowed, settling yesterday (Friday) at 3888.

Moreover, just as “Dixie” on Friday further traded up to its highest level (103.34) since 02 April 2025, so did Gold on Thursday reach its lowest level (3857) since 03 October 2025:  ’twas hardly a beautiful thAng.

“Well as you just said, mmb, that’s what the ‘conventional wisdom’ does…”

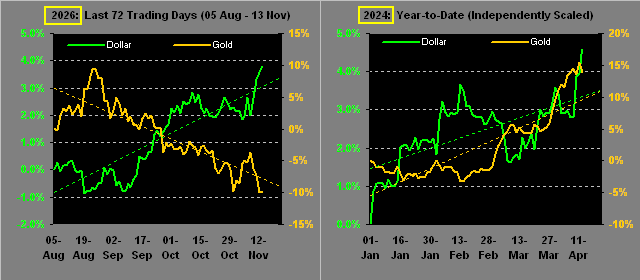
And thank you, dear Squire for brilliantly teeing up our key point.  For even in maintaining a 46-year history of Gold’s Fair Value (by Dollar debasement as lightly mitigated per the increase in the supply of Gold itself), at the end of the day via our herein quipping over many-a-missive:  “Gold plays no currency favourites.”  To wit, the following two-panel graphic, each frame featuring 72 trading days of percentage track history for both the Dollar and Gold:

■ On the left are this year’s most recent 72 trading days; the Dollar (per “Dixie”) and Gold are nearly in mirrored negative correlation, their respective dashed trendlines forming an almost perfect “x”;

■ On the right, however, are the first 72 trading days back in 2024; clearly therein the dashed trendlines are positively correlated; so where was the “conventional wisdom crowd” during that stint?
“That’s easy, mmb, they were all chasing Nvidia.”

Which today, Squire, is huang by its own petard, what?  (An ever so mild modification of verse from Shakespeare’s “Hamlet” –[1603] … but we digress…)

The point is:  Gold of late is being bid lower as debt yields rise toward the Federal Open Market Committee — in playing Scrooge just before Christmas — raising The Bank’s funds rate by +25bp per their next Policy Statement come 09 December.  ‘Course as you regular readers know, we’ve even pointed to a +50bp hike this time ’round per the FOMC’s failure to go with +25bp back on 28 October.

But that said:  October inflation did, on balance, slow.  At the retail level, the headline Consumer Price Index pace was +0.4% (vs. +0.6% in September), with the core CPI steady at +0.3%; and for the leading Producer Price Index, the headline pace dropped considerably from +1.4% to +0.3%, the PPI’s core reducing from +0.8% to +0.3%.

Thus, because the “behind the curve” Fed itself is slow to move, +25bp is what we’ll likely see.  Indeed, raise it must, the inflation paces — be they 12-month summations or October alone annualized — running well above the Fed’s desire of a +2% gait.  And higher interest rates translate into “Dixie” hitting its overhead offers.

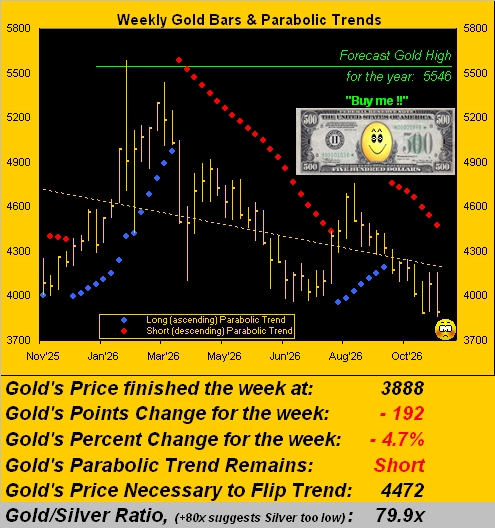
But being boffed by the Buck or otherwise, Gold remains in a downtrend, be it by the daily bars or those by the week.  Let’s start with the latter, the red-dotted parabolic Short trend now through seven weeks and the Buck lovin’ it:

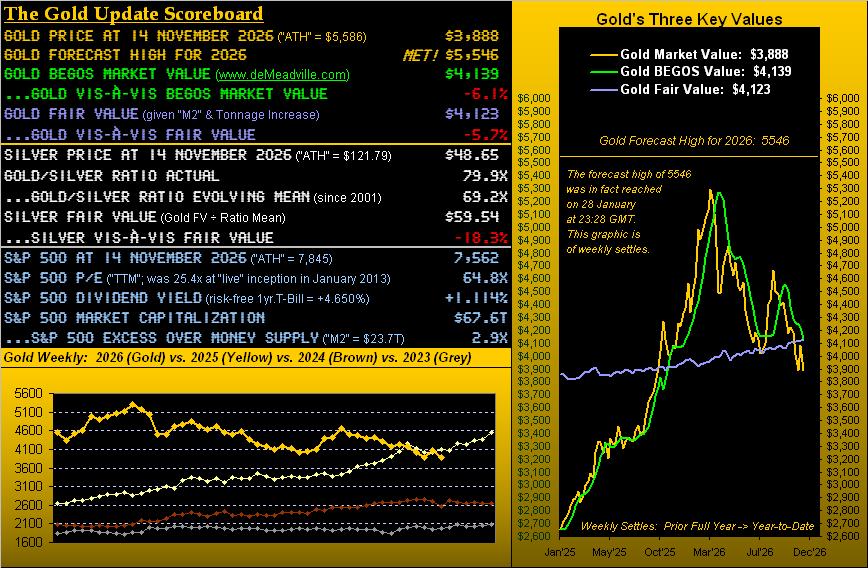
Gold’s weekly net loss of -4.7% was its third worst year-to-date.  But do we pity poor ol’ Sister Silver?  Her week’s net loss was “only” -6.3%.  Why “only”?  Because thus far in 2026 she’s sported nine weeks that were even worse.  Fortunately, the undervalued precious metals shall, in due course (which can be understatedly “lengthy”), revert upward to their respective Fair Values.  And by our opening Gold Scoreboard, the yellow metal today at 3888 is -5.7% below its 4123 Fair Value, whereas the white metal now at 48.65 is -18.3% below hers of 59.54.  “Got Silver?”

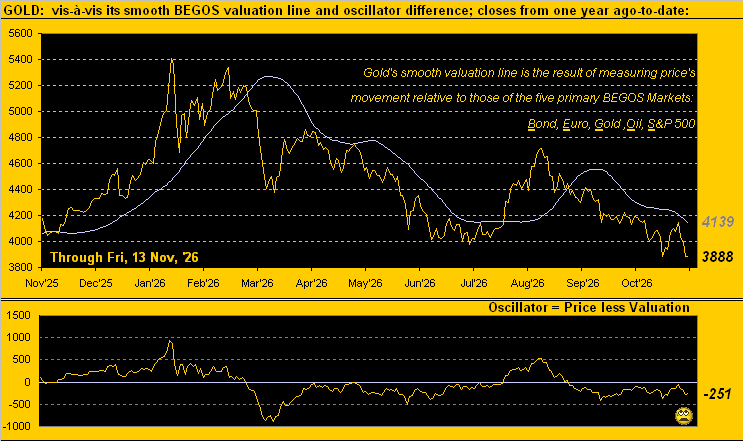
As well, Gold by its faster-moving BEGOS Market Value remains at a discount through the last 47 trading days (since 10 September).  Such value today is 4139, below which Gold at now 3888 is -6.1%, or some -251 points as we next see:

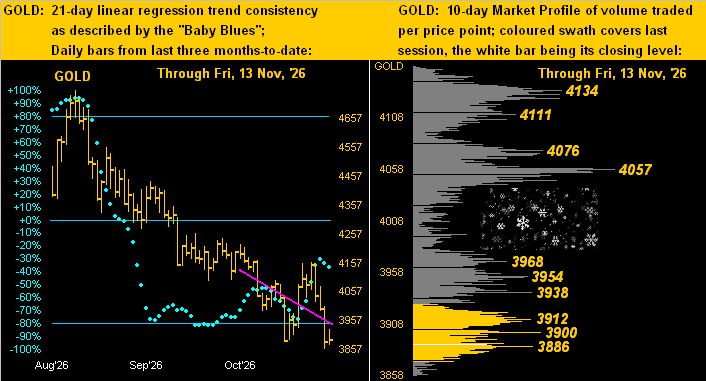
As to Gold’s aforementioned daily bars, here they are at left from three months ago-to-date, along with the 10-Day Market Profile at right.  How enthused we were in last week’s piece to see Gold’s baby blue dots of day-to-day trend consistency having turned upward!  But for the present at least, they’re stumbling, indicative of the rose trendline having rotated a bit more negatively.  As for price itself, we see it getting snowed in the Profile below, rather than in the direction we’d prefer it to go:

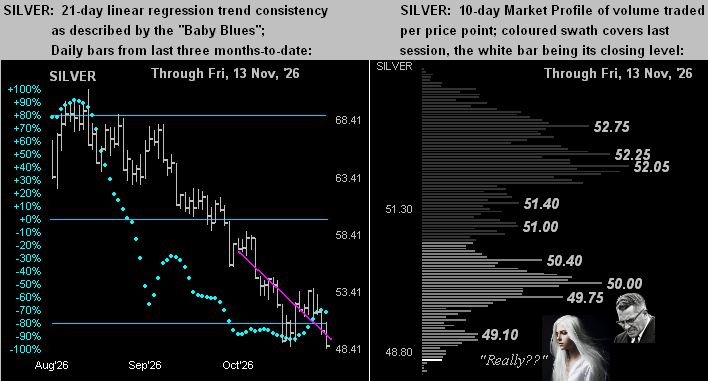
‘Course, what these days is irksome for Gold has elicited further exasperation for Silver.  The Gold/Silver ratio today at 79.9x is its highest reading since 25 November 2025.  And as duly delineated in last week’s missive, Cousin Copper is in part to blame.  Across the past 21 trading days (which for you WestPalmBeachers down there is one month), Gold’s net change is -7.3%, Copper’s is -7.6% … but for Silver ’tis -15.5%!  To yet again reprise the late, great Green Bay Packers’ head coach Vince Lombardi:  “What da hell’s goin’ on out dere?!?!?!?”  For as we turn to the like graphic of daily bars with the “Baby Blues” (below left) and Market Profile (below right), The Coach and Sister Silver justifiably are not looking very pleased:

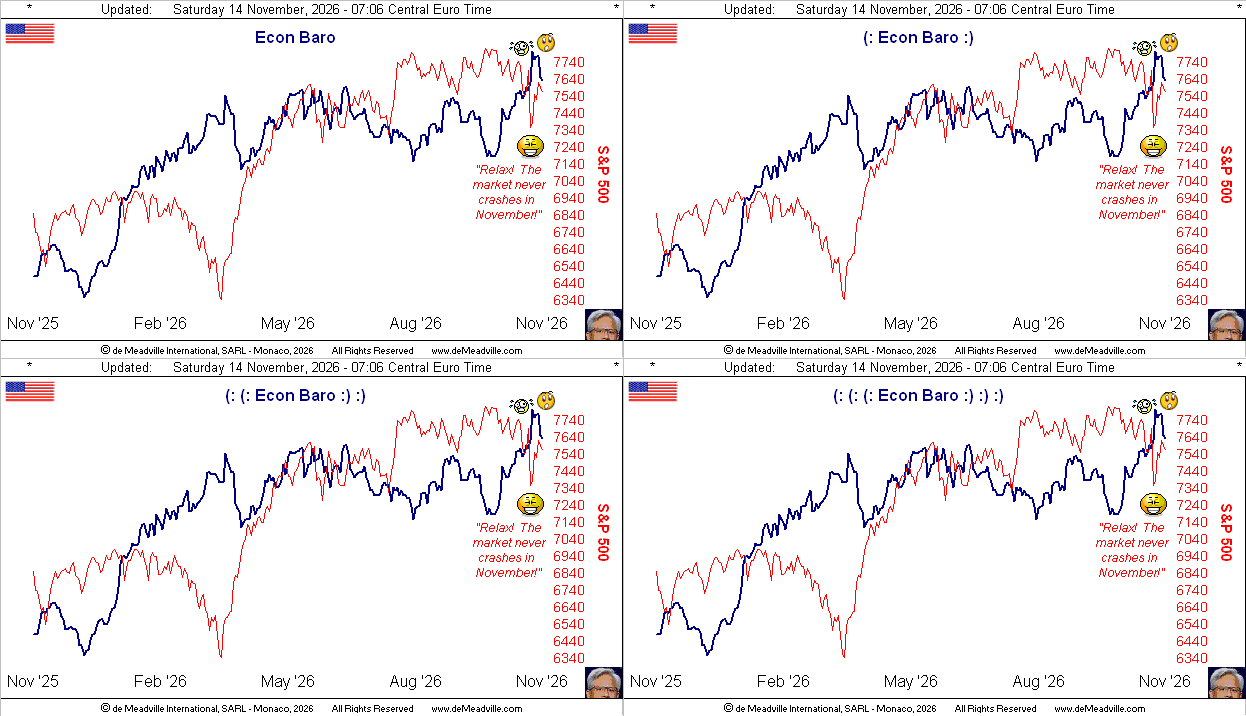
Neither was it a pleasing week for the Economic Barometer.  In fact, (without combing back through our 28 years of Econ Baro history), we do not remember any week in which — as was the case this time ’round — none of the incoming metrics improved period-over-period.  Yes, the inflation data cooled; however that can affect the Baro negatively should activity be slowing.  To wit, October’s Existing Home Sales:  they were worse than consensus, worse than those of September, itself revised worse.  (Recall our recent query of “How are those higher mortgage rates workin’ out for ya?”) The same comparative changes occurred for the backup in September’s Wholesale Inventories.  Too, Initial Jobless Claims returned to over 200k, more than both consensus and the those of the prior week, which too were revised higher.  And as to next week?  There are 16 incoming metrics, including October’s Retail Sales and the ever-beloved Conference Board’s Leading (i.e. “lagging”) Economic Index.  “Strap yourself in firmly…” –[Lois Chiles to Roger Moore, “Moonraker”, ’79):

To wrap, the question remains:  “Just how low might Gold go?”

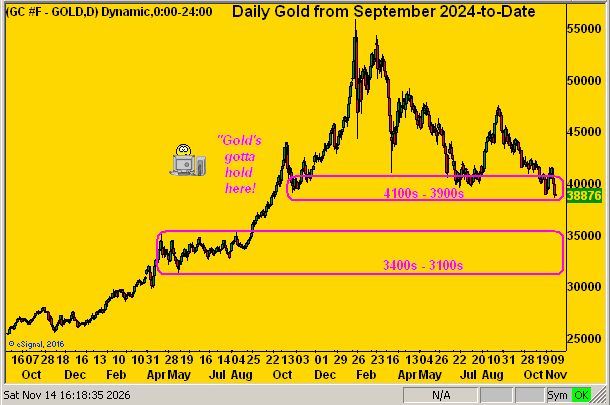
‘Tis not a pretty picture, for below here (these 3800s) there’s essentially zero structural support all the way down into the 3400s, and then some as labeled.  But as we’ve previously pointed out, such decline is far too “out of range”, especially given that Gold today is undervalued in so many ways.  Nonetheless, here’s the daily Gold picture across the past 26 months with the two key support zones:

The “conventional wisdom crowd” may be Buck bestowed, until they then get snowed and ‘twill be upside Gold we’ll behold!.

Cheers!

…m…