The Gold Update by Mark Mead Baillie — 874th Edition — Monte-Carlo — 15 August 2026 (published each Saturday) — www.deMeadville.com
“Still Higher Gold Ahead“
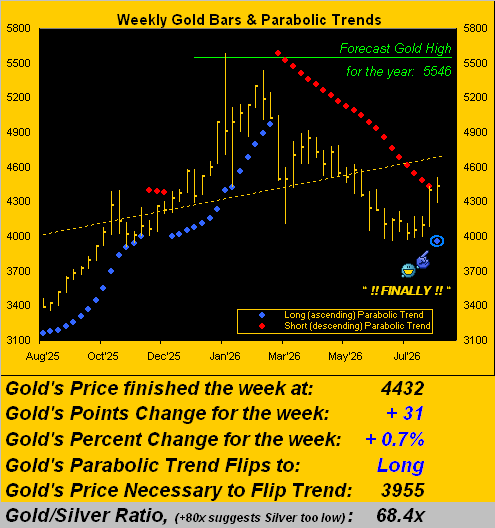
Should you regularly read the website’s daily Prescient Commentary, you already know that Gold this past week (on Monday, 10 August at precisely 18:31 GMT) provisionally eclipsed the 4434 price requisite to finally flip the seemingly endless weekly parabolic Short trend — after 21 laborious weeks — back to Long. ‘Twas confirmed yesterday (Friday) upon Gold settling at 4432. Hence our title: “Still Higher Gold Ahead”. And thus by the weekly bars from one year ago-to-date, behold the rightmost encircled blue dot:
“Yeah that’s great to see, mmb, but as I always ask, from here: how high is high?”
Squire, let us initially acknowledge the state of the “on”-again-“off”-again USA/IRN war. Since it all began late last February: when “off”, Gold ascends, but descends when “on”: and our sense is there still shall be more “on” in the year’s balance and perhaps beyond, (although ’tis said that war weaponry is dwindling on both fronts). Nevertheless, this fresh new parabolic Long signal could swiftly fail; note in the above graphic that the new “Flip Trend” price back to Short is 3955, a level that itself shall rise from one week to the next, and which currently is -477 points below today’s 4432. Gold’s expected weekly trading range is now 230 points, (the daily 96 points). So by that gauge — barring a comprehensive war-driven Gold fallout wherein the Dollar gets the bid as Oil accelerates higher — there’s likely at minimum another three-to-four weeks for this new Long trend to run.
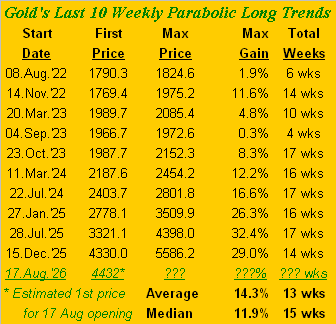
For still better guidance, let’s go to the history of Gold’s last 10 weekly parabolic Long trends:
Note that list’s first five (starting during 2022-2023) pale in performance when compared to the second five (starting during 2024-2025). Moreover, the most recent Long trends have basically gone up “off the charts” such that you’ll recall our having regularly written that Gold had “gotten ahead of itself”, followed by this year’s high-to-low correction of -29.2% (from 5586 on 29 January to 3955 on 30 June). But specific to this history graphic, at the foot we’ve depicted the “Average” and “Median” maximum Gold gains of respectively 14.3% and 11.9%. Conservatively, let’s go with the latter, in which such vacuum from here at 4432 we’d reach Gold 4959 during this Long trend. ‘Course the median duration is 15 weeks, which from today would put us at this year’s StateSide Black Friday (27 November) … and between
“Now and Then”
–[BeaTles, ’23], the S&P 500 may suffer many-a-black day in reverting to a reasonable valuation, but with an unknown Gold implication … just sayin’.
“That is really stock market bearish, mmb…”
‘Tis, Squire. Barring one’s having been out on Neptune, those paying attention have read much bearishness being cited over “AI” heading to its own “DotCom” moment, (see 2000-2002). But just this past week, the otherwise children’s writing pool over at the once-mighty Barron’s produced a sobering piece entitled: “Stock Markets Beware: AI Funding Plans Have Shades of the Financial Crisis” (see 2008-2009). Think about it: a “double-whammy” repeat likened to both the DotComBomb and FinCrisis, each of which ultimately featured -50% declines for the S&P, (which today would actually get the Index back in line with the aforementioned “reasonable valuation”).
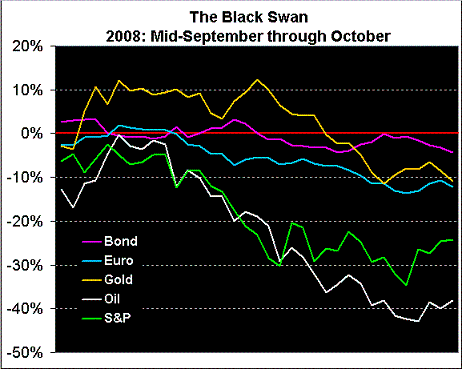
We’re only pointing this out as such “double-whammy” would likely be characterized as a “Black Swan”, during which asset prices could suffer significantly. Recall how it all began near this time in 2008:
“So are you predicting a crash, mmb?”
Specifically to the same time frame, Squire, no. But the classic “reversion to the mean” remains waiting in the wings, perhaps in those of the next Black Swan.
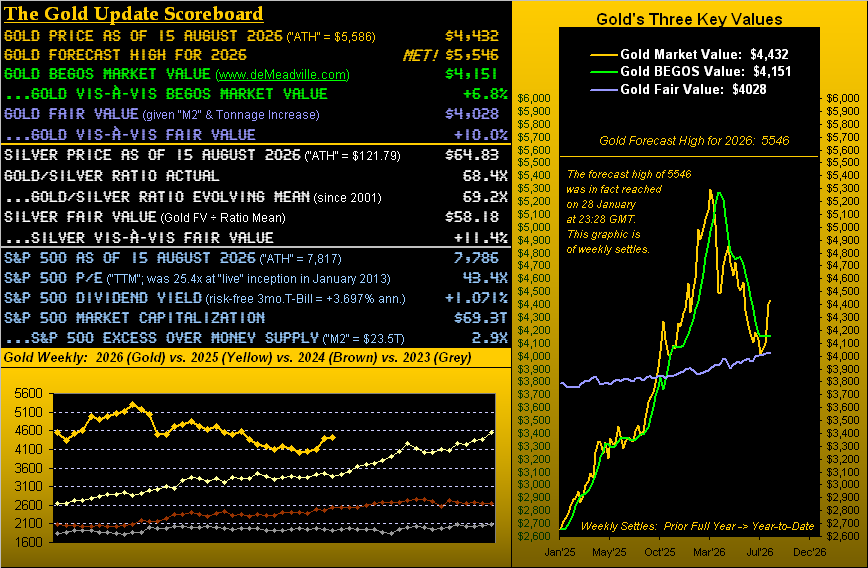
Put it this way: were it all to go wrong by year-end, ‘twouldn’t surprise us a bit. As we oft hear, ’tis merely about “The When” as “corrections” always come ’round again. Further, in addition to today’s extreme equities’ overvaluation — our “live” price/earnings ratio of the all but yieldless S&P 500 now 43.4x — there is the ongoing wildcard of the war.
As for Gold, yes price suffered to a degree in the ’08-’09 Black Swan (only to set a record high come the year 2011). And yes, price has suffered during 2026 when the war has been “on”, albeit as stated time-and-again, price pre-war had become very overvalued even upon reaching our forecast high for this year at 5546 (29 January), indeed moving briefly to 5586, the still-standing All-Time High.
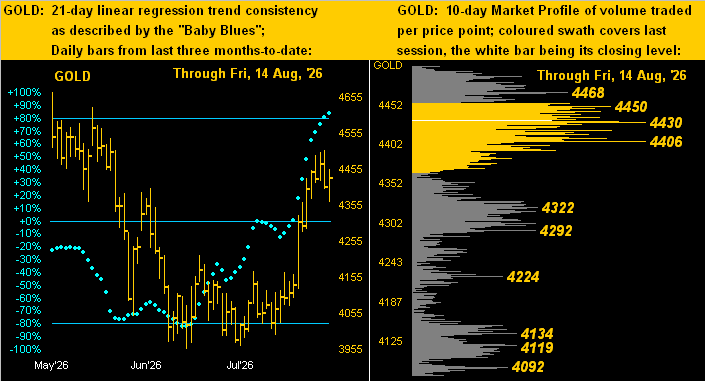
Either way, should Gold’s trend continue to be our friend, (the weekly parabolic Short trend having at last met its end), then again ’tis higher prices we portend. To wit, next we’ve the two-panel graphic of Gold’s daily bars from three months ago-to-date on the left and 10-day Market Profile on the right. This graphic of Gold appears so healthy, the Smart Alec Shorts may “dis” it as being “too healthy”. (But if any of them are still around, we always appreciate their being there to take the other side of the trade). However — our bullish bent notwithstanding — there is structural resistance from last April-May in the 4500-4900 zone, up into whatever extent Gold may drill during this new parabolic Long trend. As to the Profile, the 4400s become the goal to hold:
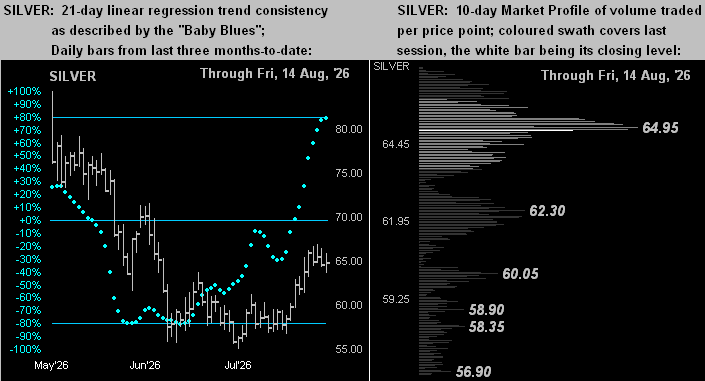
Similar is the overall state of Silver, (her having settled the week at 64.83), although 72-90 (below left) may prove structurally resistive. Initially, we’d like her to hold at least the 64s (below right). As to the white metal’s overall value relative to the yellow metal, per the opening Scoreboard, you can see that today’s Gold/Silver ratio (68.4x) is relatively near to the evolving mean (69.2x). To be sure, both precious metals are trading above their respective Fair Value; but such deviations — either above or below — can last for years if not decades prior to price reversion, (although again, Gold and Silver became excessively extreme vis-à-vis Fair Value this past winter). Here’s Sister Silver’s graphic:
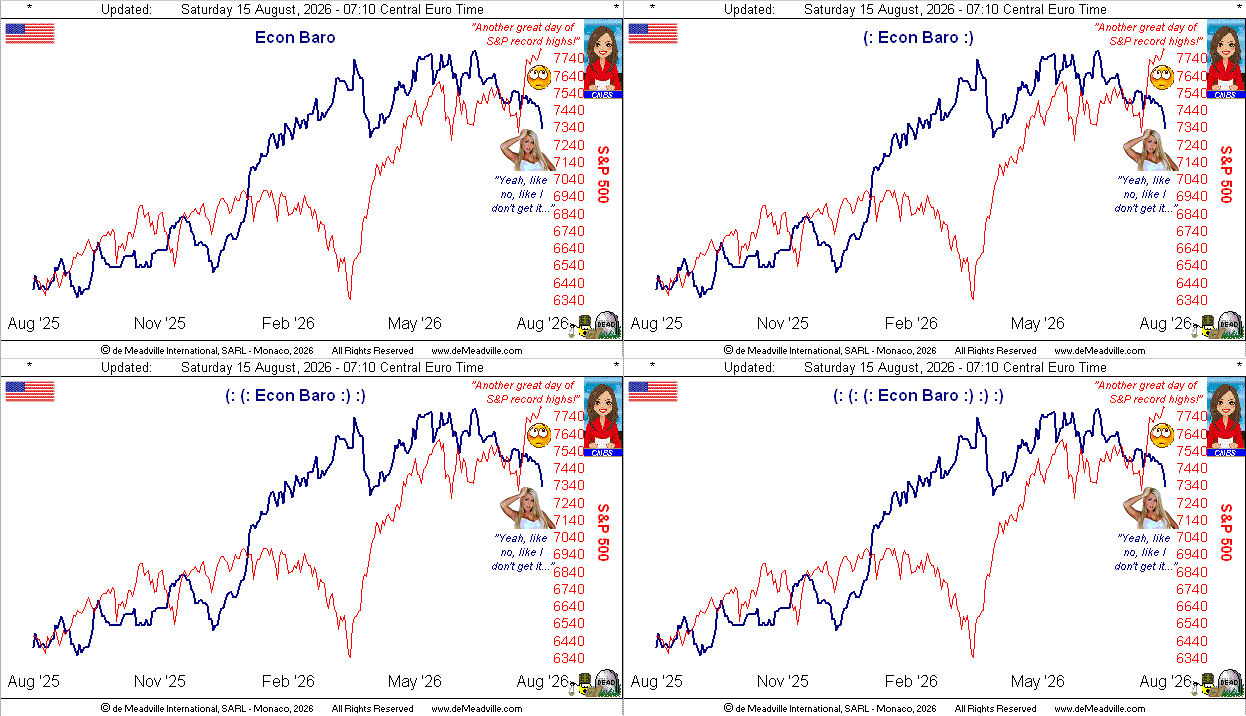
Thus for the precious metals ’tis good news; but not so good for the Econ Baro. Having developed the Economic Barometer back in 1998 (which for you WestPalmBeachers down there was 28 years ago), we were intrigued by its uncanny directional leadership of the S&P 500. But then came COVID which elicited a $7T injection into the U.S. Money Supply (“M2”) that in turn zoomed into the S&P, swiftly increasing its market capitalization by the like $7T … and hence today’s extreme overvaluation. ‘Twas at that injection the newly one-way S&P parted ways with the Baro. But with COVID now folded, the positive correlation between the Baro and S&P has been returning per this year-over-year chart of the two. So we now wait for the S&P to realize ’tis late:
The ongoing downward bent of the Baro was further precipiated this past week as just four of the 11 incoming metrics improved period-over-period. Notably poor readings were in July’s Retail Sales shrinkage and a substantive drop in The University of Michigan’s “Go Blue!” Sentiment Survey for August. Both suggest consumers are becoming nervous. Too, amongst next week’s batch of 12 metrics comes The Conference Board’s Leading (i.e. “lagging”) Economic Index for July, for which the consensus is negative, (and not surprisingly so given the down Baro).
To wrap, we’ve the Stack:
The Gold Stack (continuous contract pricing):
Gold’s All-Time Intra-Day High: 5586 (29 January 2026)
2026’s High: 5586 (29 January)
Gold’s All-Time Closing High: 5411 (28 January 2026)
10-Session directional range: up to 4503 (from 4081) = +422 points or +10.3%
Trading Resistance: nearby Market Profile notables: 4488 / 4468 / 4450
Gold Currently: 4432, (expected daily trading range [“EDTR”]: 96 points)
Trading Support: nearby Market Profile notables: 4406 / 4322 / 4292
10-Session “volume-weighted” average price magnet: 4343
The 300-Day Moving Average: 4196 and rising
Gold’s BEGOS Market Value (from our opening “Scoreboard”): 4151
Gold’s Fair Value per Dollar Debasement, (from our opening “Scoreboard”): 4028
The Weekly Parabolic Price to flip Short: 3955
2026’s Low: 3955 (30 June)
The 2000’s Triple-Top: 2089 (07 Aug ’20); 2079 (08 Mar’22); 2085 (04 May ’23)
The Gateway to 2000: 1900+
The Final Frontier: 1800-1900
The Northern Front: 1800-1750
On Maneuvers: 1750-1579
The Floor: 1579-1466
Le Sous-sol: Sub-1466
The Support Shelf: 1454-1434
Base Camp: 1377
The 1360s Double-Top: 1369 in Apr ’18 preceded by 1362 in Sep ’17
Neverland: The Whiny 1290s
The Box: 1280-1240
In simply summary: think ’tis a good time to be holding Gold? Indeed!

Cheers!
…m…
www.TheGoldUpdate.com
www.deMeadville.com
and now on “X”: @deMeadvillePro