The Gold Update: No. 868 – (04 July 2026) – “Get Gold Groovin’!”

The Gold Update by Mark Mead Baillie — 868th Edition — Monte-Carlo — 04 July 2026 (published each Saturday) — www.deMeadville.com

Get Gold Groovin’!

We really like what we’re now seeing for Gold.  After many-a-week of downside drudgery, ‘twould appear the yellow-metal is at least poised to make a turn back up, perhaps substantively so.  More on that in a minute, but first:

StateSide — it being “The Fourth of July” (No. 250) — let’s start with some feuding fireworks from the FinMedia as regards FedHead Kevin “The Warrior” Warsh this past Thursday at 2026’s European Central Bank Forum in Sintra, Portugal.  Both these headlines appeared simultaneously “above the fold” late Thursday by the cited sources:

  • Bloomy“Signs of economic strength alongside easing price pressures … Federal Reserve Chair Kevin Warsh saying inflation risks have come down.”

  • CNBS“Fed Chief Kevin Warsh … says inflation ‘too high'”

Query:

So which is it?

  • Have inflation risks actually come down, indicative of no rate hike on 29 July?
  • Or is inflation actually too high, supportive of a rate hike on 29 July?

Response:

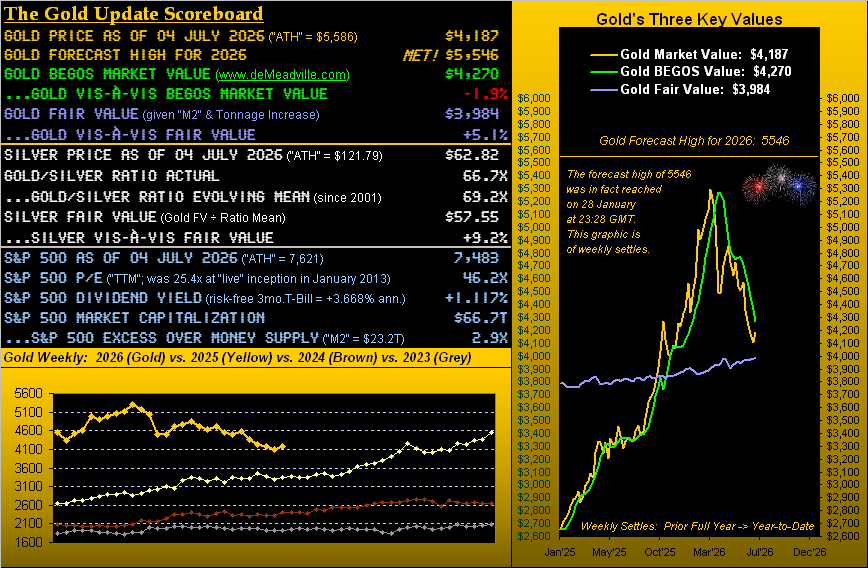
We already know by simple grade-school arithmetic it ought be the latter.  As our May Inflation Summary (herein posted a week ago) showed — and bearing in mind the Federal Reserve’s targeted +2.0% pace — annualized inflation by May’s 12-month average is running at +4.3%, and by annualizing May alone ’tis +5.8%.  What ever happened to +2.0%?  Warsh wants it.  Thus, the second of those queries clearly is the more appropriate … save that today’s mathematically-challenged FinWorld consensus expects the 29 July Open Market Committee voting to “Not raise!”

“But hang on, mmb, ’cause April’s annualized average was +8.0%, so by that, risks are coming down…

Squire, any way ’tis couched, every major inflation measure is running well beyond the adamantly Fed-targeted +2.0%.  That stated, perhaps +2.0% has become archaic.  Just as has an S&P 500 price/earnings ratio (now 46.2x) ever returning to the portfolio theory standard of 15x become archaic, (until ’tisn’t).

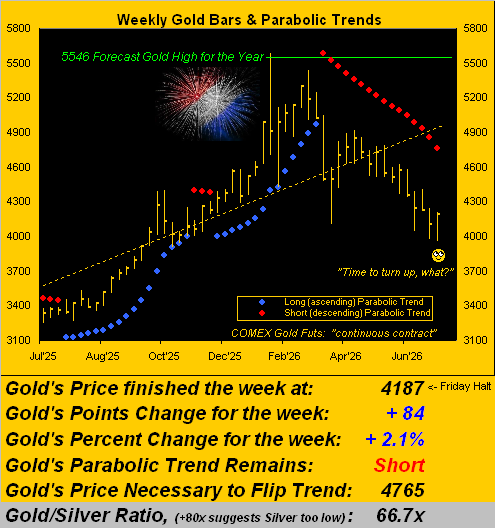
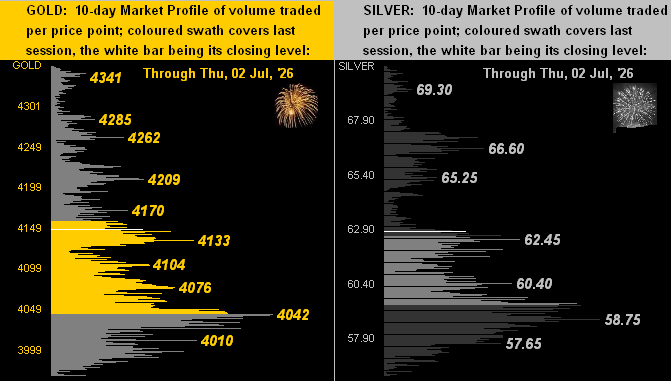
Specific to Gold, its prior-week teasing of Fair Value (now 3984 per the opening Scoreboard) heralded buying.  Before Gold’s gain of this past week, 12 of the previous 18 were net down.  But price then settled Thursday at 4136 (this holiday-shortened week’s official COMEX close) and yesterday (Friday ) furthered itself to as high as 4208 prior to hitting the abbreviated session’s “trading halt” at 4187 toward Monday settlement, (yes the same unusual scheduling as was the case two weeks ago).

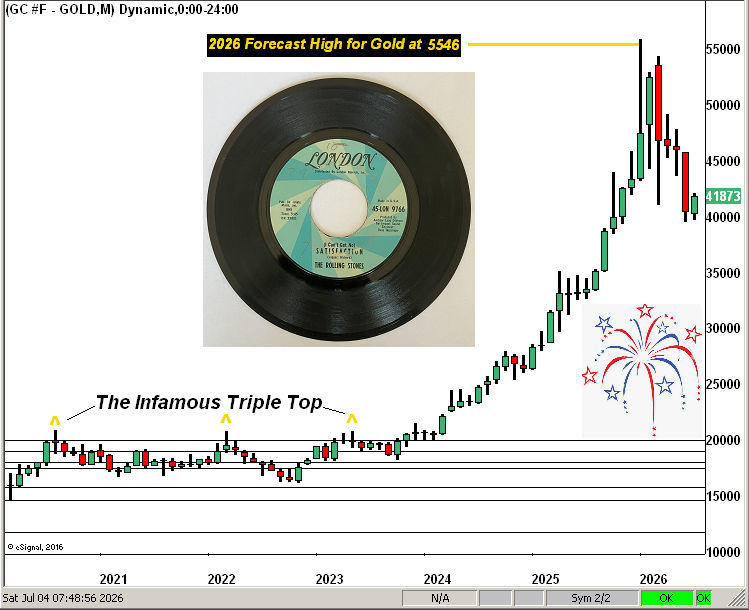
So in turning to Gold’s weekly bars and parabolic trends since this time a year ago, we’ve printed the Friday “halt” price rather than Thursday’s settle, (as technically we’re already trading Monday).  Moreover, our sense is Gold — at long last — looks to make an up-run toward, in due course, meeting the cascading red dots of the now 16-week parabolic Short trend.  And just in case you’re scoring at home, the midpoint between price (4187) and parabolic (4765) is 4476, i.e. some +289 points above here.  Gold’s expected weekly trading range?  269 points.  So barring Gold going straight up, ’tis still feasible that this parabolic Short trend shall meet its end come month-end:

“Still, that’s moving a lot back above Fair Value, mmb…

A welcome “teed-up” point there, Squire.  Fair Value is the most ponderously-moving valuation for Gold:  ’tis a very “Big Picture” measure that spans decades.  And earlier this year we found Gold rocketing quite excessively far above Fair Value, the record high of 5586 a distance (then above 3868) of +1,718 points, for which we stated week-after-week (albeit as a bit of a lone wolf) that price had “gotten well ahead of itself”.  Thus came the decline across five months to re-meet Fair Value as herein depicted a week ago, price then straightaway turning back up.

Now Gold appears again ready to get its engines movin’ and start groovin’.  To wit, our one-year chart of Gold astride its BEGOS Market Value, which (per the Scoreboard) at now 4270 is nearly +2% (+83 points) higher than present price.  ‘Tis not far to go given Gold’s expected daily trading range is now 125 points.  Here’s the graphic:

Another of our favourite leading indicators are the “Baby Blues” which measure regression trend consistency.  And it being month-end (plus a few trading days), let’s go ’round the horn for all eight BEGOS Markets.  Each panel charts the last 21 trading days (one month) with its grey diagonal trend line and the “Blues”, for which we specifically address your attention to both Gold and Silver.  Their respective “Blues” have commenced the welcome curling upward from the -80% level, the rule being to expect still higher prices near-term.  We thus placed the “BUY” signal at both crossings, (Silver having come first in closing out June, followed by Gold into week’s end).  Let’s see if near-term Gold tests its mid-panel high at 4404 and that for Silver at 71.65.  Cautiously however, a rate hike scare may not bring those levels to bear:  thus cash management remains as ever paramount.  On verra…

In staying with the BEGOS Markets, for the once-dominant precious metals, they’ve quite literally dropped from first to worst as we go to our year-to-date standings, Copper being the sole element of our Metals Triumvirate still on a podium position.  ‘Course, with a hat-tip to the “Prices Are Not Unidirectional Dept.” one can’t overly complain:  Gold now -3.3% was +64.1% last year, with Silver now -11.5% having been +142.3%.  And with respect to those aforementioned mid-panel highs, if achieved, both Gold and Silver would again be above water on the year:

Furthering the opportunity for the metals to move higher are their having overcome (in part due to comments from “The Warrior”) what had been substantive overhead volume/price resistance per the 10-day Market Profiles, updated below for Gold on the left and for Silver on the right.  The white closing bars represent Friday’s “halt” prices, (the Profiles themselves as assembled through Thursday):

Now given the leverage of the metals’ equities, year-to-date has been anything but great, their downside fireworks having abetted one’s loss rate.  Yet, this graphic’s bunch are all still up from a full year ago-to-date, with notably Gold the least so at +25%, bettered by Agnico Eagle Mines (AEM) +30%, Franco-Nevada (FNV) +33%, the VanEck Vectors Gold Miners exchange-traded fund (GDX) +51%, Pan American Silver (PAAS) +63%, Newmont (NEM) +65%, and the Global X Silver Miners exchange-traded fund (SIL) +66%.  But across the board from last winter’s highs, the percentage drops have been massive.  Now comes the chance to recover a bit:

As to Gold’s structure by the month since the year 2020, price’s last four consecutive down months (March through June) may just now be getting some relief this early July (the rightmost candle) after gettin’ no “Satisfaction”

All of which brings us to the Baro, back from whence we started with FedHead Kevin “The Warrior” Warsh in Portugal alluding to signs of economic strength with easing price pressures, albeit admitting inflation is too high.  By the Economic Barometer, the StateSide economy already has been showing strength essentially year-over-year, as we see here, although the curve of late (as anticipated a week go) continues to flatten, ‘twould appear:

So there we are, half the year but a memoir.  Our deMeadville analytics are indicative of higher Gold near-term, supported (just maybe) by a little waffling as to Fed direction.  Again, how might “The Warrior” be drafting it?

In the interim, let’s get groovin’ rather than fazed, and watch precious metals’ prices get raised!

…m…