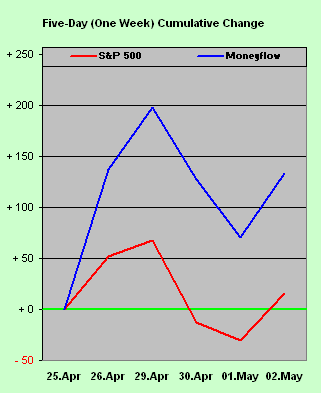
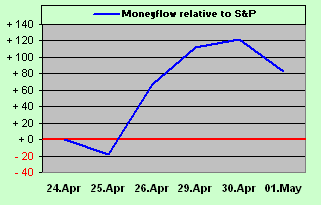
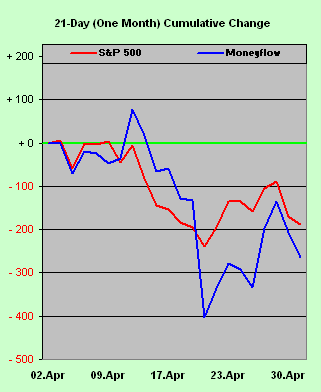
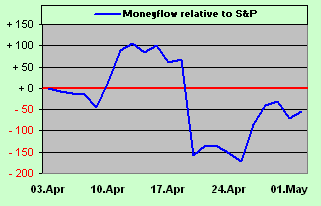
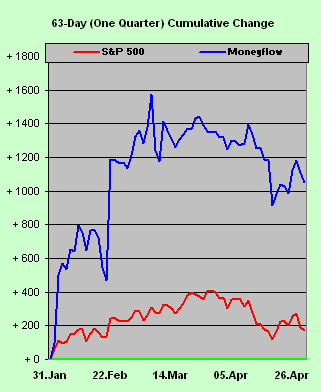
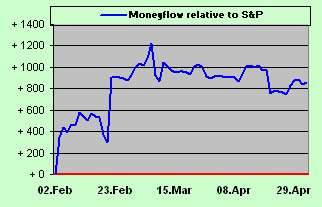
One of our favourite generally leading indicators, here we regress our calculation of the S&P 500’s Moneyflow into points so as to be directly comparable to the change in the Index itself, toward confirming else refuting market direction. The three panels’ time frames from left-to-right are for one week (the last 5 days), one month (the last 21 days) and one quarter (the last 63 days), all incrementally updated every trading day: