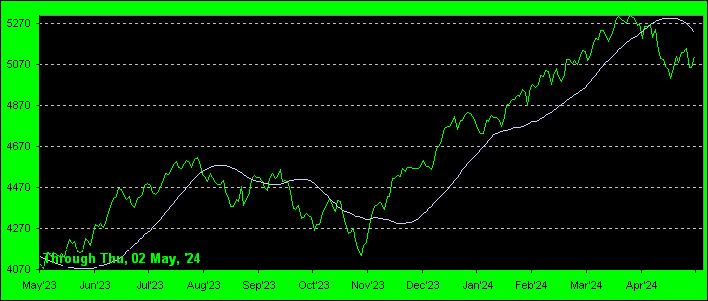
Market Values
“The two-panel Market Value chart for each of the 5 primary BEGOS Markets is indicative of continued near term direction. The upper panel shows the market’s price and its smooth valuation line relative to the other four primary BEGOS markets. However, in the lower panel which is the difference between two lines, the resulting deviation shows when the trend is near to end.”
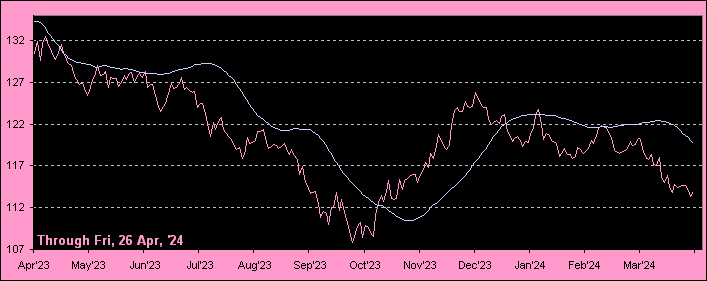
BOND: 30-Year US Bond, (Chicago Board of Trade Futures), from one year ago-to-date:

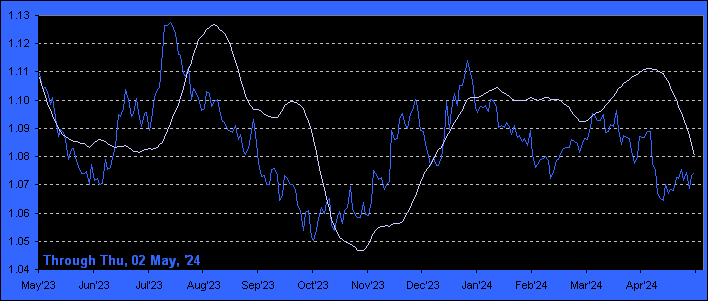
EURO: Dollars per Euro, (Chicago Mercantile Exchange Futures), from one year ago-to-date:

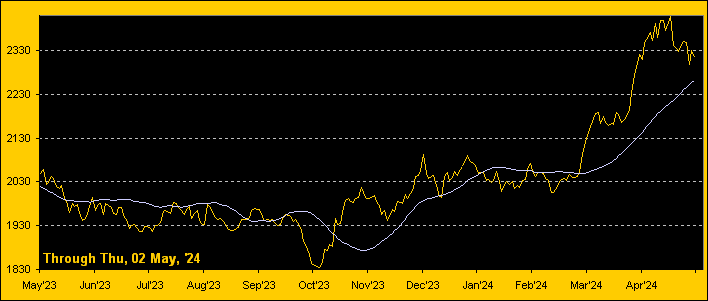
GOLD: (New York COMEX Gold Futures), from one year ago-to-date:

OIL: West Texas Intermediate Crude, (NYMEX Oil Futures), from one year ago-to-date:exa
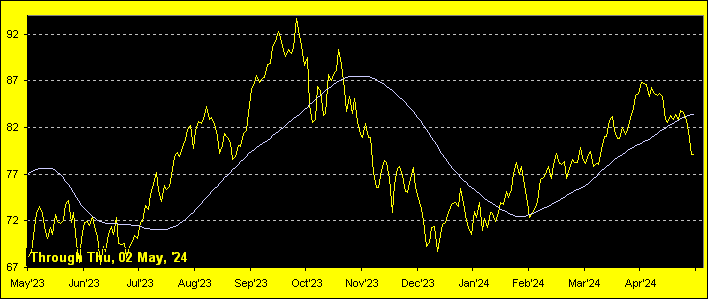

S&P: S&P 500 Spoo, (Chicago Mercantile Exchange Futures), from one year ago-to-date:
