The BEGOS acronym letter ‘S’ is for the S&P 500 Futures contract (aka “the Spoo”), representative of the world’s highest quality stock market index, as priced on The Chicago Mercantile Exchange and Globex.
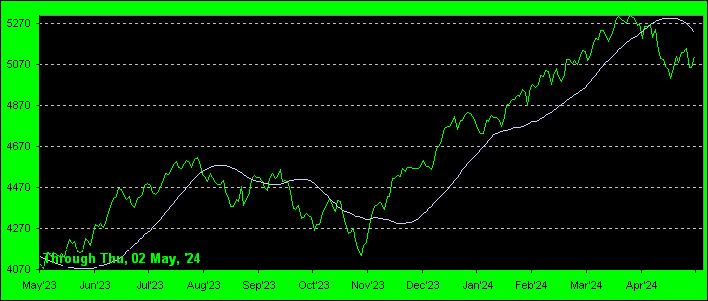
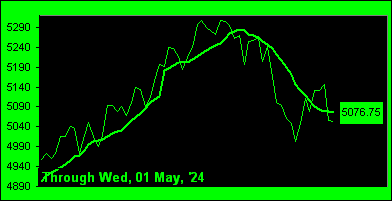
Market Value
When the Spoo crosses its smooth Market Value line, we anticipate the price to continue in the same direction. But when the price gets too far away from the Market Value line we are wary the trend may be ending.
Upper panel description: the price of the Spoo and its Market Value line from a year ago-to-date.
Lower panel description: the deviation of the Spoo from its Market Value line.
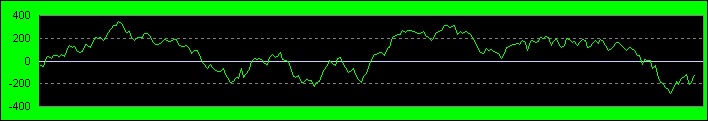
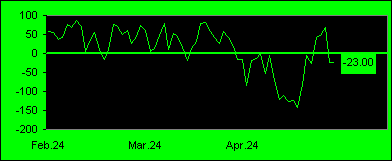
Market Trend
These are the Spoo’s daily bars for the last three months to-date. The blue dots (aka “Baby Blues”) denote trend consistency. When the blue dots break above their -80% axis, higher prices are anticipated. When the blue dots break below their +80% axis, lower price is anticipated. Either way, the “Baby Blues” are a keen depiction of current trend.
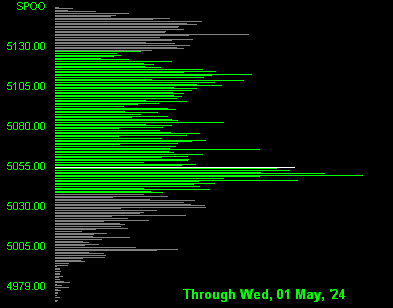
Market Profile
The Spoo’s Market Profile is essentially the amount of contract volume traded at every price point across the past 10 trading days, (i.e. two weeks). The longest lines are therefore indicative of price support and resistance. The colored lines represent the most recent trading day with the white bar as the last closing price.
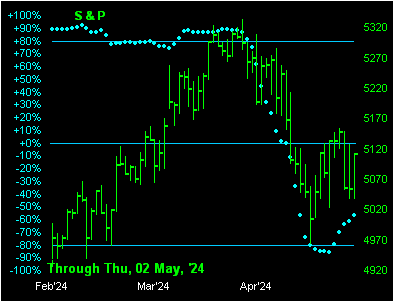
Market Magnet
The Spoo’s Magnet is the volume-weighted consensus price of the Spoo’s’ Market Profile. Upon the Spoo being “attracted” to and crossing the Magnet, we expect price to continue in the same direction. But when the price gets too far away from the Magnet, we anticipate price to be re-attracted to the Magnet.
Upper panel description: the price of the Spoo and its Magnet level as shown in the box.
Lower panel description: the deviation as shown in the box of the Spoo from its Magnet.
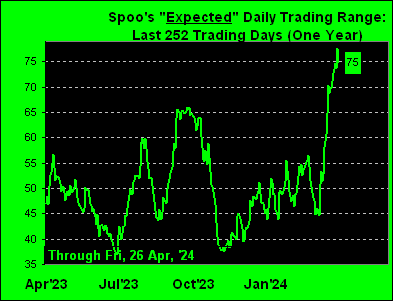
Market Range
The “Expected Daily Trading Range” (EDTR) is a rational, acceptable estimate as to the number of points the Spoo may span between the high and low for the ensuing trading day. That number is inside the chart’s box.
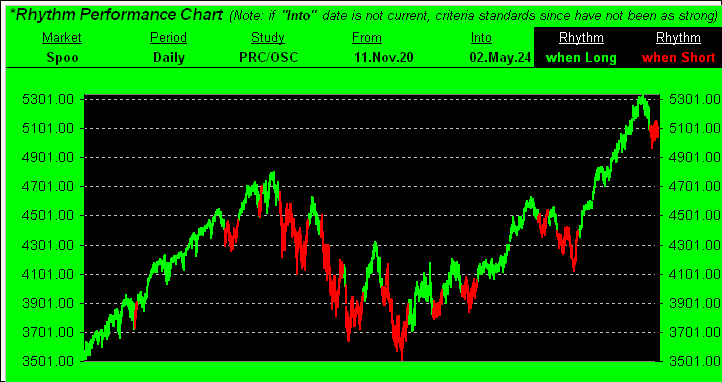
Market Rhythm
The Spoo’s best Market Rhythm at present is displayed in this Market Rhythm chart, its attributes as labeled. When this Rhythm has been positive, the Spoo’s price is shown in Green (i.e. Long), else when negative the price is shown in Red (i.e. Short).